


Bitcoin’s short-term Sharpe ratio has fallen to a level that has historically preceded price bottoms, according to CryptoQuant analyst Ignacio Moreno de Vicente.
Bitcoin’s Short-Term Sharpe Ratio Hit a Level Historically Reserved For Generational Buying Zones
“The arrows in the chart illustrate this clearly: each prior extreme negative reading was followed by violent recoveries to new highs.” – By @MorenoDV_ pic.twitter.com/nxFBUgHxi9
— CryptoQuant.com (@cryptoquant_com) February 19, 2026
The metric hit -38.38. Similar readings were seen ahead of market reversals in 2015, 2019 and late 2022.
The Sharpe ratio measures return adjusted for risk. A deeply negative short-term reading signals not just weak profitability but maximum loss per unit of volatility — in other words, a sharp and deep decline. For many participants, that marks capitulation.
“The deepest drawdowns in the metric were not the start of prolonged bear markets. They marked the exhaustion of selling pressure. The arrows in the chart illustrate this clearly: each prior extreme negative reading was followed by a violent recovery to new highs,” the expert explained.
In probabilistic terms, he said, the risk-reward for medium- and long-term positions looks “asymmetrically favourable”. The risk of further downside is already largely embedded in momentum indicators.
The main threat, according to Moreno de Vicente, is a macro liquidity shock that could prolong the bottoming process.
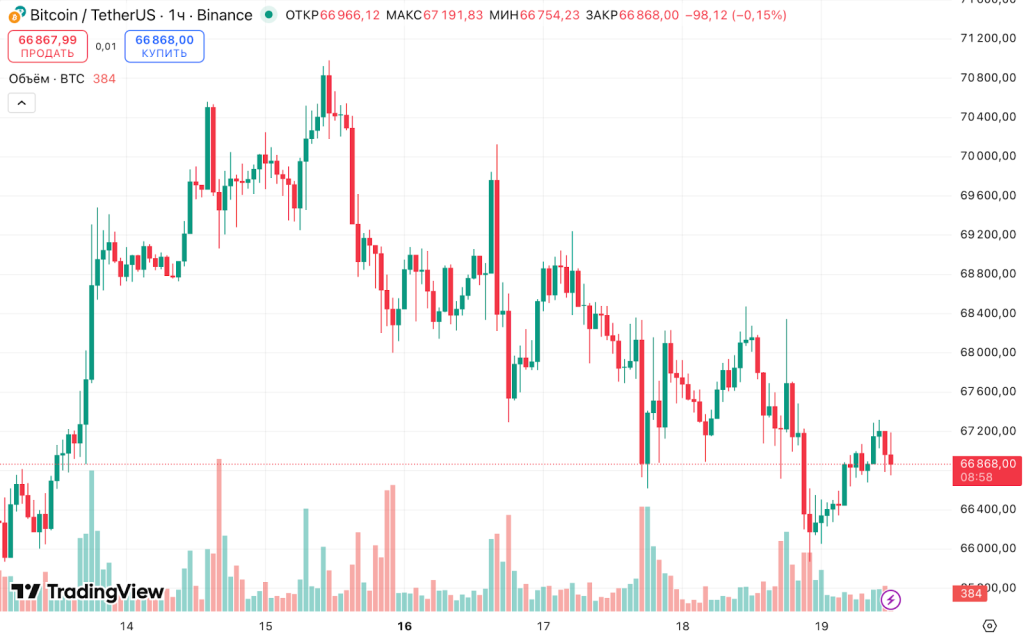
At press time bitcoin was trading around $66,800, down 2% over the past 24 hours.


Another bottoming signal
Stress among bitcoin’s short-term holders (STH) has dropped to levels seen at the 2018 bear-market bottom.
Bollinger Bands for STH point to the most oversold conditions in eight years. The metric measures the gap between the current price and the average purchase price of those holding coins for fewer than 155 days.
Bitcoin STH Bollingers most oversold in 8 years pic.twitter.com/tHyBv3V1Ge
— Quinten | 048.eth (@QuintenFrancois) February 17, 2026
A break below the lower band means bitcoin has fallen well beneath recent buyers’ entry prices, beyond typical historical volatility.
Historically, this signal has coincided with major bottoms. In late 2018, a similar oversold reading preceded a 150% rise over 12 months and 1,900% over three years.
A similar signal appeared before the November 2022 lows. What followed was a 700% rally — to a new all-time high around $126,000.
Earlier, Matrixport analysts pointed to the formation of a “durable bottom” and the exhaustion of selling pressure. However, CryptoQuant specialists questioned whether the correction in the leading cryptocurrency had ended.
A return to accumulation
Large investors have shifted tack: after six months of distribution, they have resumed accumulation, noted CryptoQuant analyst Burak Kesmeci.
Bitcoin’de uzun vadeli yatırımcılar yeniden alıma mı geçiyor?
Son 6 aya baktığında ortada net bir satış dalgası vardı. Uzun vadeli yatırımcılar (LTH), fiyat yüksekteyken ellerindekini yavaş yavaş boşalttı. Ama 12 Ocak 2026’dan itibaren bir şey değişti.
Yeniden alım geldi,… pic.twitter.com/ORq6bJb9b5
— Burak Kesmeci (@burak_kesmeci) February 18, 2026
He said the turn came after January 12, when bitcoin fell into the $62,000–$68,000 range. Year-to-date data confirm this: accumulation by long-term holders (LTH) has risen to 115,000 BTC, and selling pressure has nearly vanished.
“The most patient investors in the market are back in the game,” the expert noted.
However, Kesmeci doubts that this pace of buying is sufficient to reverse the trend. Despite LTH returning, there is no pronounced momentum yet.
He believes the decisive factor will be buying dynamics in the coming weeks.
“Historically, this picture often precedes the calm before a big move. At a minimum, one can say this: selling pressure from long-term holders has ended. At least for now,” he concluded.
K33 analysts have noted signals of a late bear phase in bitcoin.