


When oil jumps 50% in three weeks, markets usually react on autopilot: sell the riskiest first. History bears this out — after Iraq invaded Kuwait in 1990, crude prices doubled and the S&P 500 shed about 9% in a month. Bitcoin, the market’s twitchiest asset, would seem first in line for the chop in such a scenario.
In spring 2026 the hypothesis got a real-world test. The Strait of Hormuz, conduit for a fifth of seaborne oil, became a conflict zone, Brent prices surged past $100, and analysts braced for a familiar sell-off. Contrary to expectations, the first cryptocurrency not only held up — it rose even as gold fell.
The divergence between the forecast and what actually happened invites a rethink of the asset’s nature. Once largely correlated with high-beta segments, bitcoin now looks to be shifting from a speculative instrument to a partly autonomous asset class.
The open question is whether this shift is durable — the result of structural changes in demand — or merely a quirk born of a specific shock. Here is what may lie behind the coin’s paradoxical behaviour.
The illusion of linkage
For old-school macroeconomists a dogma long held sway: an energy shock is poison for risky assets. When in February 2026 tension in the Strait of Hormuz morphed from a smouldering political flare-up into a full-blown logistics crunch, markets braced for a textbook “black swan” scenario.
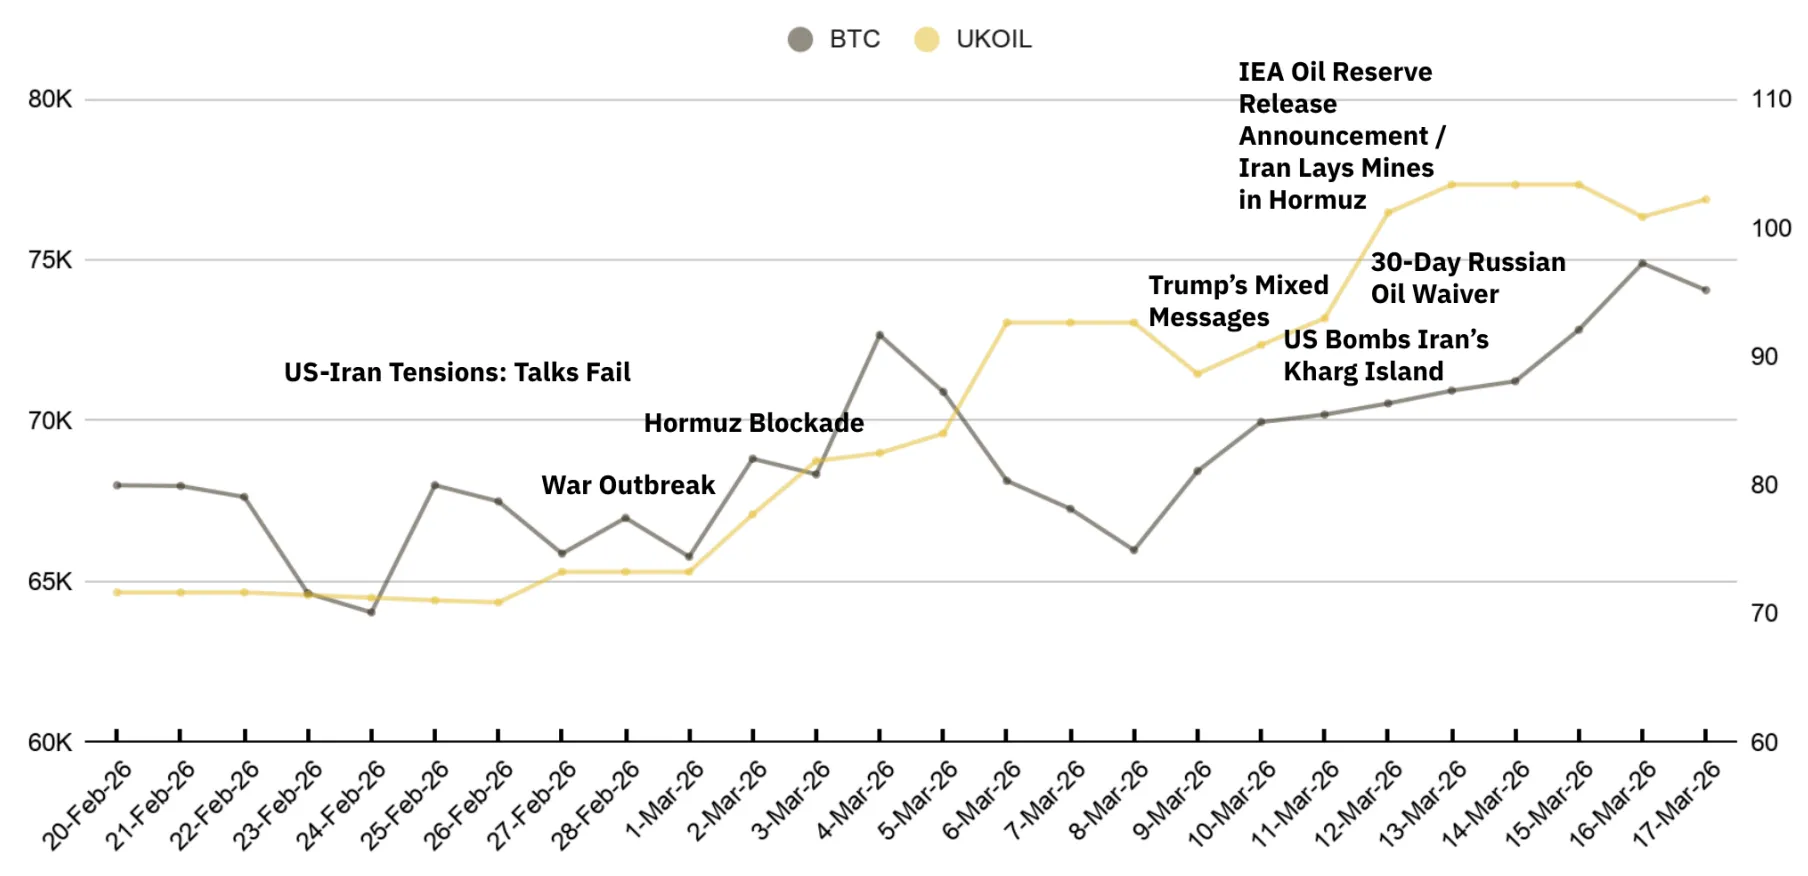
A crucial artery handling about 20% of global seaborne crude sat in the eye of the storm. Brent leapt from $69 to above $104 in under a month (+50%) — among the sharpest moves in modern history.


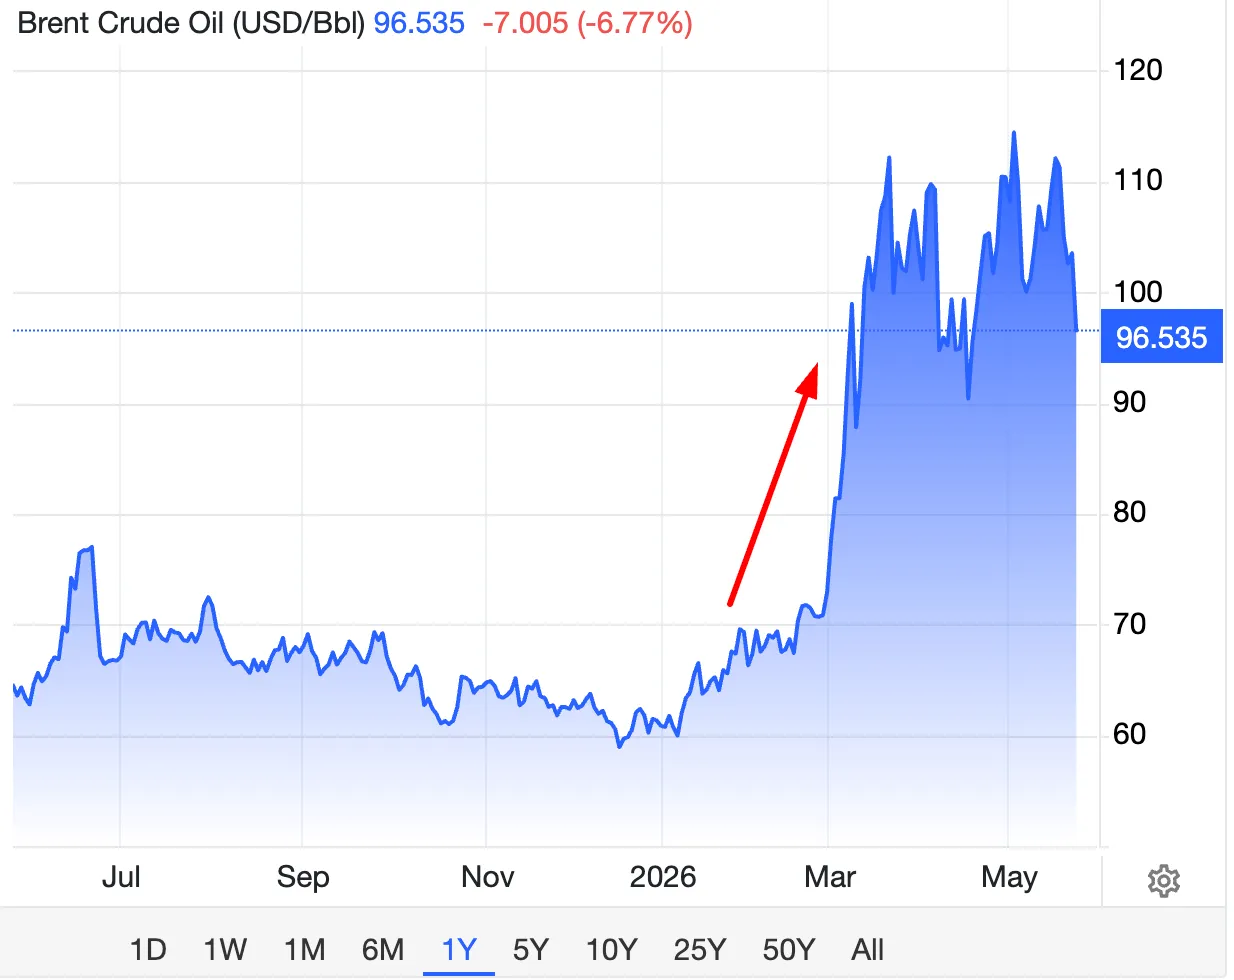
Enter the “Hormuz paradox”. While mainstream bank analysts reworked inflation models and foretold a rout in all things intangible, bitcoin displayed not just resilience but studied indifference.
As oil swung wildly, the first cryptocurrency rose 15% over the same span, outpacing gold (-3%) and the Nasdaq (+1%). That calls into question the notion that bitcoin is merely a gauge of global liquidity or a shadow of commodity cycles.

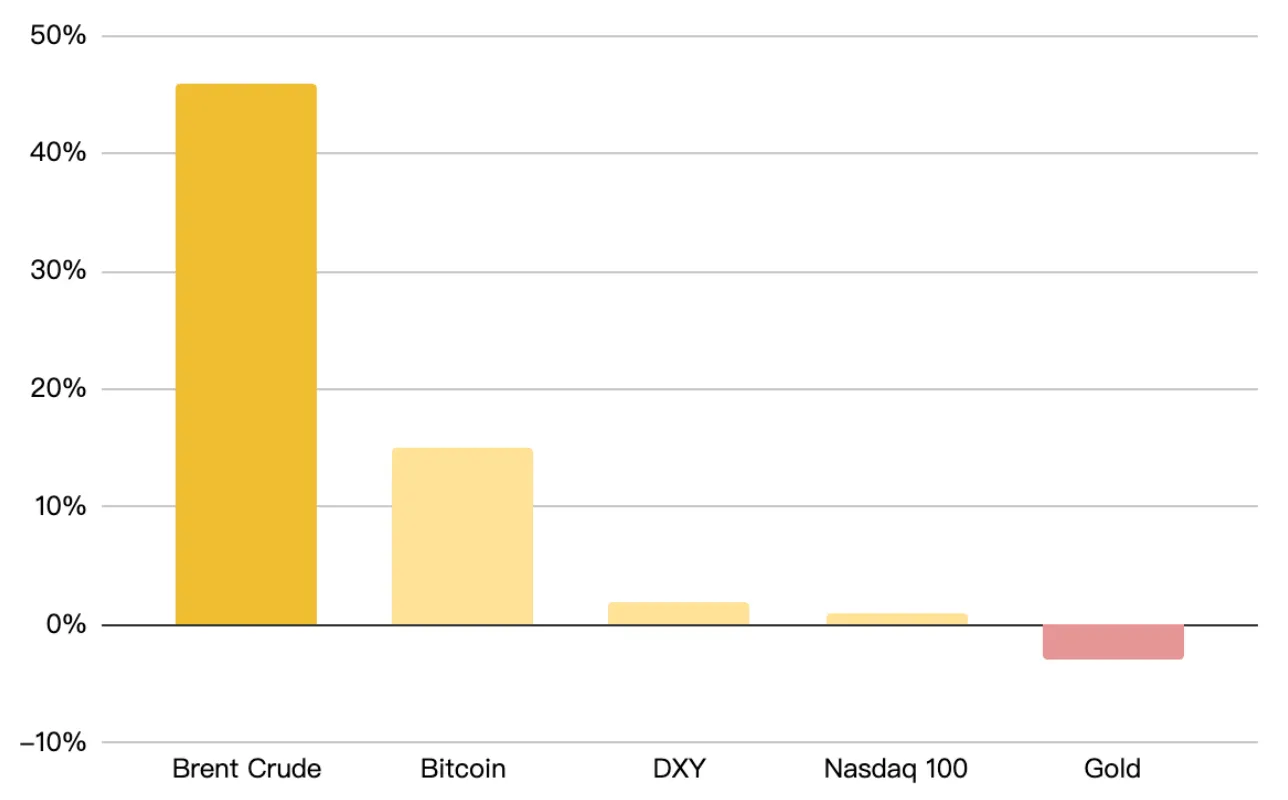
Performance of various assets in the first weeks of the “Hormuz crisis”. Source: Binance Research.
Put simply: digital gold now obeys its own rules, and big institutional money outweighed the oil shock. The inflection point for that independence was the launch of spot ETFs in the United States in January 2024 — a change both deep and lasting.
Crisis chronicle: oil in turbulence
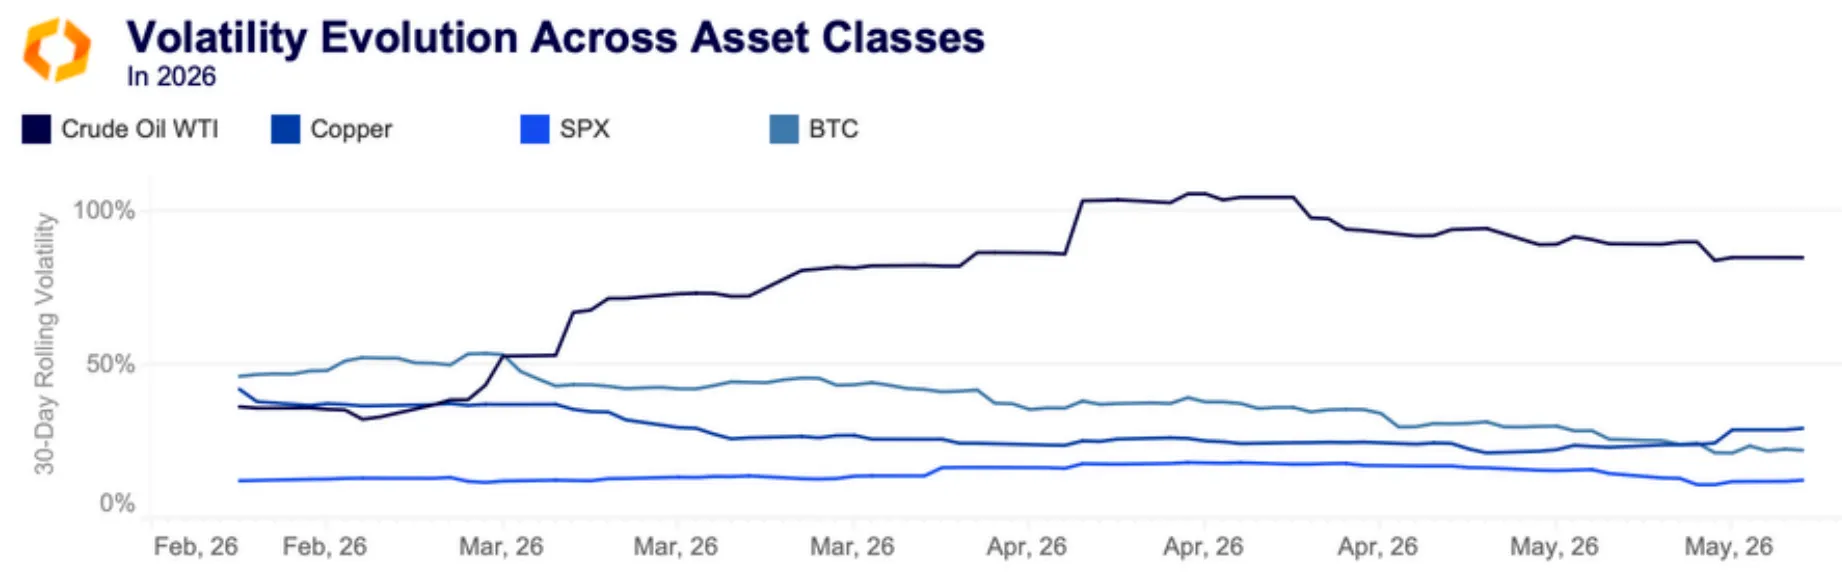
According to Kaiko, between February and May the oil market shifted regimes and became hostage to headlines: prices reacted to each update on conflict, supply risk and any hint of de-escalation.
After dozing around $60 a barrel early in the year, WTI and Brent settled above $100 by spring. It was not a mere climb; prices ricocheted with the newsflow: oil volatility topped 100% in April and stayed near 85% even in relative lulls.

Most telling was the “Trump effect”. On April 7th 2026, after a two-week temporary truce with Iran was announced, WTI plunged more than 15% within hours.
The market reacted instantly; remove the threat and the risk premium evaporated. In those months crude pricing hinged less on supply-demand balance than on the odds of another strike on terminals.
Binance Research distils a three-phase pattern in bitcoin’s response to the chaos:
Phase 1: anticipatory shock (Feb 26–28). After Geneva talks with Iran hit a dead end, oil jumped to $73. Under pressure from ETF outflows, bitcoin fell to a crisis low of $63,047 on February 28th — a Saturday, when liquidity is structurally thin, underscoring the technical nature of the dip.
Phase 2: shock absorption (Mar 2–8). Oil’s most intense spell — Brent up 35% in a week. Logic said bitcoin should crack. Instead, it moved into an accumulation band at $66,000–73,000, steadily buying dips.
Phase 3: independent rally (Mar 9–18). Full decoupling. While oil attacked $104, bitcoin climbed from $66,000 to $75,000.
Over 24 days the coin rebounded 18.8% from its local trough, largely ignoring the “energy apocalypse”.

Busting the myth: is bitcoin’s price tied to oil?
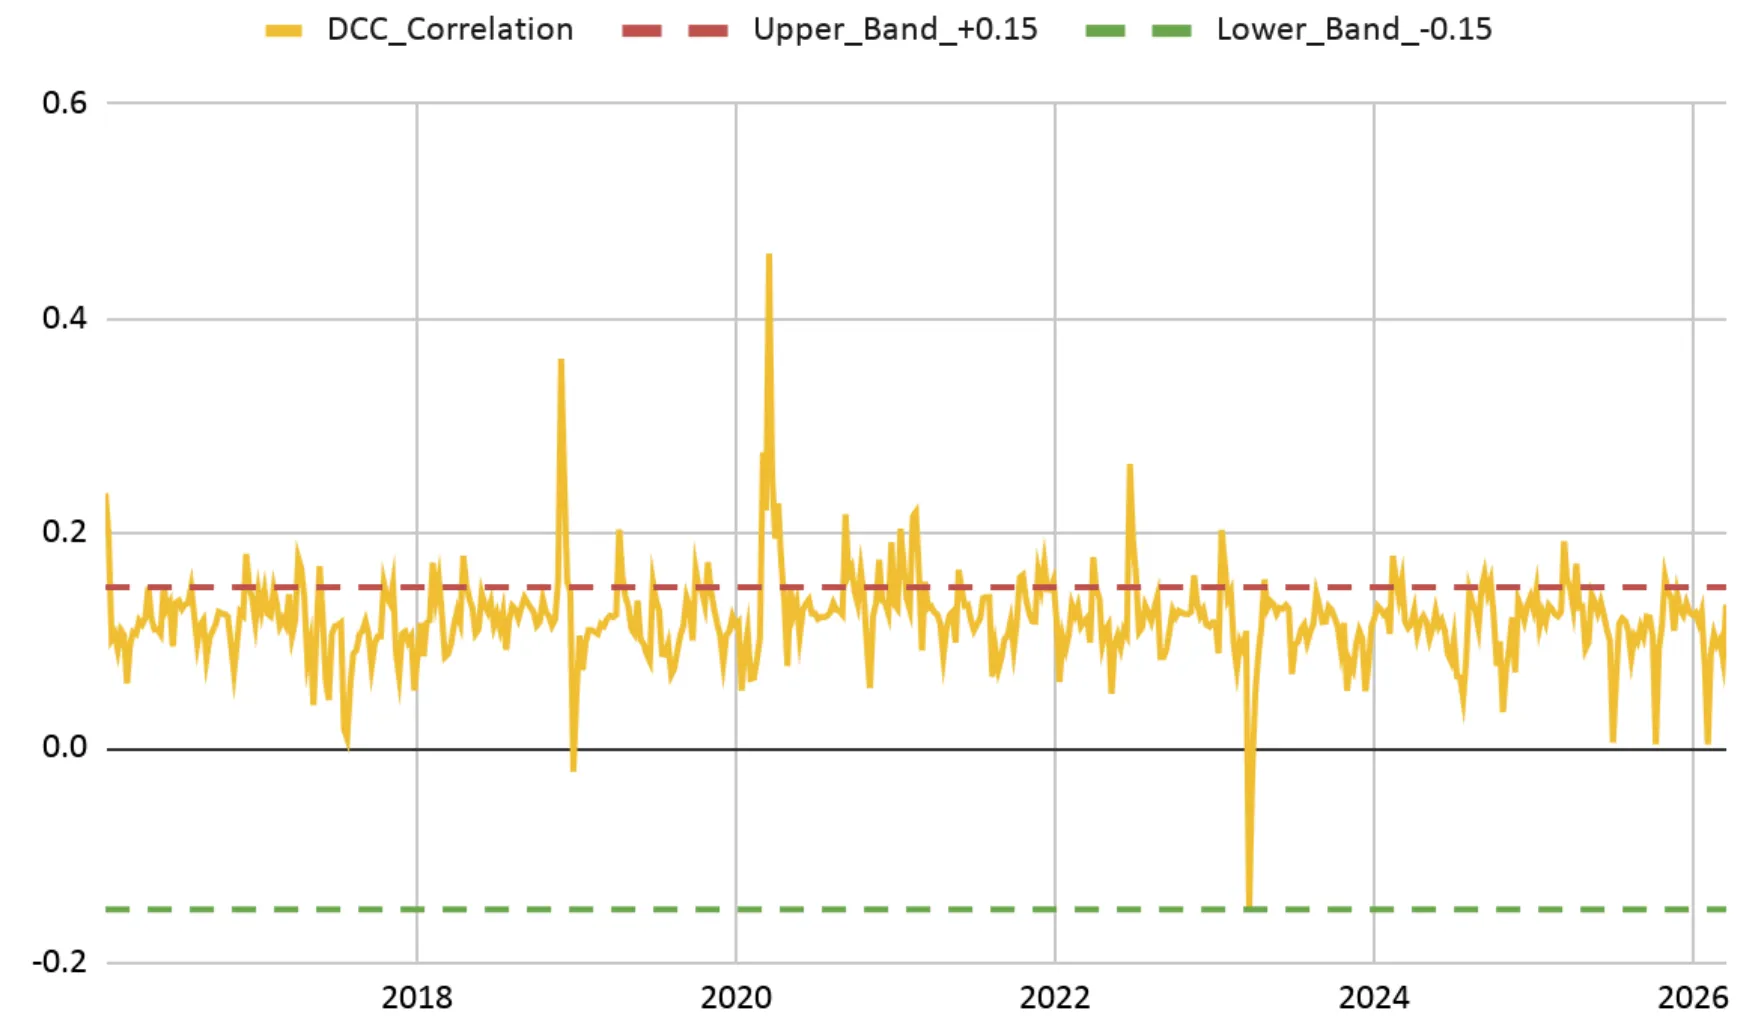
Many traders line up bitcoin and oil charts in search of synchronicity. Binance Research, analysing a decade of data from 2016 to 2026, finds no stable link.
The key methodological error is comparing price levels without accounting for trend. At first glance the assets may look in step, but that is an illusion born of both series rising over time.
Part of that ascent reflects dollar debasement and broader inflation, which lifts prices across assets from commodities to housing. Apparent logic can emerge even where no real economic linkage exists.
Statisticians call this a spurious correlation.

To strip out the effect, analysts compare not levels but week-on-week percentage moves — a cleaner basis for inference. The results by period:
- 2016–2019: virtually no link between bitcoin and oil;
- 2020–2022: a correlation appears — the only such spell on record. Oil was not the driver. With US rates near zero, the ФРС massively expanded liquidity: its balance sheet swelled from $4.2trn to $8.9trn. Quantitative easing lifted all boats — oil and bitcoin alike. They merely rode the same tide of cheap money; no true linkage was present;
- 2025–2026: correlation fades again. Bitcoin and oil go their separate ways.

One last question: can oil prices at least hint at bitcoin’s next move?
Analysts tested this with the Granger causality test, which shows whether yesterday’s move in one asset helps predict tomorrow’s in another. The answer: no. Across horizons from one to ten weeks, oil says nothing about bitcoin’s future. Even in the “odd” year of 2020 there was no predictive power.
The takeaway is simple: bitcoin does not follow oil. It barely notices it.

The commodity landscape: copper versus natural gas
If oil was 2026’s epicentre of chaos, other commodities behaved more prosaically.
Kaiko highlights a “copper signal”. Prices jumped from $5.3 to above $6.3 in two months. The drivers were far from the Middle East: a fundamental supply shortfall, compounded by Peru — the world’s third-largest copper producer in 2025 — facing severe disruptions.

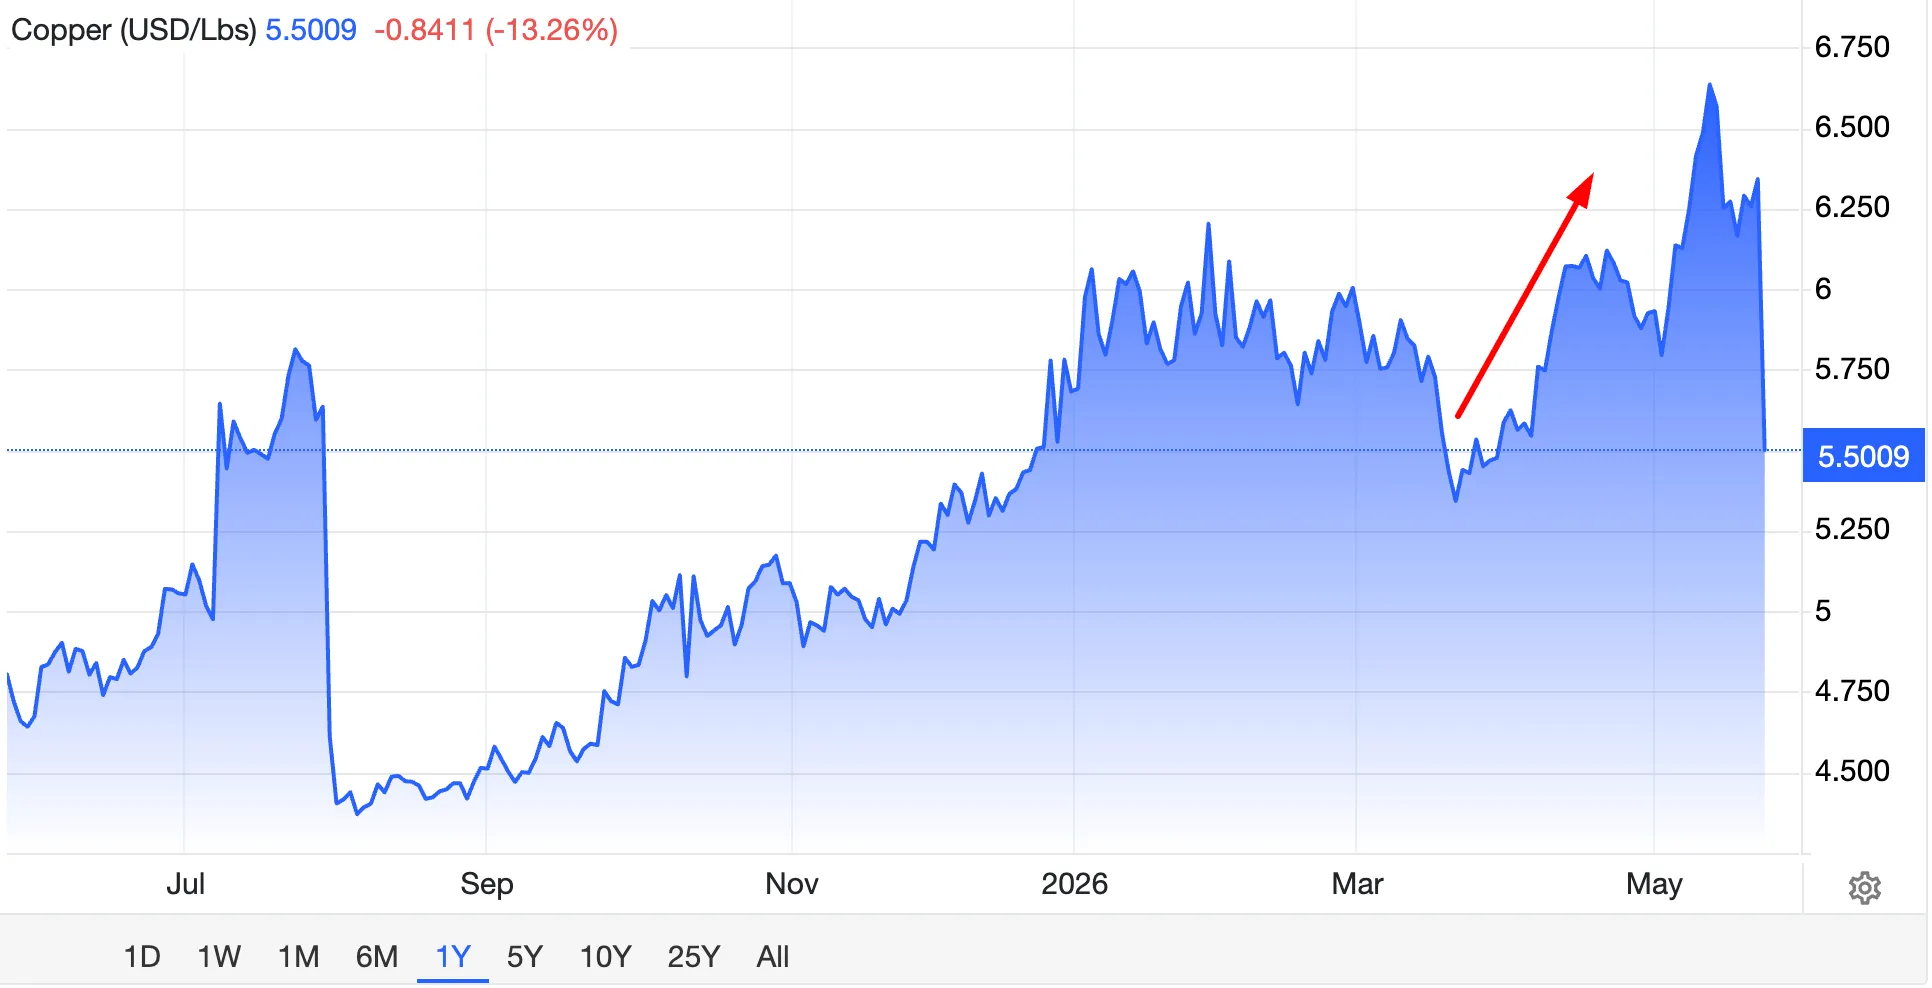
Metal gains came from forces unrelated to the barrel:
- AI infrastructure: the data-centre boom demands vast amounts of copper to upgrade grids;
- the energy transition: the red metal remains irreplaceable in EVs and renewables.
Natural gas, meanwhile, danced to local supply and demand, paying scant heed to geopolitics.
Ironically, gold — the classic haven — fell 3% at the crisis peak. The metal buckled under a stronger dollar and expectations of higher rates.

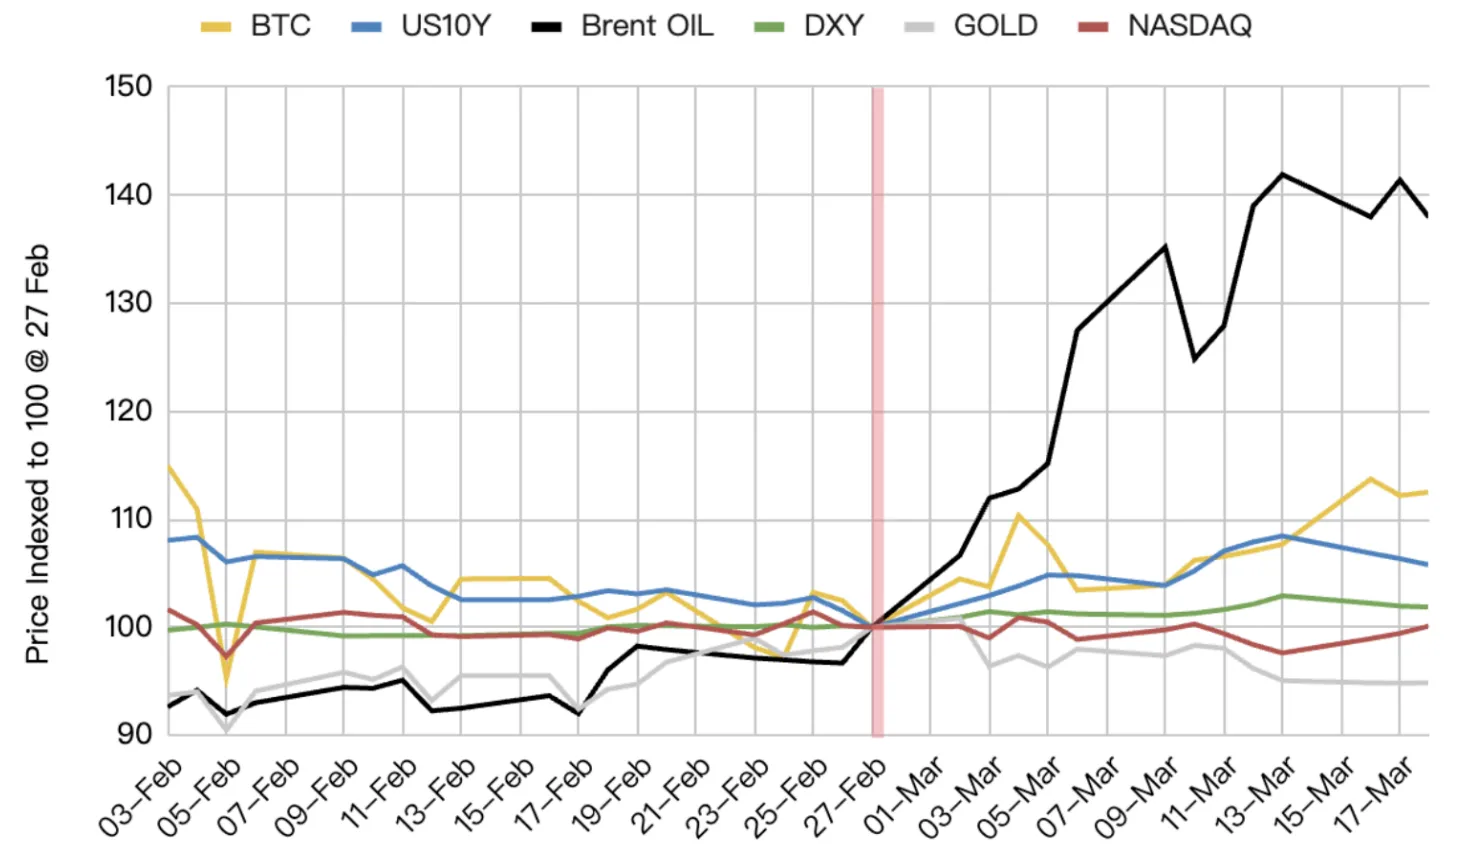
The fact bitcoin rose while gold slipped puts them in different corners. The first cryptocurrency no longer shadows the metal; it is now an institutional class with its own pricing logic.
Institutional absorber: ETFs and corporate treasuries
Why did bitcoin not tumble with other risk assets under a macro shock? The answer likely lies in a structural shift post-January 2024. The launch of US spot ETFs created a powerful liquidity sink that altered the market’s reflexes.
Capital flows in March 2026 reveal the mechanism. Three independent demand channels were at work.
Spot ETFs
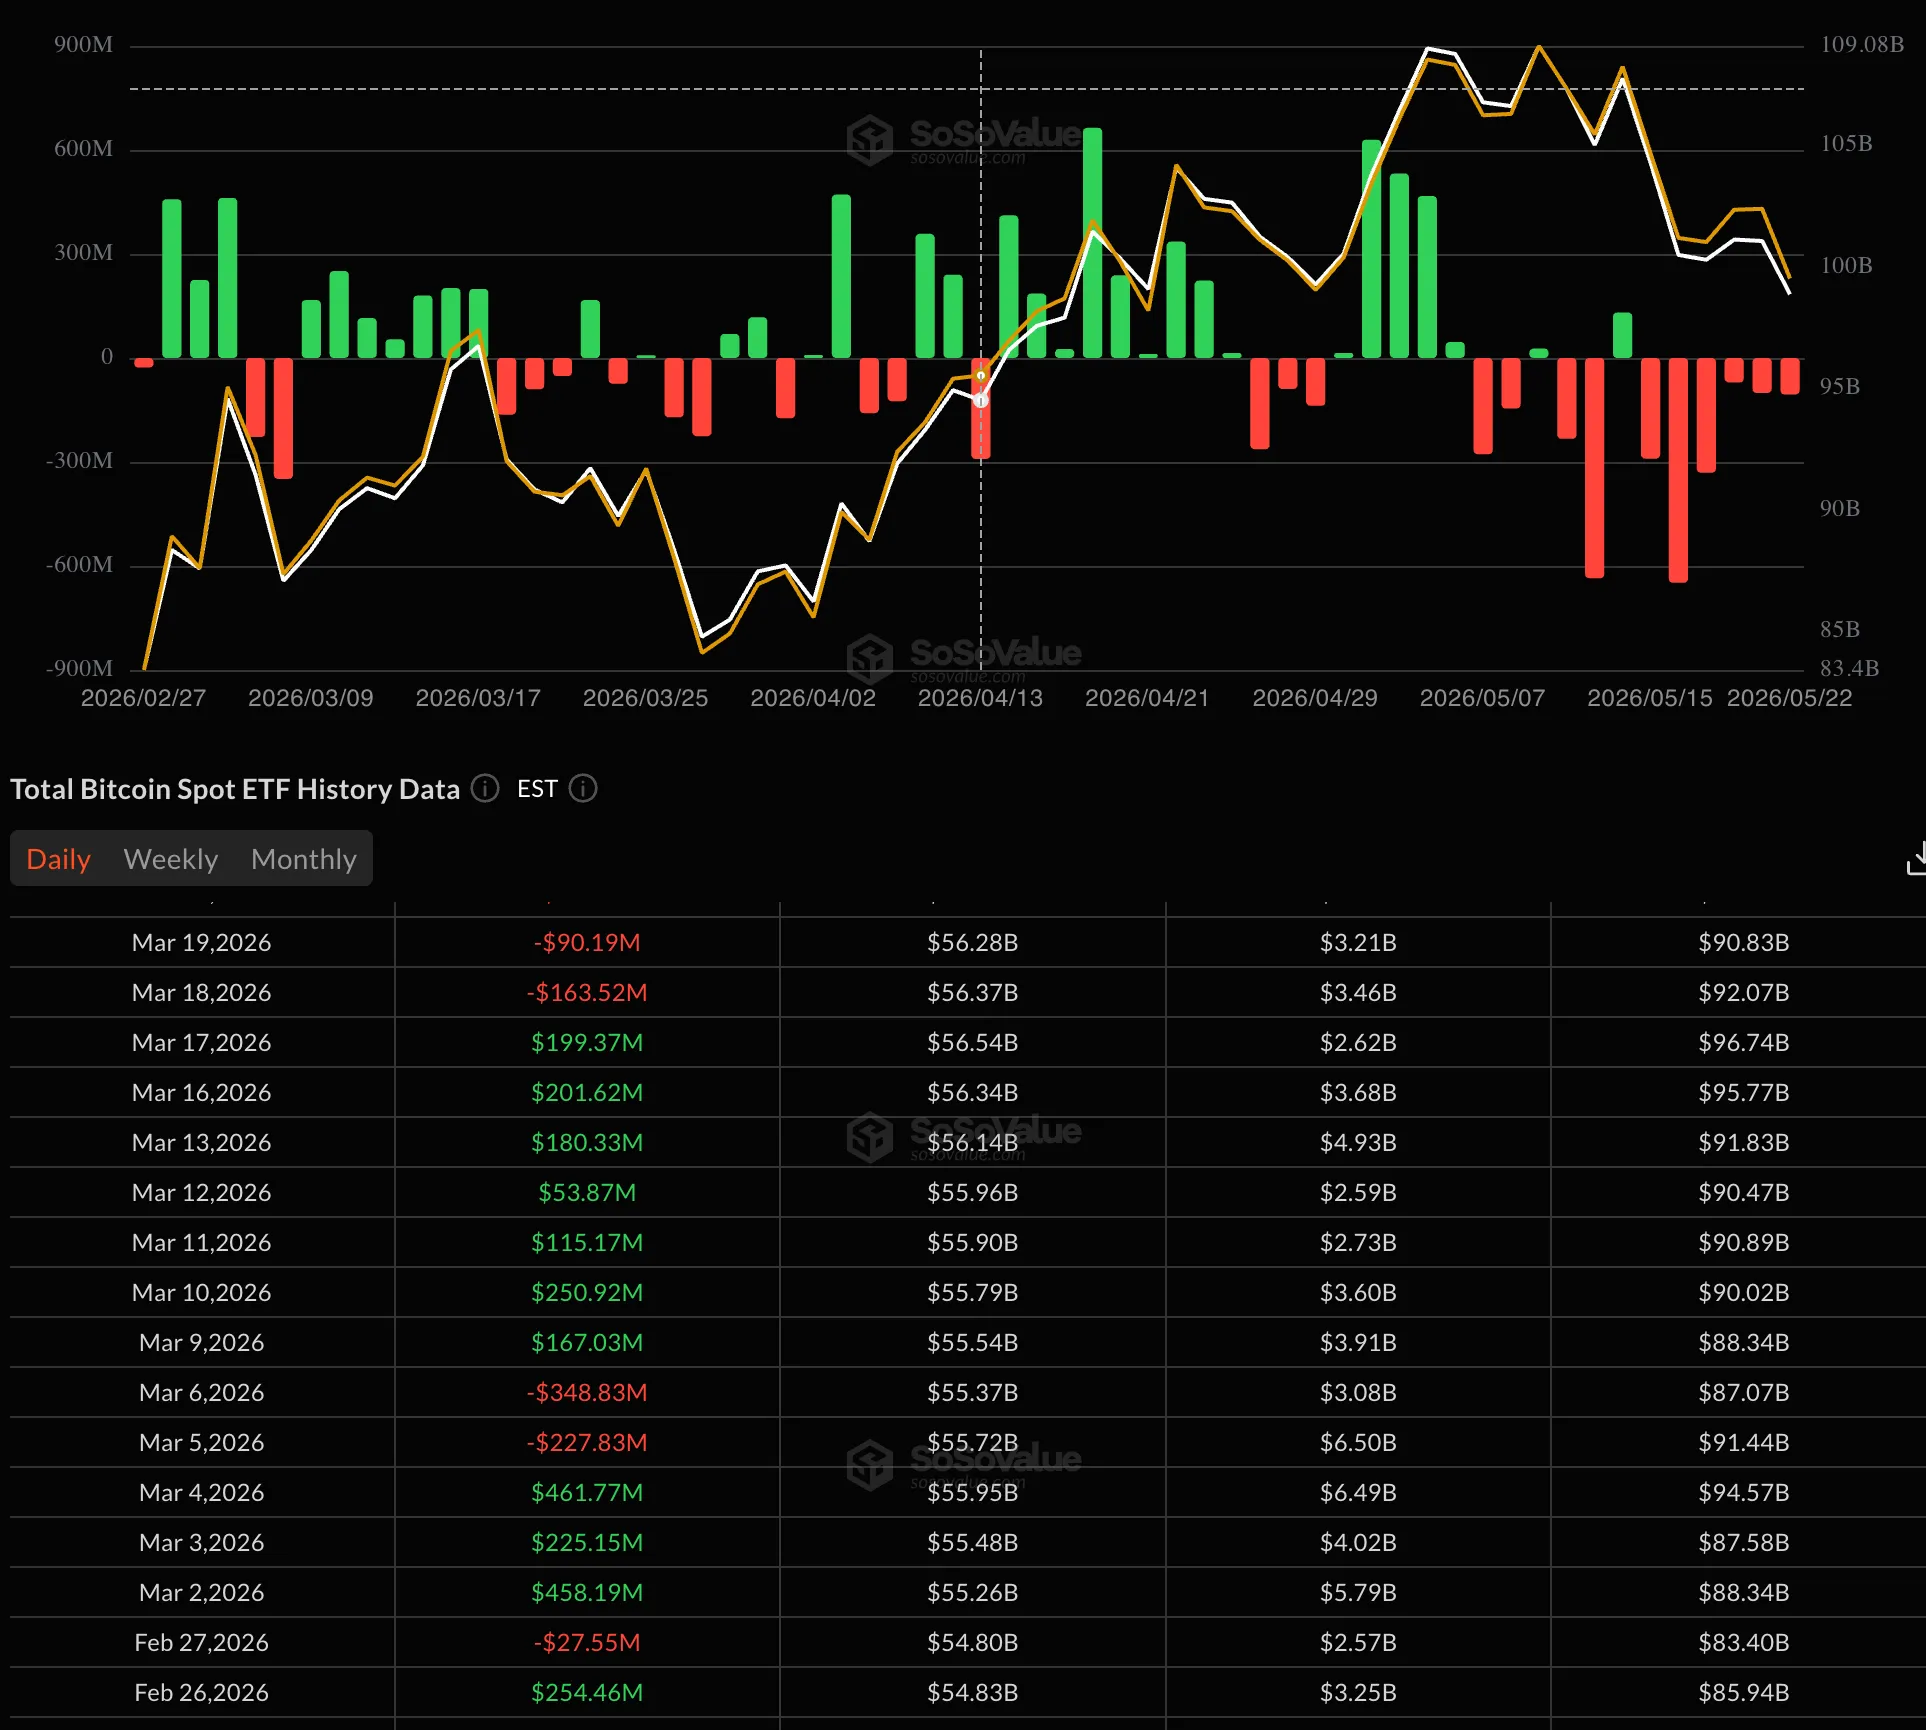
Binance Research data show institutions treated the shock as a gift-wrapped entry. From March 2nd to 4th, as oil accelerated, net inflows to ETFs hit $1.15bn (three straight days: $458m, $225m, $462m).
During the recovery, March 9th–17th brought seven more consecutive inflow days totalling $1.16bn. The tally over the crisis period topped $1.7bn.

The Coinbase premium
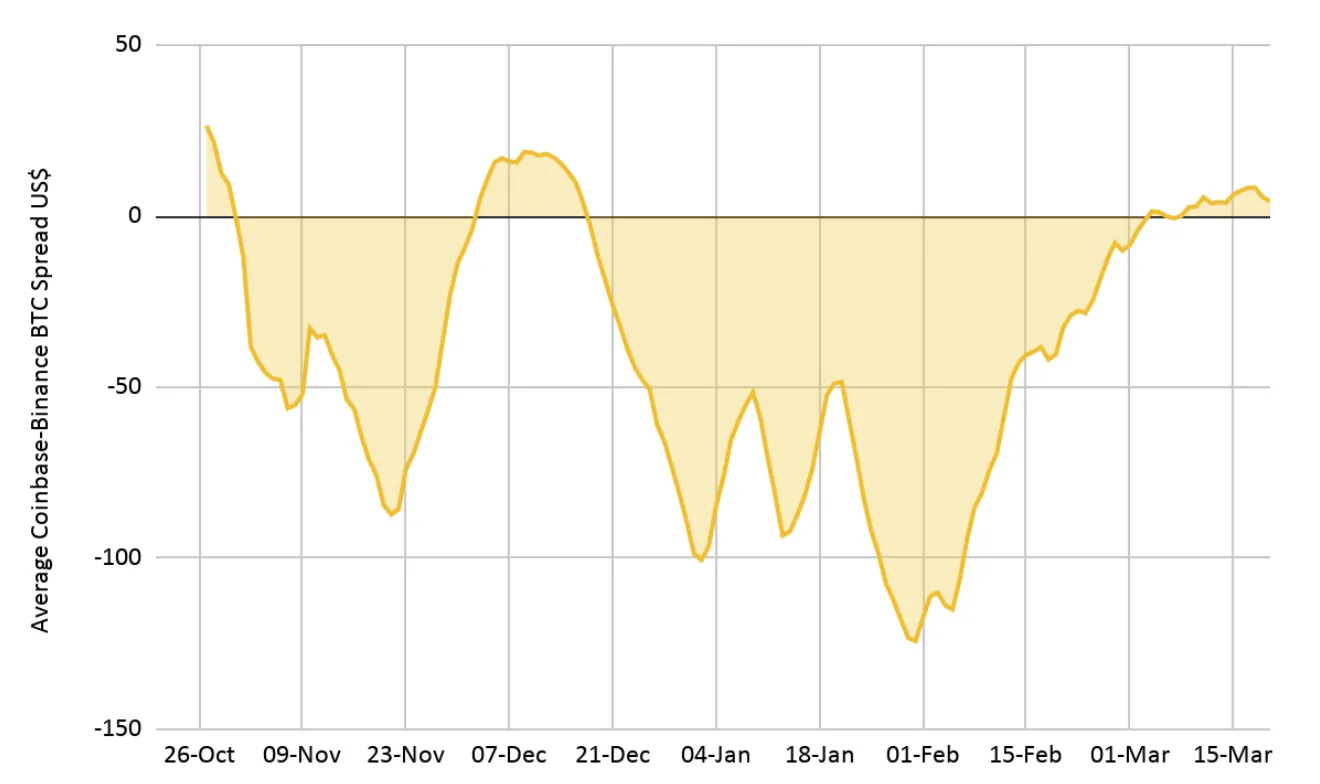
The Coinbase–Binance spread turned firmly positive in early March — a clear sign that US institutions drove the bid. As retail flinched, “smart money” sterilised on-exchange supply.

Corporate treasuries
Strategic buyers such as Strategy and BitMine ignored the macro noise. By March 2026 their combined holdings reached $8.3bn. They add weekly, laying a “concrete floor” under price that headlines about blocked straits struggle to crack.

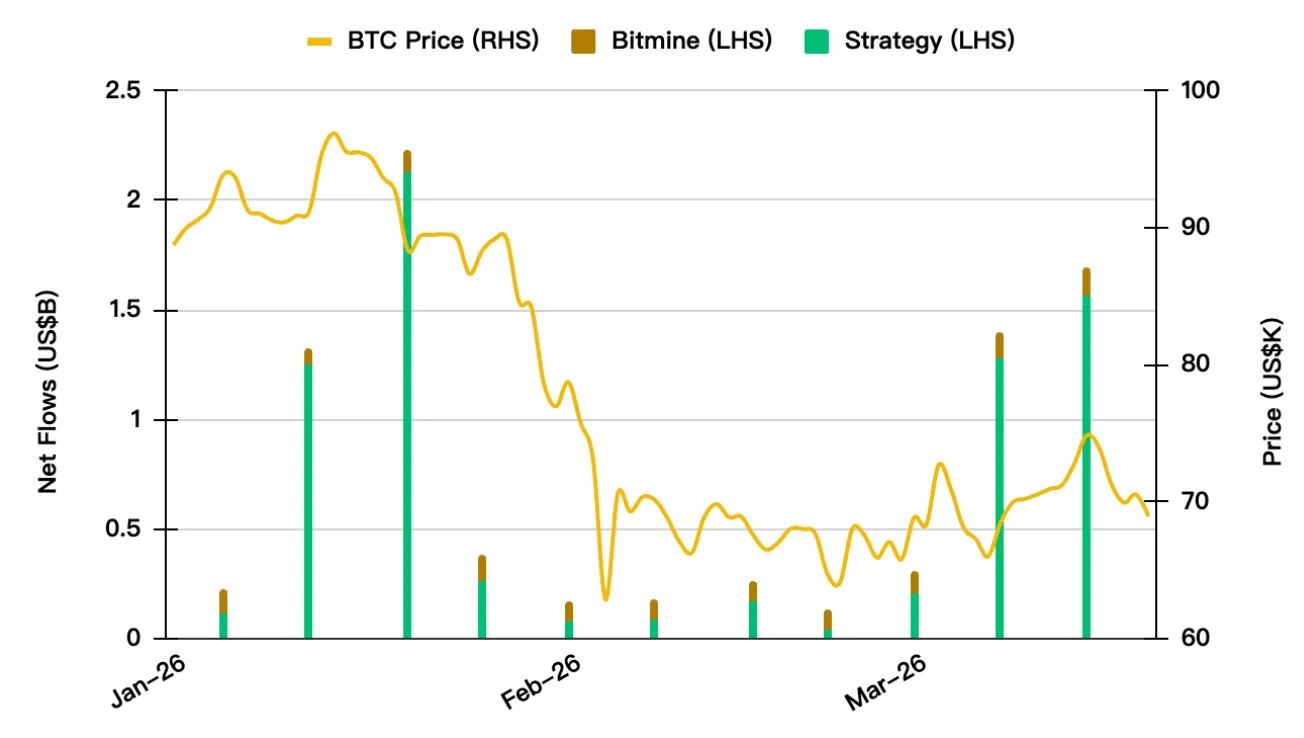
All three channels fired at once — changing market logic. The greater the uncertainty, the more actively institutions bought bitcoin, treating dips as entry points.
Bitcoin as a neutral settlement asset
The Hormuz crisis cast digital gold in an unexpected role. Iranian authorities named it among the ways to pay tanker tolls through the strait — alongside the yuan and dollar-pegged stablecoins. The appeal: resistance to censorship and seizure.
“This is one of the clearest situations in which bitcoin very clearly acts as a strategic asset. Iran wants to use bitcoin for these transactions because it cannot be frozen. The network of the first cryptocurrency cannot be shut down,” —said Bitcoin Policy Institute head of research Sam Lyman.
Crypto payments have yet to show up: according to Lyman, on-chain data do not confirm them, and most of Iran’s settlements are in USDT. Since 2022 the country has moved about $3bn in crypto, of which the US Treasury managed to freeze roughly $500m.
Iran is also building supporting infrastructure. The Ministry of Economy launched the Hormuz Safe platform to insure vessels in the Persian Gulf and Strait of Hormuz, with payment in bitcoin and other cryptocurrencies — bypassing SWIFT and Western intermediaries.
Authorities hope to earn over $10bn; transit tolls can reach $2m per tanker. The platform lacks international recognition, and using it risks US secondary sanctions.
Historical echoes: 2022 vs 2026
History rhymes, and investors seldom learn. Compare bitcoin’s reaction to the start of the full-scale war in Ukraine in 2022 with the Middle East events of 2026: in both cases the coin rose in the first four weeks — +24% in 2022 and +15% in 2026.

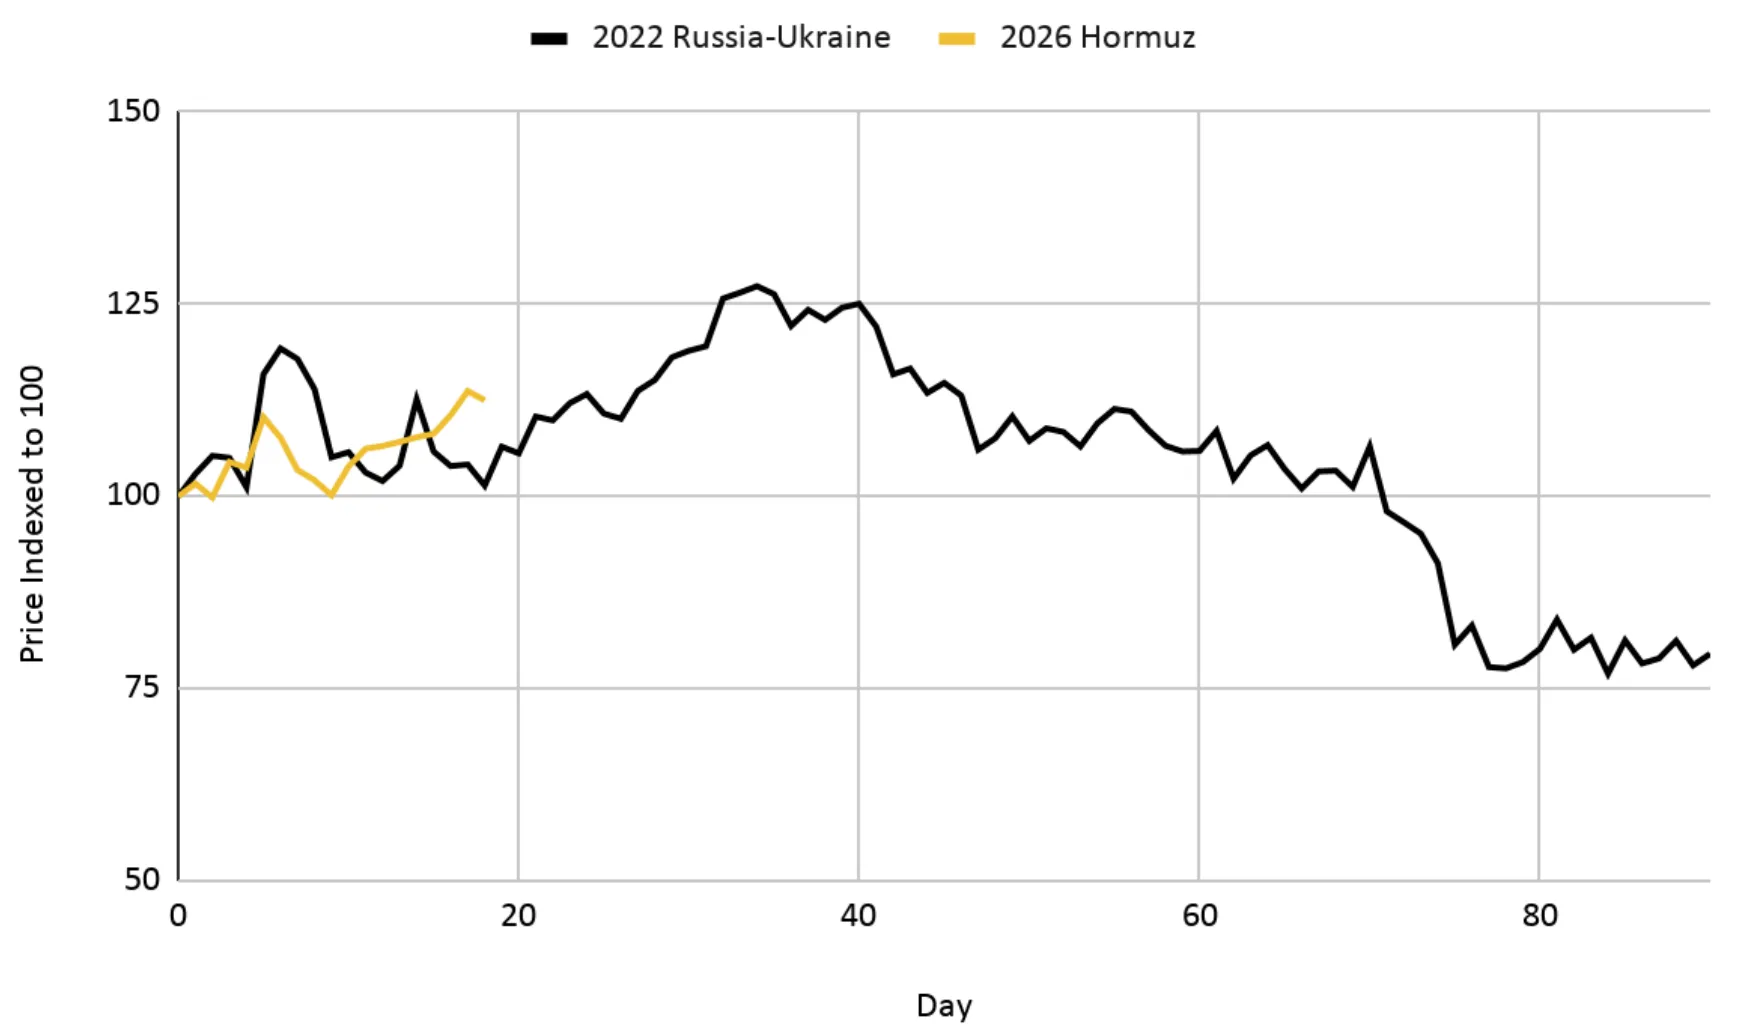
The chief lesson: bitcoin is less hostage to conflicts and oil than presumed. Its real threats are internal. In 2022 the ensuing crash stemmed not from geopolitics but from the collapse of Terra/LUNA and the implosion of Three Arrows Capital (3AC) — liquidity and trust crises with hefty volatility.
Energy balance
Mining progress also mattered. The old chain ran: dearer oil raises electricity costs, pushes up mining breakevens and forces selling. That chain now breaks.
Cambridge University data put clean energy’s share in bitcoin mining at 52% — oil and coal no longer set digital gold’s production cost.
Efficiency
The 2024 halving, which cut block rewards to 3.125 BTC, enforced tough selection. By 2026 only ultra-lean operators remained — able to shrug off short-lived surges in energy prices.
ETF factor
Institutional flows now dwarf miners’ daily sales many times over, limiting their sway on marginal pricing.
What next: from de-escalation to stagflation
Resilience is not invincibility. Binance Research sketches scenarios should the conflict evolve differently.
“Peace”
With full de-escalation in the Middle East, oil’s political-risk premium would vanish. Bitcoin would return to its internal drivers — supply cycles and ETF adoption.
A path of measured, organic growth — the coin edging towards a “boring” asset for pension funds.
“Escalation”
If oil breaks $150 and holds for 3–6 months, a liquidity crunch akin to 2008 looms. In mass margin calls across asset classes, correlations lurch towards one.
Bitcoin could face forced selling by large funds covering losses elsewhere. That would be a “universal deleveraging” risk, not an oil-price risk per se.
“Stagflation”
Slowing growth with high inflation would keep the Fed hawkish — perhaps the sternest test. Will bitcoin prove protection against fiat debasement, or remain captive to risk appetite?
In that world the coin should respond more to real rates — yields on safe assets minus inflation. The higher the risk-free return, the fewer the holders of a non-yielding asset.
The stress test continues: what late May revealed
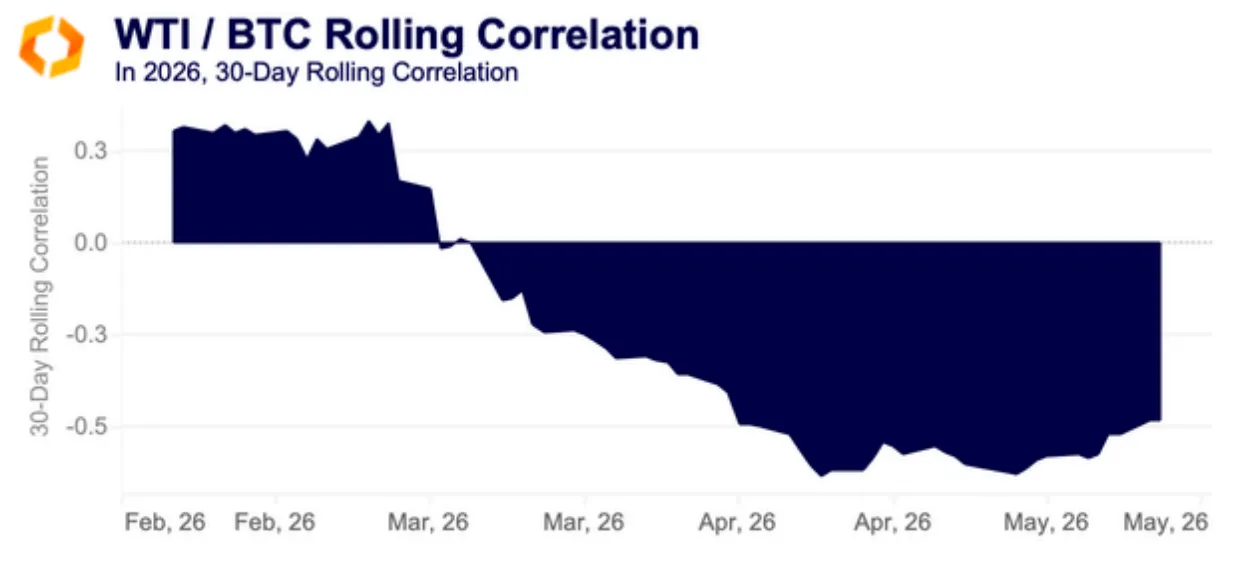
All of the above covers February–April, when the coin held up strikingly well. By late May the picture shifted.
On May 23rd bitcoin fell to $74,300 — the lowest since April 20th and roughly 10% below the local high above $82,500 set on May 6th.

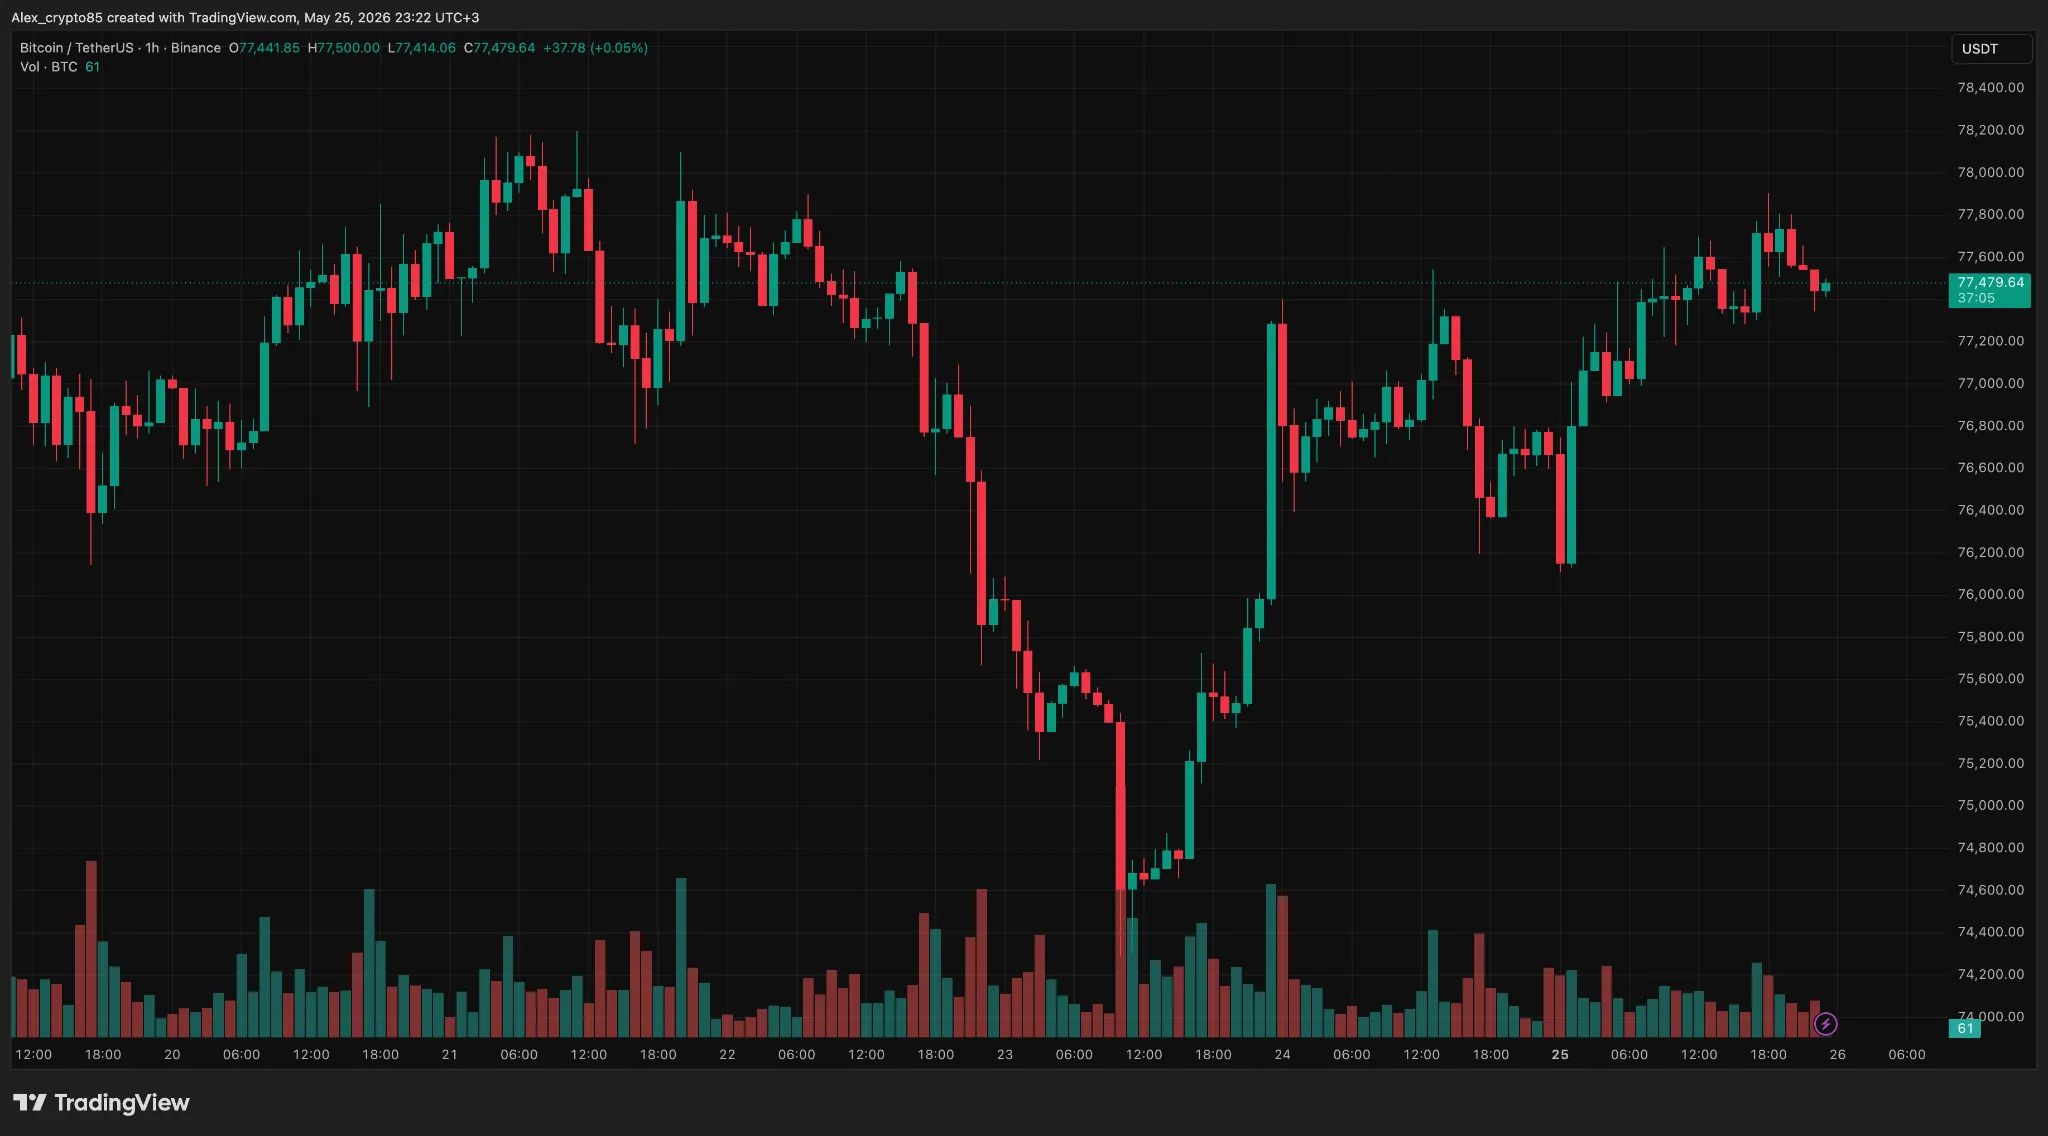
Over two weeks, net outflows from US spot bitcoin ETFs exceeded $2.26bn, with $1.26bn in a single week — the most since January. The sell-off coincided with rising US Treasury yields.

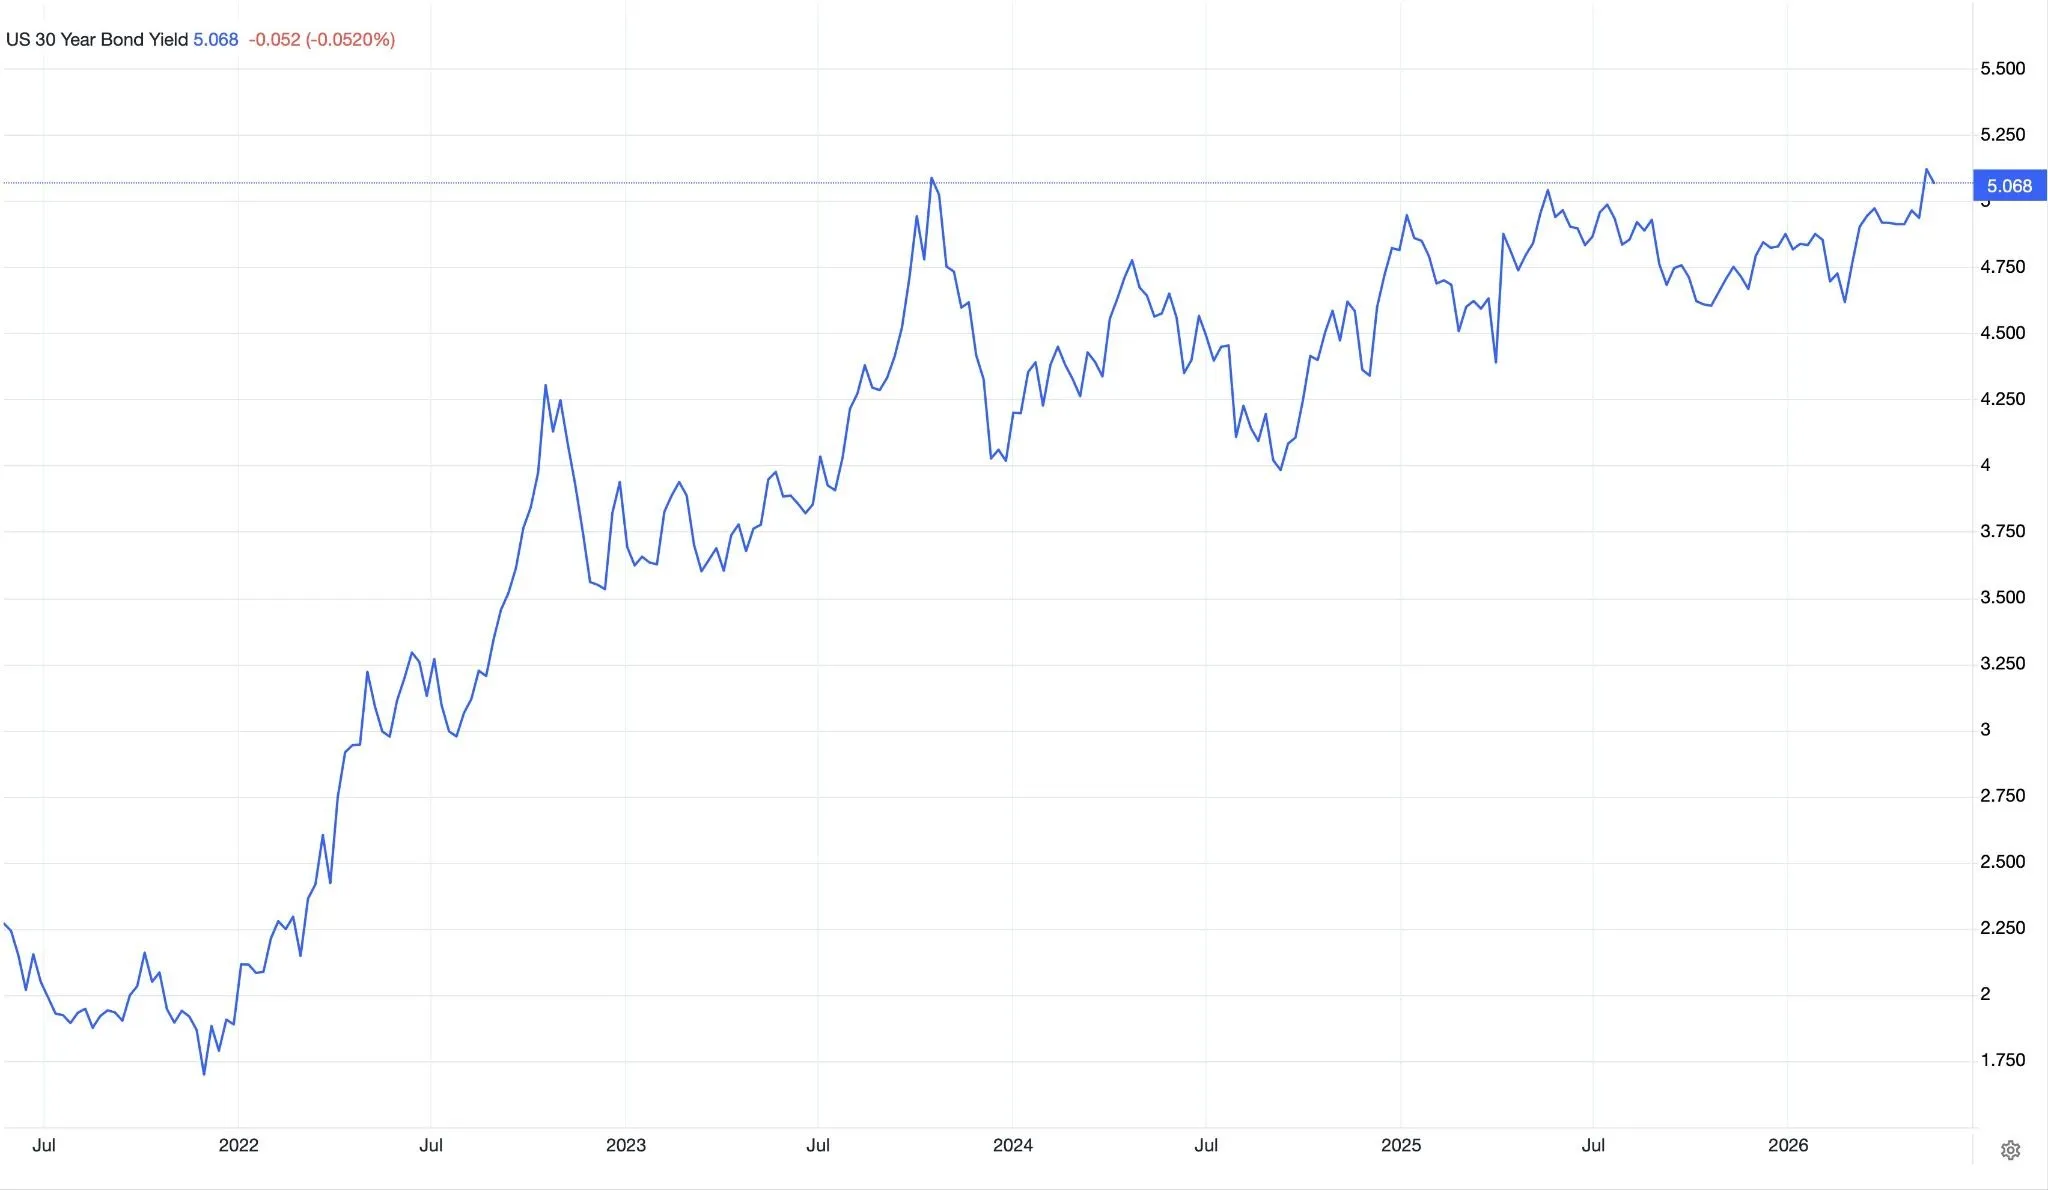
The very institutional demand channel that acted as a “concrete floor” in March flipped. This is precisely the caveat Binance Research flagged in early spring: bitcoin’s detachment from macro risks is conditional, resting on the post-ETF market structure. Meanwhile capital rotated into commodities — oil, copper, sulphur.
Bitcoin needs separating from the rest of crypto here. Fundstrat co-founder Tom Lee called rising oil the main headwind for Ethereum, noting a record inverse relationship between ether and crude.

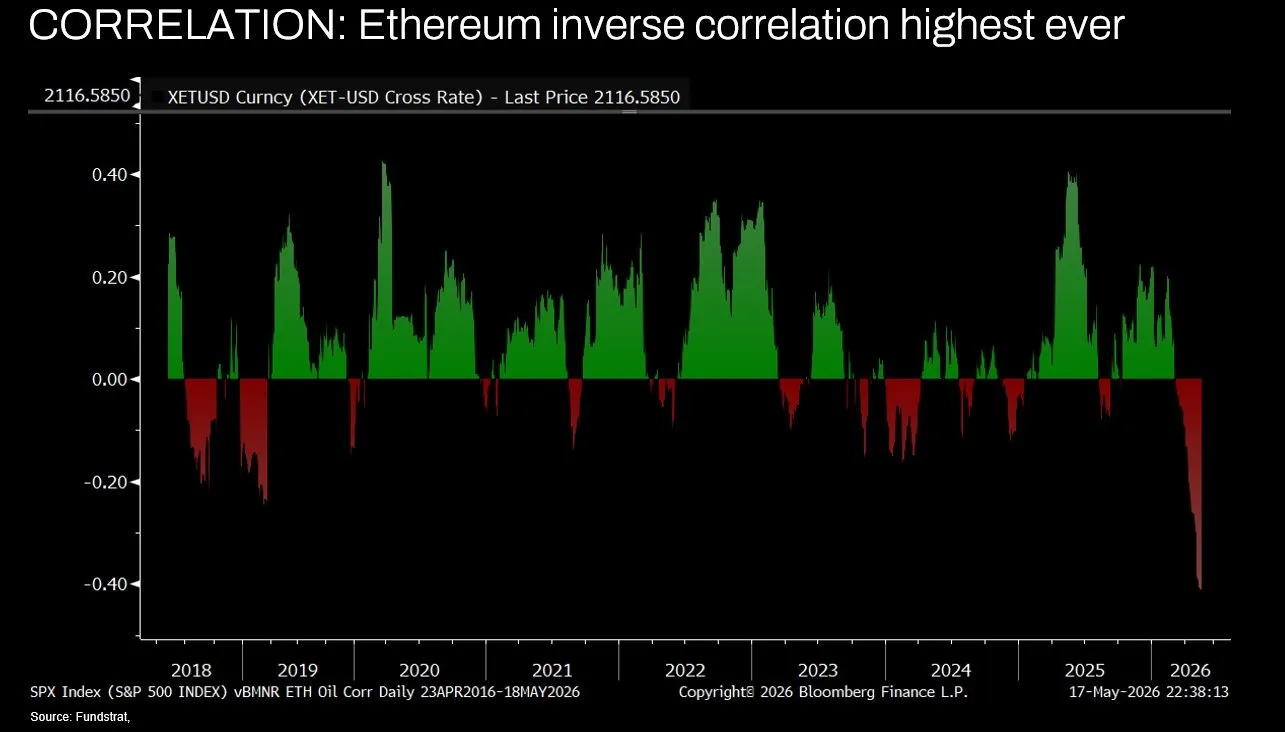
Analyst Axel Adler Jr noted that WTI near $97 is a negative macro factor: it intensifies inflation pressure and keeps central banks tighter for longer.
An added uncertainty is the change at the Fed. The chair’s post went to Kevin Warsh, a move the crypto crowd welcomed as he is seen as open to bitcoin and financial innovation. Digital gold barely reacted: markets care more about the rate path than one official’s views.
Trader Merlijn The Trader pointed out a curious pattern: each new Fed chair’s arrival coincided with a local bitcoin peak — in 2014, 2018 and 2022. The observation is anecdotal rather than statistically proven.
Conclusion: independence, with caveats
Bitcoin in 2026 is neither archaic “digital gold” nor an oil proxy. It is an asset with its own pricing logic, anchored in institutional flows, halving cycles and corporate treasury strategy.
The Middle East crisis showed the essential point: digital gold can weather energy shocks without mirroring oil.
But May 2026 adds a caveat: that independence is conditional. It rests on institutional market plumbing — and when that falters, as with ETF outflows and rising rates, macro sensitivity returns. The coin is no “mirror of commodities”, but it is not invulnerable either.
The enduring lesson: bitcoin is broken not by wars or oil prices, but by internal crises of trust and credit — as with Terra/LUNA and 3AC in 2022.
External shocks stoke volatility; capital flows set the trend. While the institutional support mechanism hums, the immunity is real. When it sputters, the stress test resumes.