

Trader assesses the likelihood of Bitcoin reaching the $20,000 mark
The market’s current situation is explained by a practicing trader and founder of the project Crypto Mentors Nikita Semov.
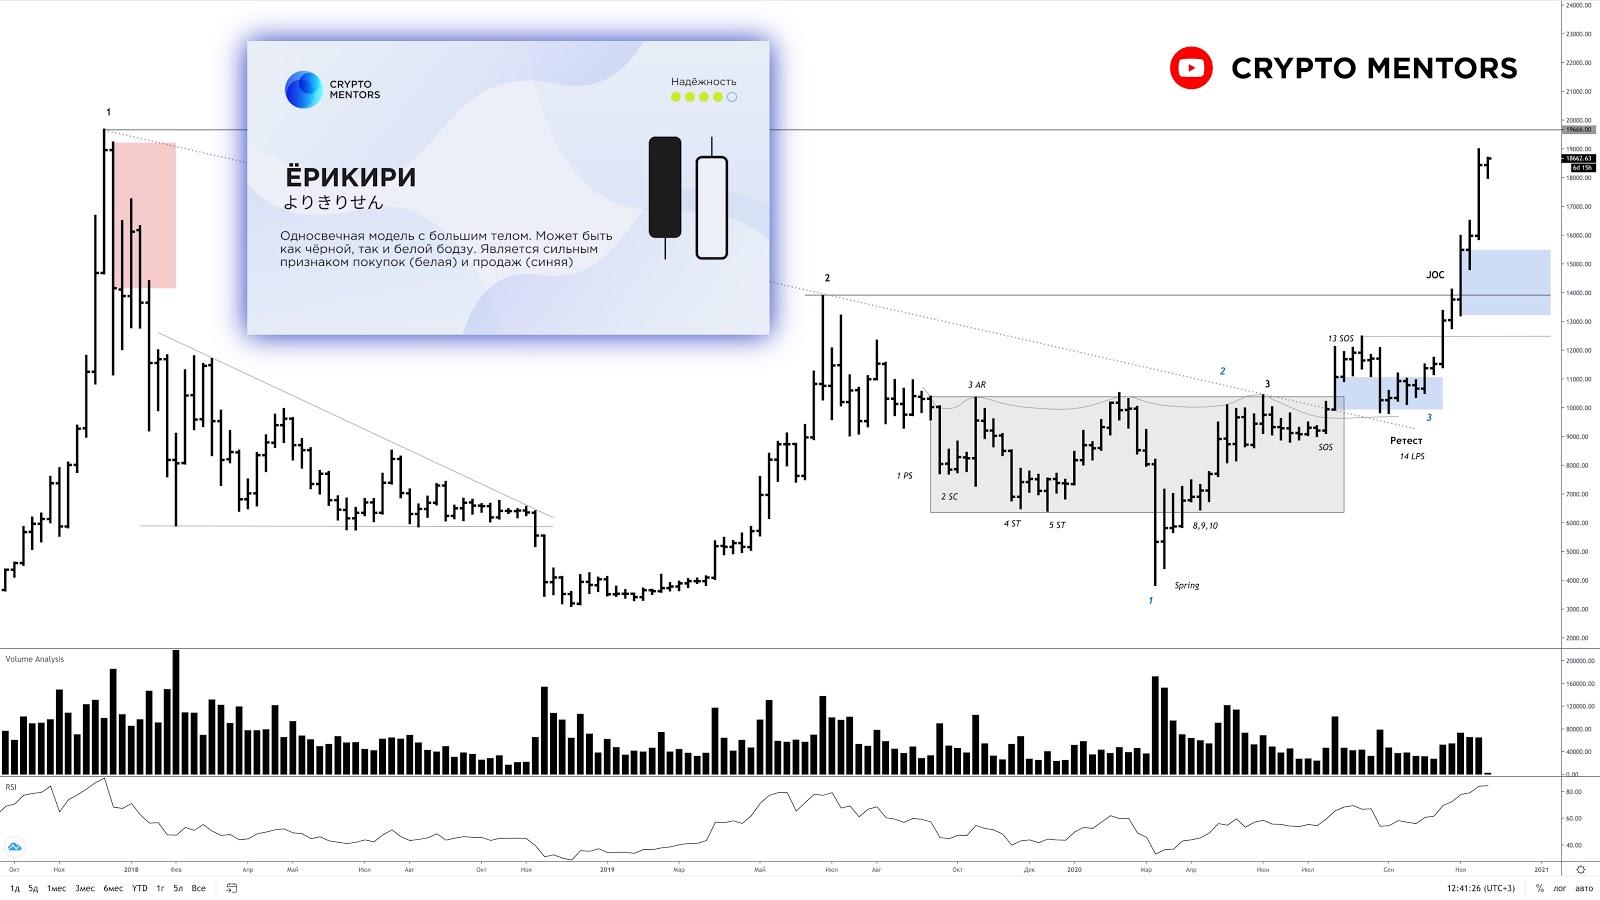
Last week there was a wide spread and low volume, signaling ease in the direction of buying. Momentum is increasing as the price approaches the key level at $20 000.
We expect this coming week to close the buying bar. But be careful: this horizontal could give way to a corrective wave. We expect that, going forward, it will not have a significant angle of attack.
Japanese candlesticks show the pattern ‘Erikiri’ — a bullish bodzu, a large white candle, a sign of considerable strength. In the context of this model, growth is also expected.
Price Action and VSA
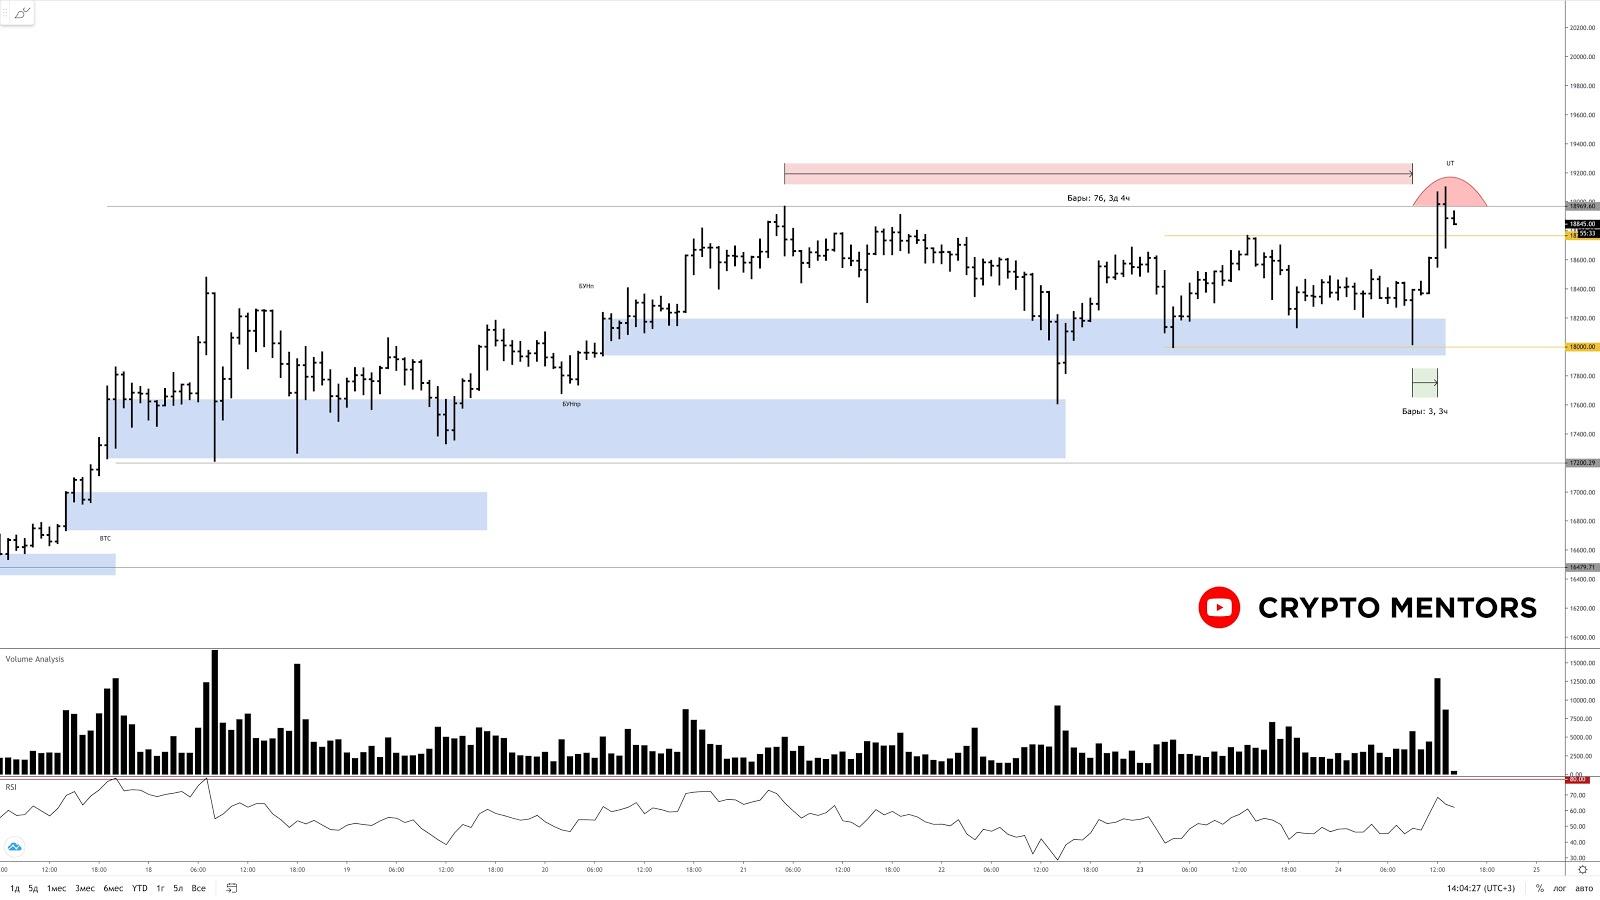
Analyzing the spot chart implies the presence of a balance in the form of reaccumulation on the hourly chart. The selling attack is weak and lacks initiative, yet a local false breakout pattern is forming on the tested level of $18 969. This constitutes a deviation, and a price drop to around $18 350 may follow, from which bulls’ reaction will need to be watched.
A potential entry point for a long could be an impulsive breakout above the horizontal with a hold. Bitcoin looks very strong; shorting such a move with a hold of more than a day would be pointless.
Analysis of horizontal volumes and deltas
At the moment the price looks extremely positive. We have already settled above all the key POC and VA balance. However, given that the breakout itself was weak and volumes spiked at the highs [1], a pullback to the value zone of this week — around $18 400–$18 690 — can be expected. After this, a resumption of the uptrend is likely.
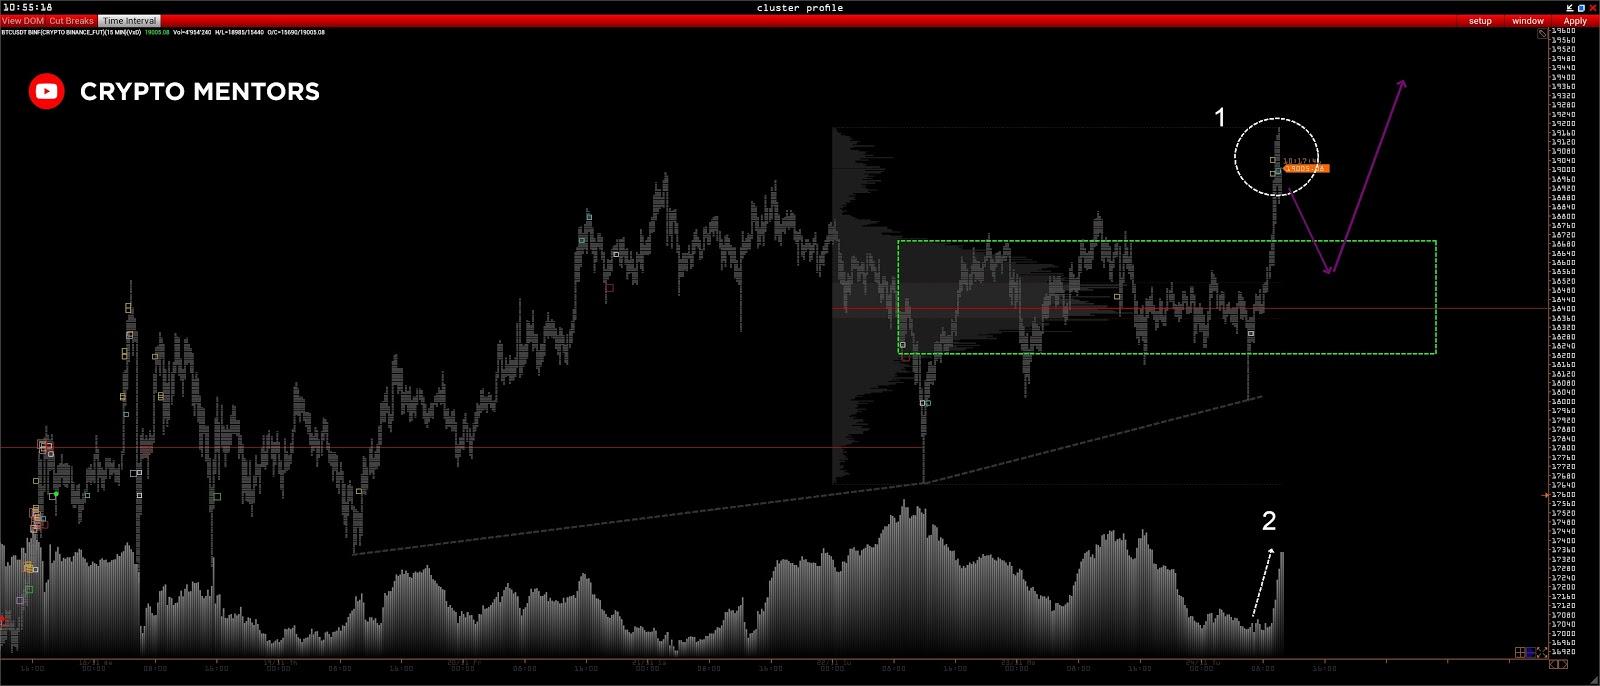
We can also see a strong rise in open interest [2], which speaks to the validity of this move. In the long run, Bitcoin looks extremely bullish.
Subscribe to ForkLog’s channel on YouTube!
Рассылки ForkLog: держите руку на пульсе биткоин-индустрии!