


Practicing trader and founder of the Crypto Mentors project Crypto Mentors Nikita Semov explains the current market situation.
\n
Global picture

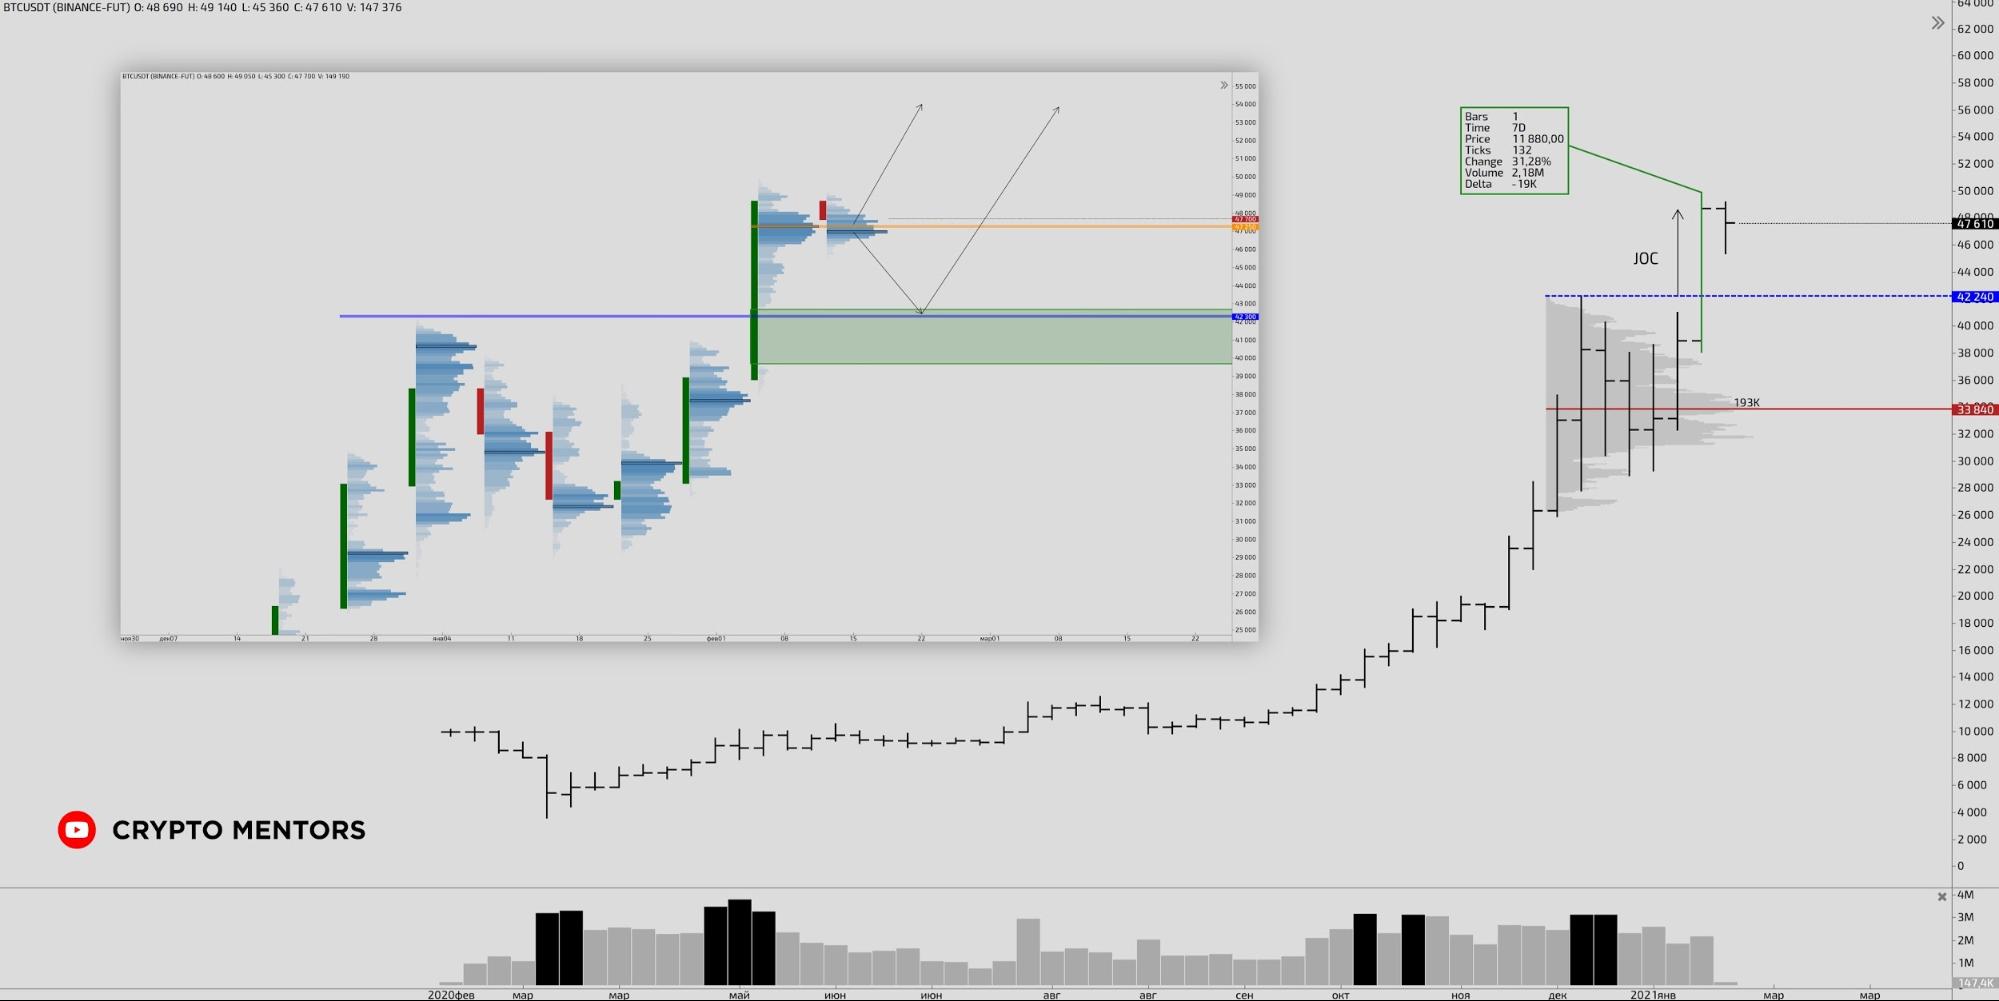

Average weekly volatility is comparable to previous price-move values (31.13%). The spread across the matrix is large, indicating buyer dominance in the mid-term.
Volume is on par, moderately rising, and again signals interest from buyers. The up-bars are advancing positively, and a breakout above the key high of $42,240 yields visible results.
Key mid-term support levels are $42,240 and $33,840. The preferred mid-term scenario will be built from long positions.
Looking at the horizontal volume, we see that the range $39,750-$42,750 is a “development-minus zone” (lack of volumes). It effectively acts as a magnet for the price and a significant support, from which, if tested, we expect a reaction upward.
POC of the week is $47,250. A close below this level would open the path to lower values, down to the indicated green range, from which growth is expected.
If the price remains above the week’s maximum volume, trading should be conducted exclusively from longs.
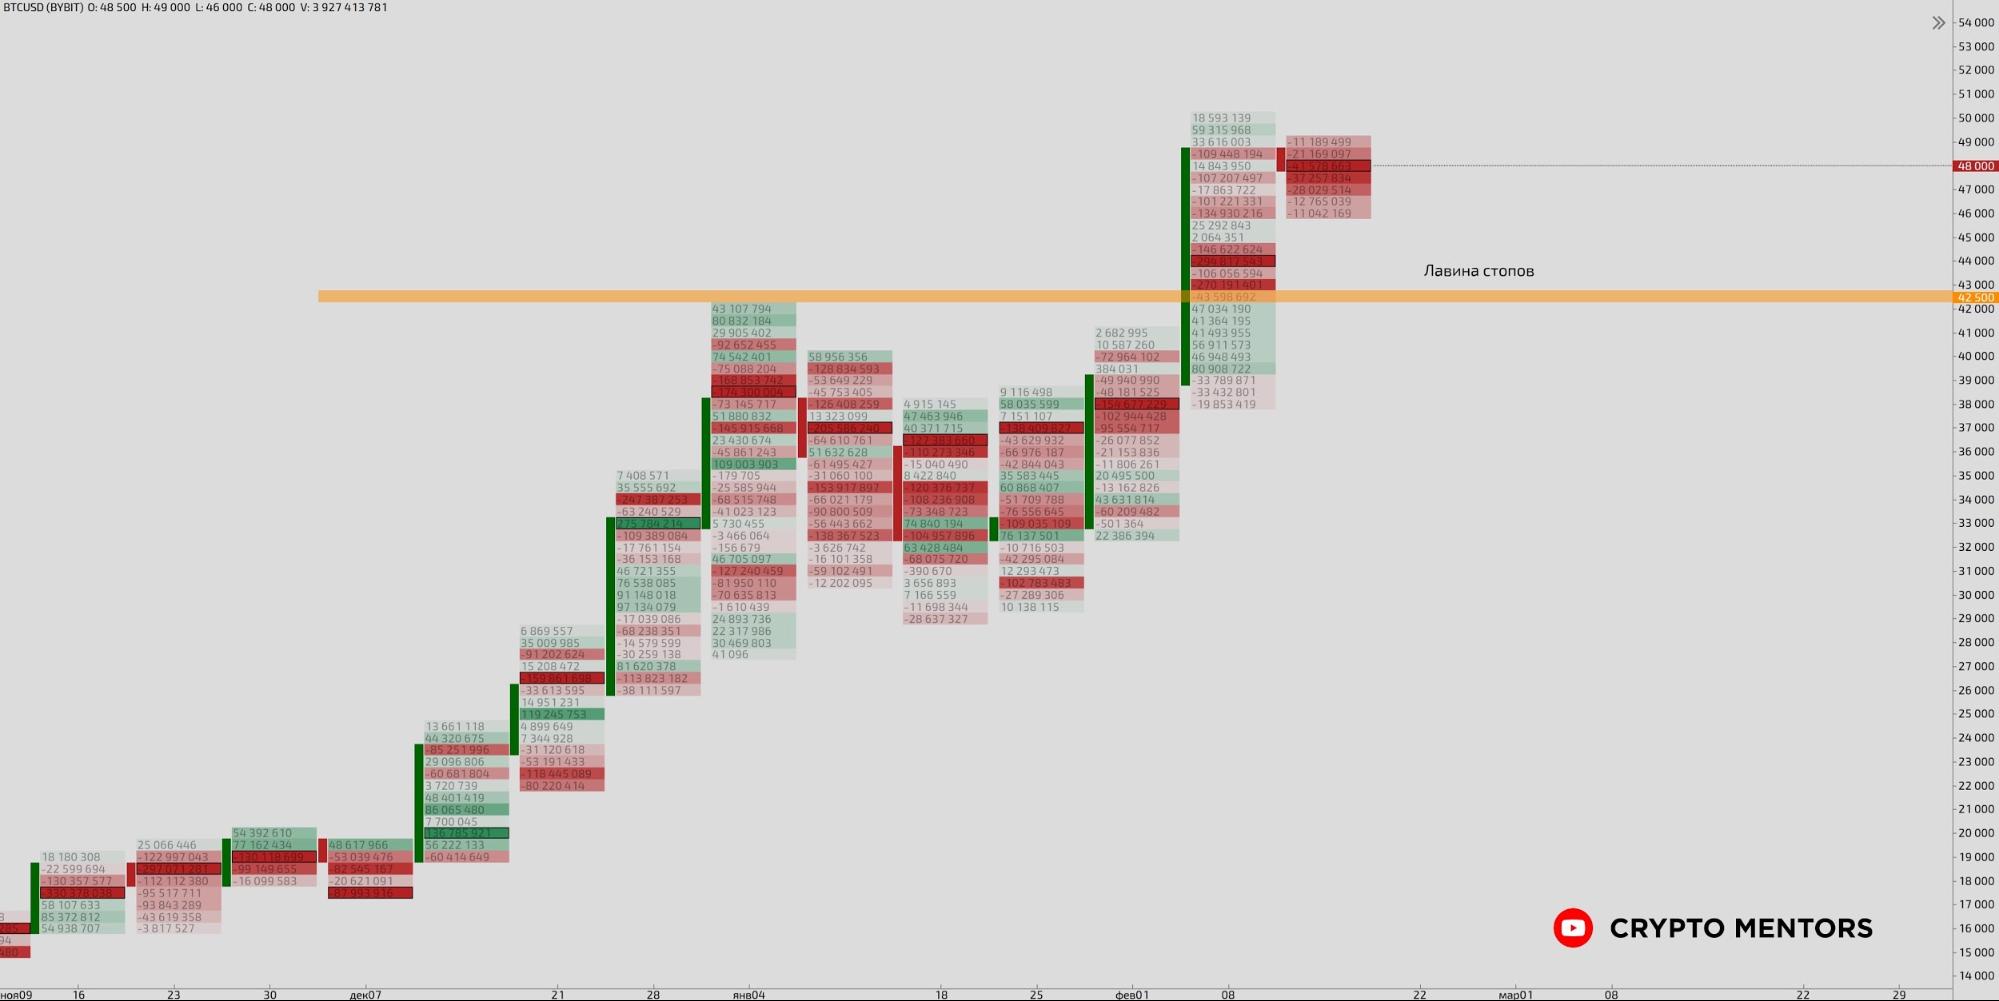
From the $43,000 mark, a “stop-loss avalanche” formed—a large number of sales triggered by Bitcoin’s new all-time highs. This can be tracked visually using direct exchange data, showing exactly where and at what volume shorts were stopped out.
In the future, such zones likewise serve as price-support regions. In other words, the “development-minus zone” is corroborated by additional data on demand.
Mid-term picture

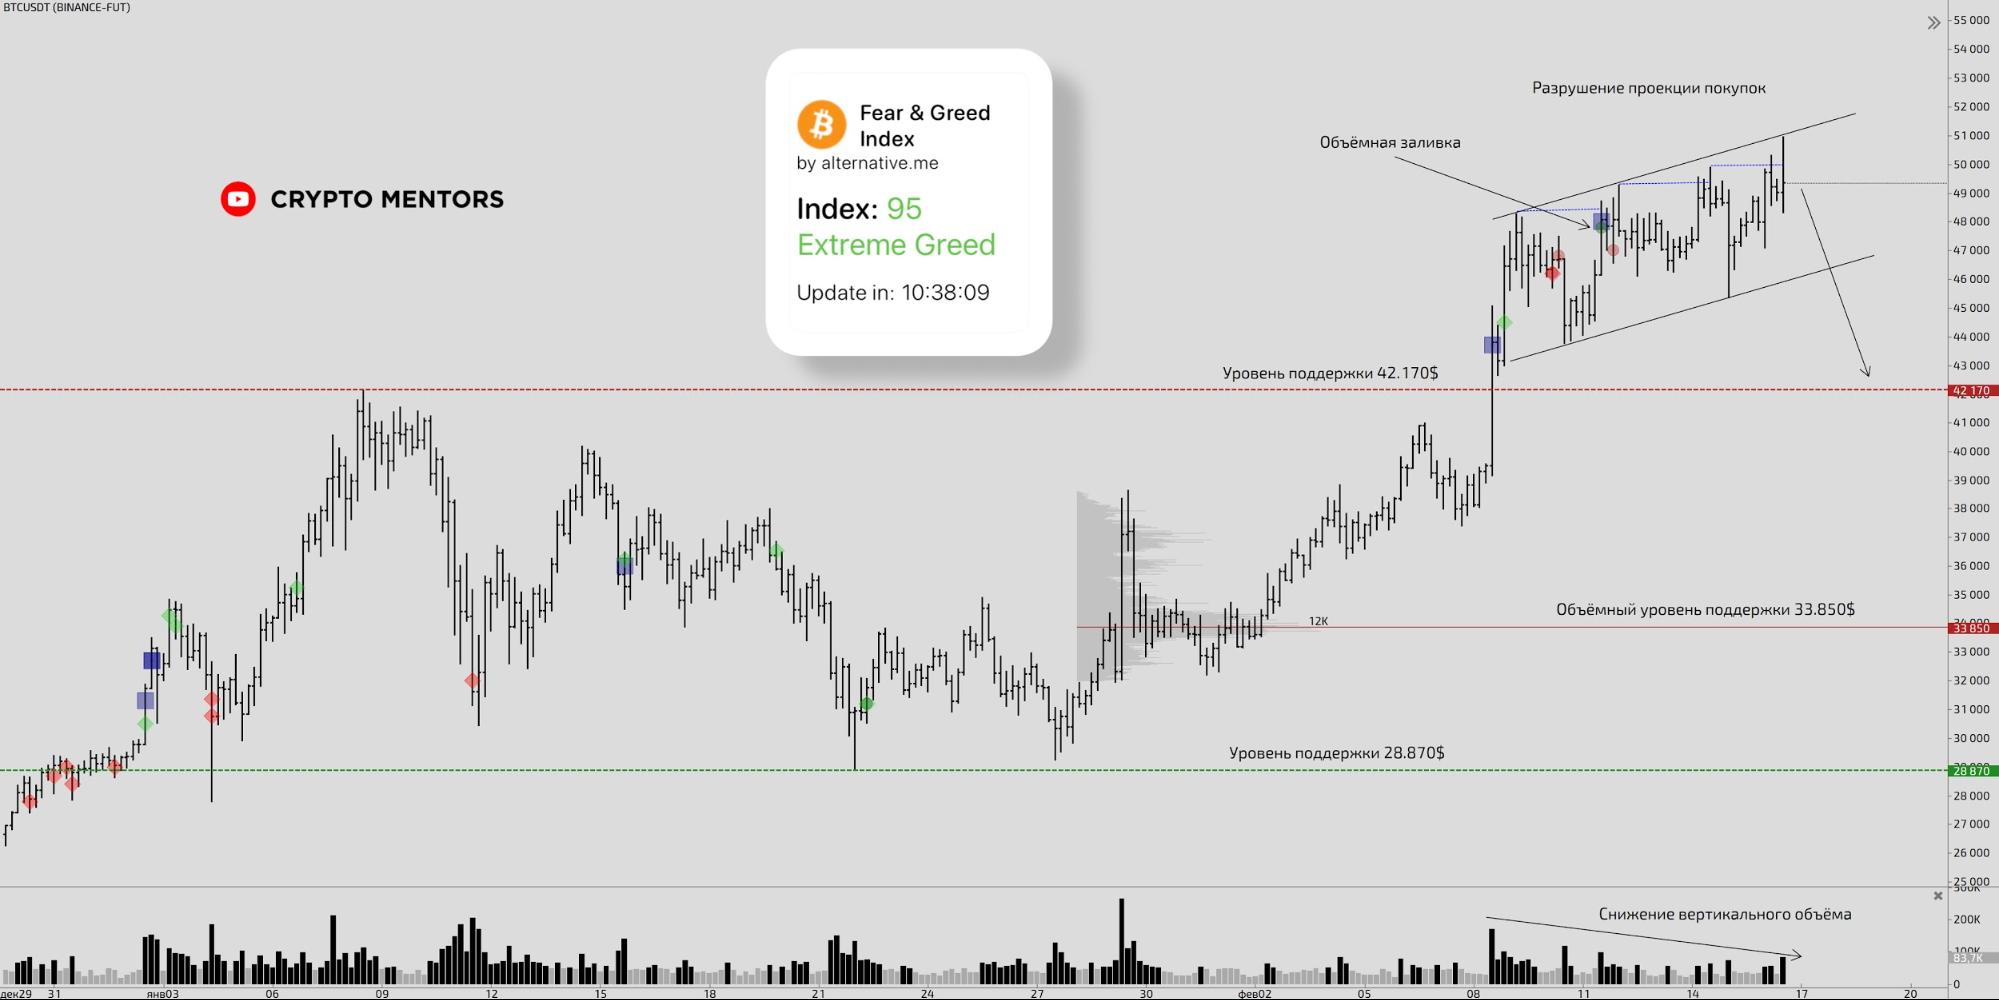

Looking at a more local picture, one can identify several unfavorable factors that are highly likely to trigger a correction.
Firstly, consider Price Action. The breakdown of the wave projection, signaling buyers’ inability to capture new levels decisively and impulsively, points to their weakness over the past week. This is also corroborated by divergences across a variety of indicators.
Secondly, a decline in liquidity in the current uptrend range, reflected in decreasing vertical volumes, indicates low market participant interest at higher Bitcoin price levels.
Subscribe to the ForkLog channel on YouTube!