


A practicing trader and founder of the Crypto Mentors project, Nikita Semov, discusses the current market situation.
Price Action and VSA
From a technical-analysis perspective, we see accumulation with a breakout to the upside. This means that a significant volume traded in a sideways move from January 2 to January 6 has been distributed upward, and the big participant is interested in buying.
Yesterday, a BUN formation appeared according to per-bar analysis theory, indicating the lack of a significant selling initiative on the hourly chart. Such patterns are often precursors to a sideways movement before a further impulse in the direction of the trend.
From this, we conclude that a minor correction is possible, but likely not with a strong attacking angle. The main expectation is for the price to rise with purchases pushing to new highs. We could see $50,000 as early as January.

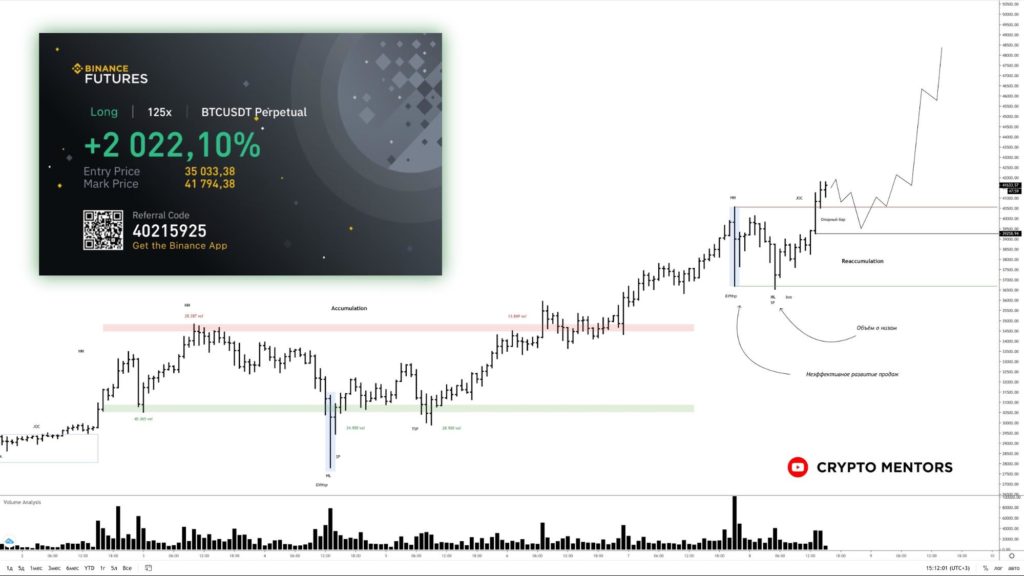

We have an open position. We will take profits on part (1/4 or 1/5 of the position) at current price levels and will closely monitor BOS $36,490, as it is a key point in the current market structure.
Analysis of Horizontal Volumes and Delta
As we can see, Bitcoin is forming a robust stepwise structure of “accumulation — breakout,” which creates multiple supports in case of a pullback [1]. The most important zone is $38,500-$39,000, where a resumption of the long move should be expected.

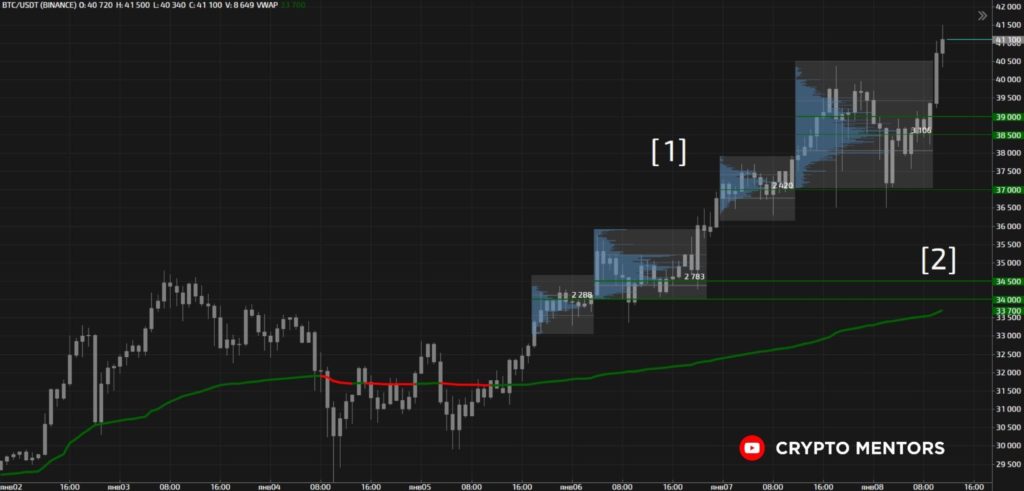

If the $36 500 break is breached, we can expect deeper moves toward the $34 000 area, but in that scenario the upward Price Action structure would be broken, which is a negative factor and would clearly halt such exponential growth for weeks [2]. A break of this zone would confirm a market reversal.
From the delta perspective, we see a number of factors pointing to a local correction over 1-2 days. The cumulative delta on the last wave has ended its rise, indicating a decrease in buying intensity [1].
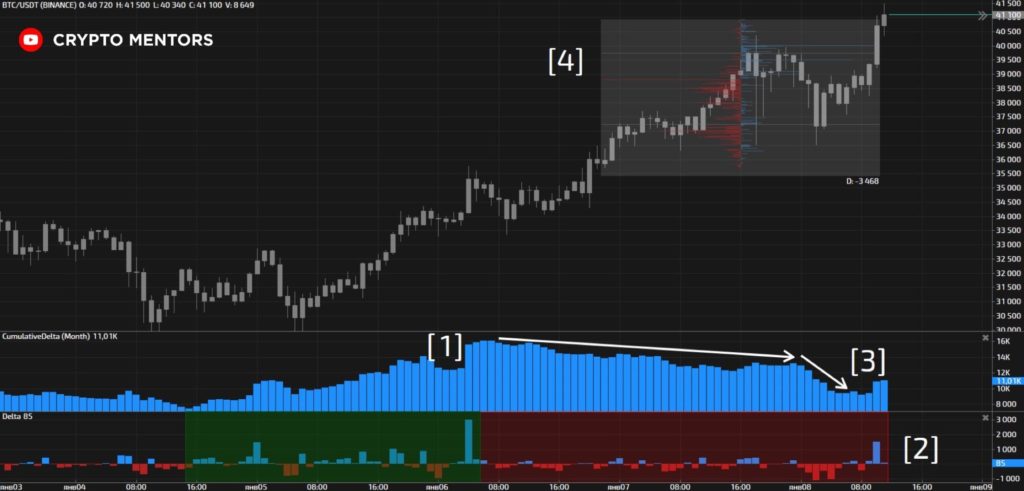
This is also supported by the regular bar delta — a complete loss of control by bulls, which signals weakness in the current buying wave and a high likelihood of a correction [2].
A sharp drop in the cumulative delta you may have noticed should not scare you, as it reflects liquidations and stops of late long positions [3].
A horizontal cut indicates greater selling activity, which in turn also signals a loss of initiative by buyers [4].
The global structure remains long, but there are some factors pointing to weakness in the current move and the need for a correction.
Subscribe to ForkLog news on Telegram: ForkLog Feed — the full news feed, ForkLog — the most important news and polls.