


The market outlook is provided by Nikita Semov, a practicing trader and founder of the Crypto Mentors project.
Bar-by-bar analysis of the weekly time frame
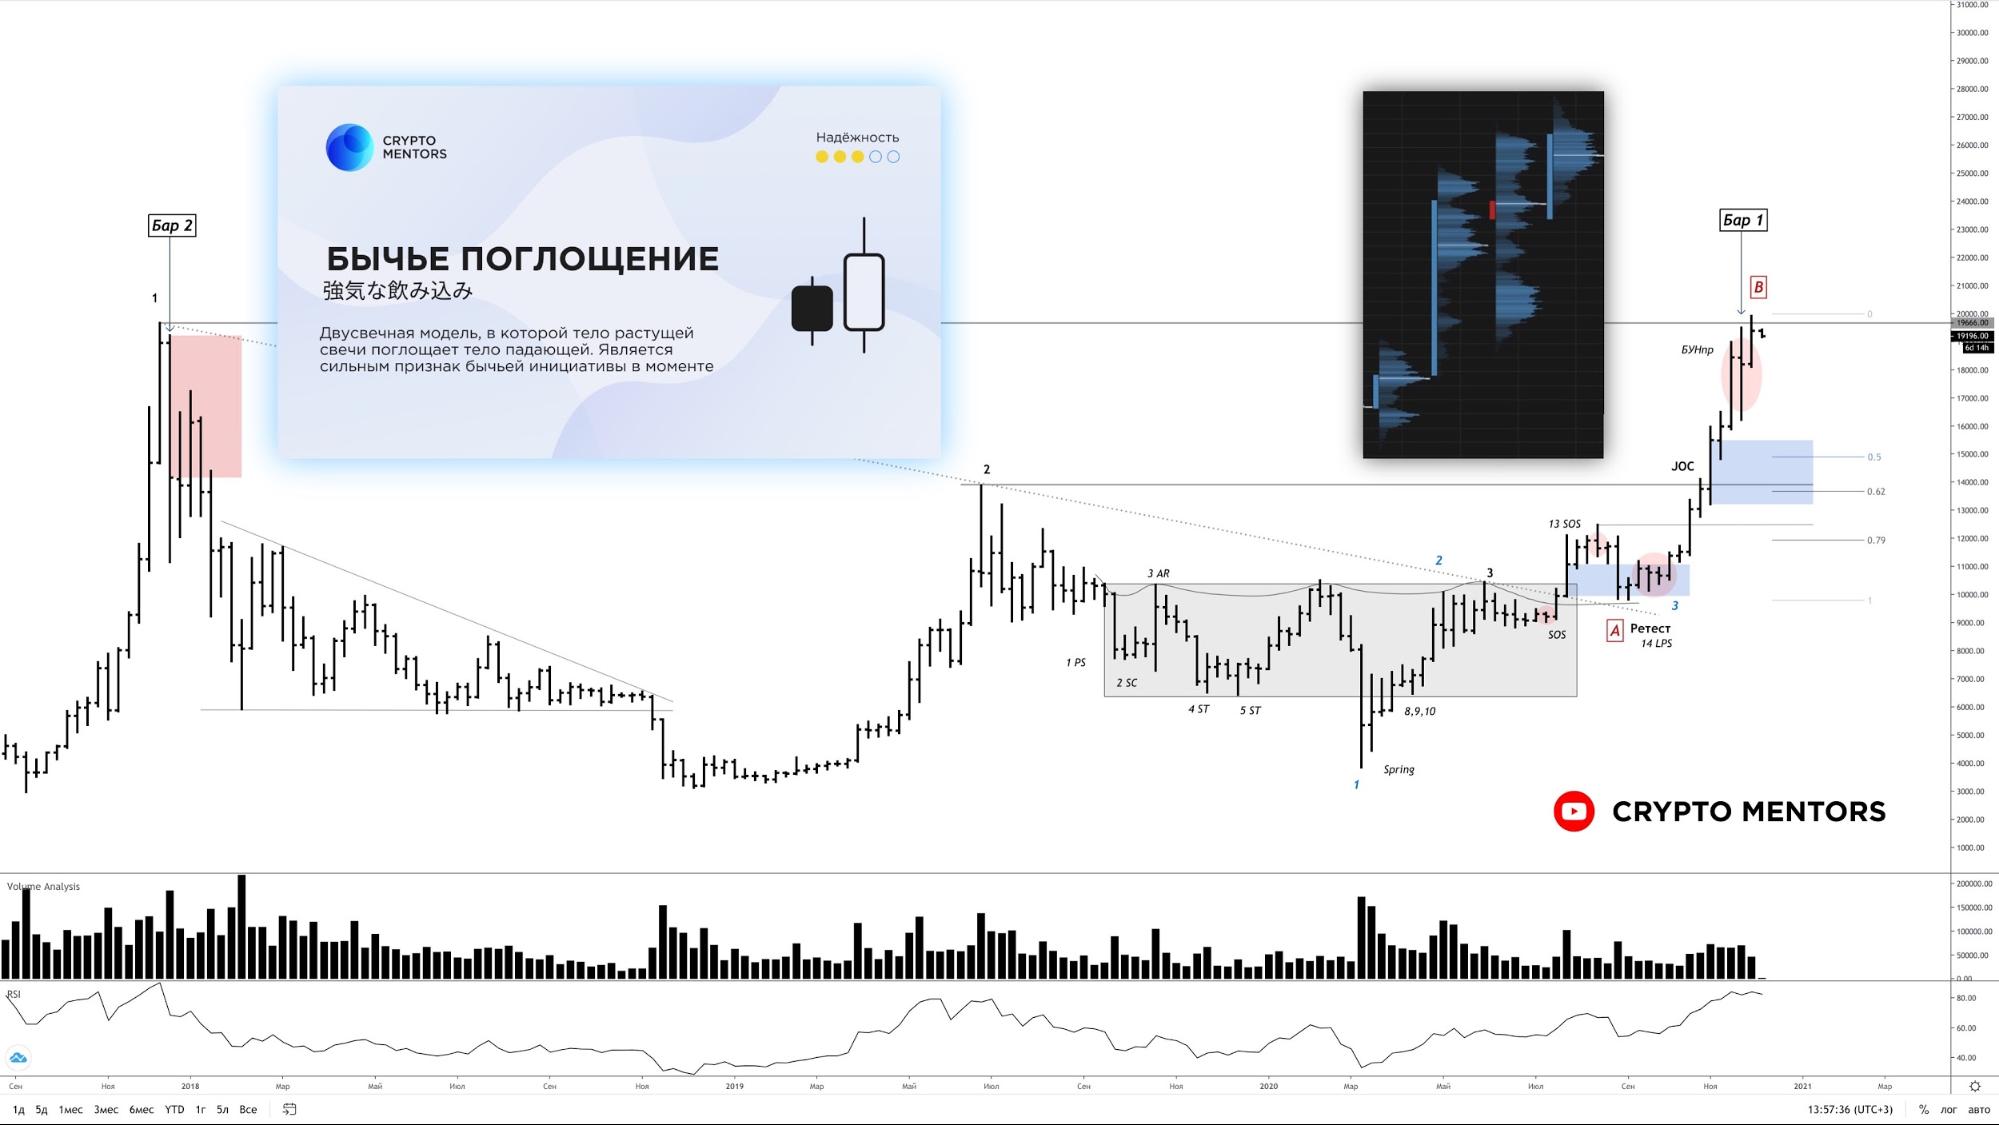
Bar-by-bar analysis. The bar of the previous week, as we expected, formed a bullish setup. The spread bar is of medium size by the matrix under the VSA methodology, similarly the average within wave AB. Volume is small by the matrix, which together with the level indicates a lack of supply.
Progress in reaction from the horizontal level fell repeatedly (comparing the renewals of selling in bars 1 and 2). There is no result — the tail was breached. The profile has a Gaussian “normal distribution”.
Japanese candlesticks. According to Japanese candles, the bullish engulfing pattern signals buying pressure.
The expectation for the current week is that the bar will close with weak selling pressure.


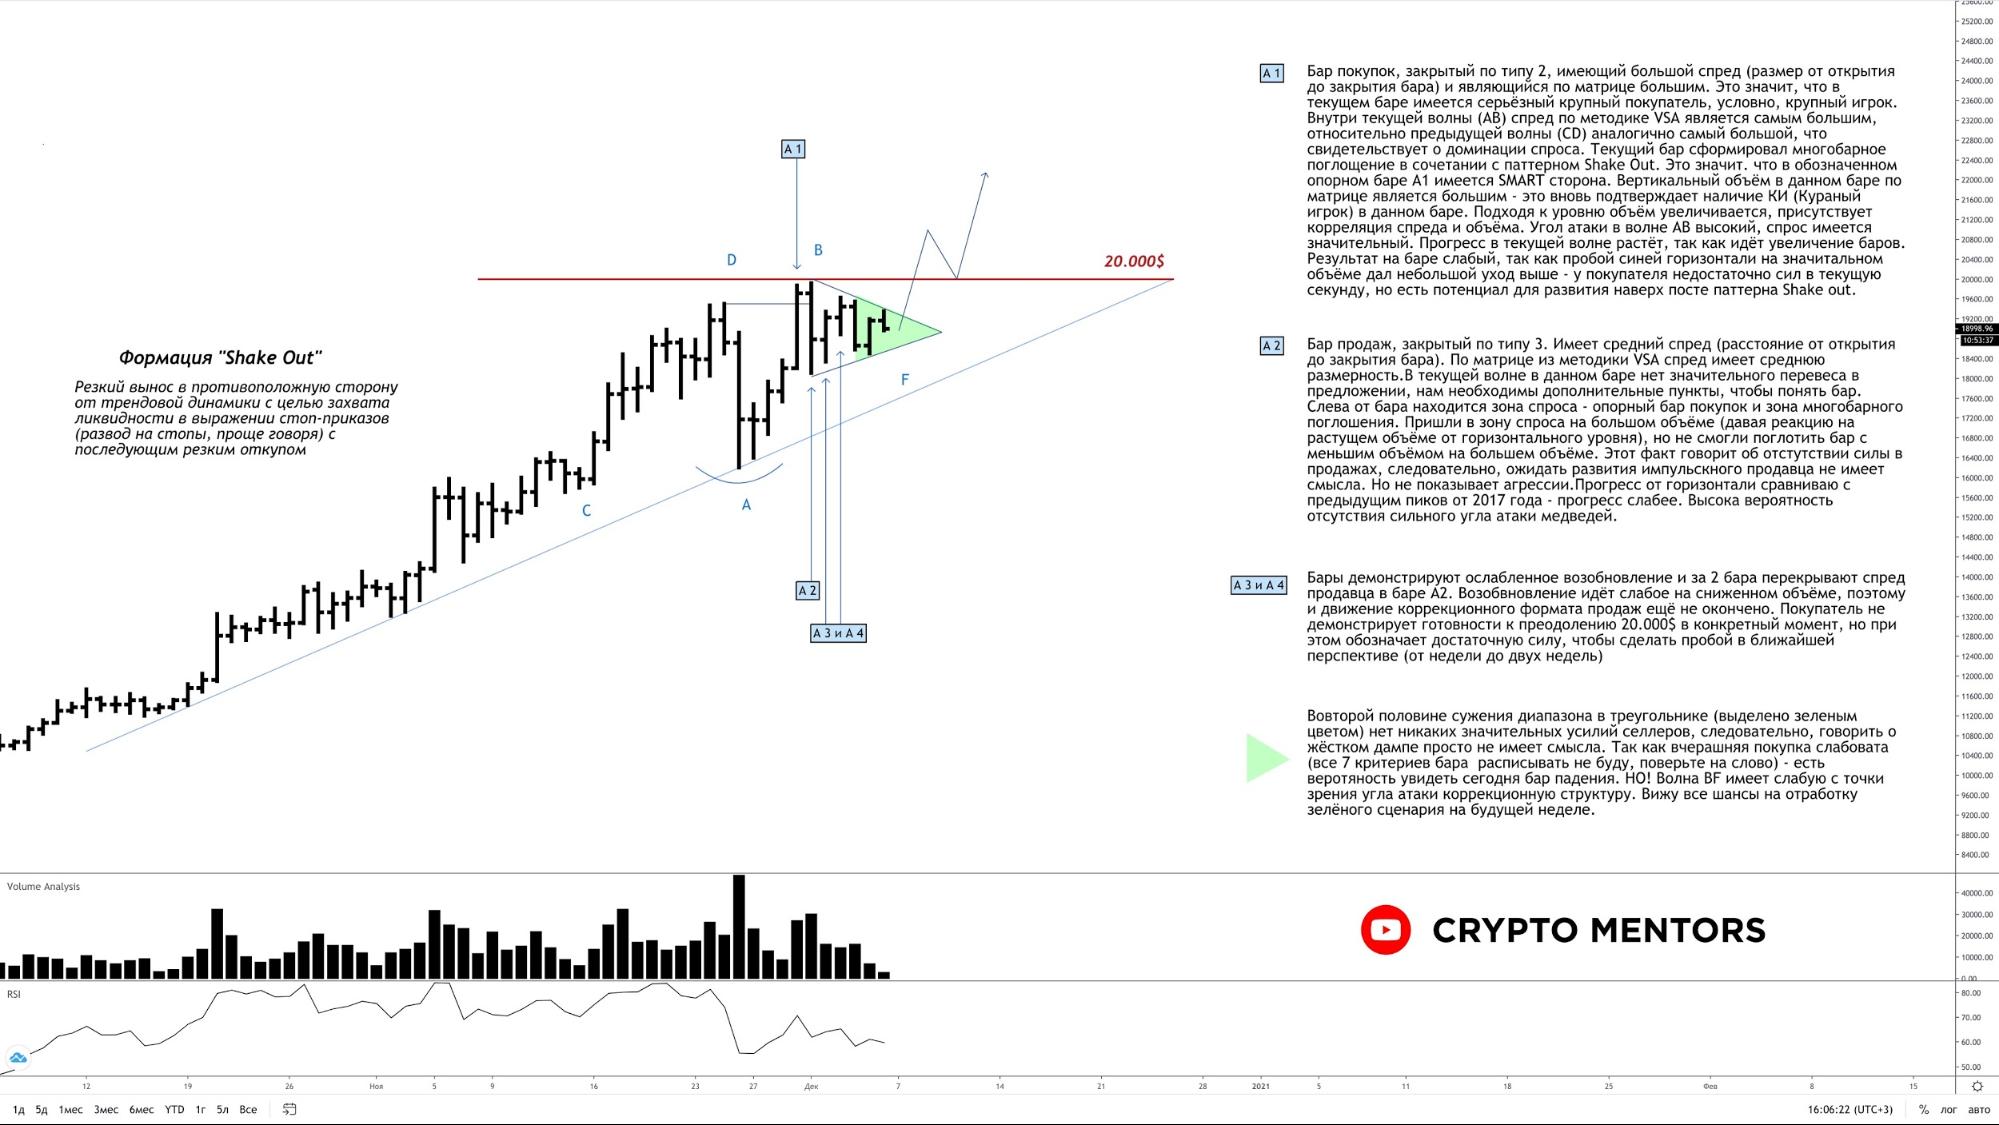
Bar-by-bar analysis of the daily time frame
Bar-by-bar analysis is one of the branches of the Volume Spread Analysis methodology; it helps determine the direction of future movement by evaluating a series of individual bars. It is one of the most accurate methods, since the trader’s focus is solely on price and volume.
The past week showed that there are no strong selling pressures and, apparently, none is anticipated. I recommend reading the information from the screenshot, where the reasons for the absence of significant supply at the 20,000$ level are described in detail. In short: compression + shake-out + weak attack angle and weak progress from the 20,000$ level.
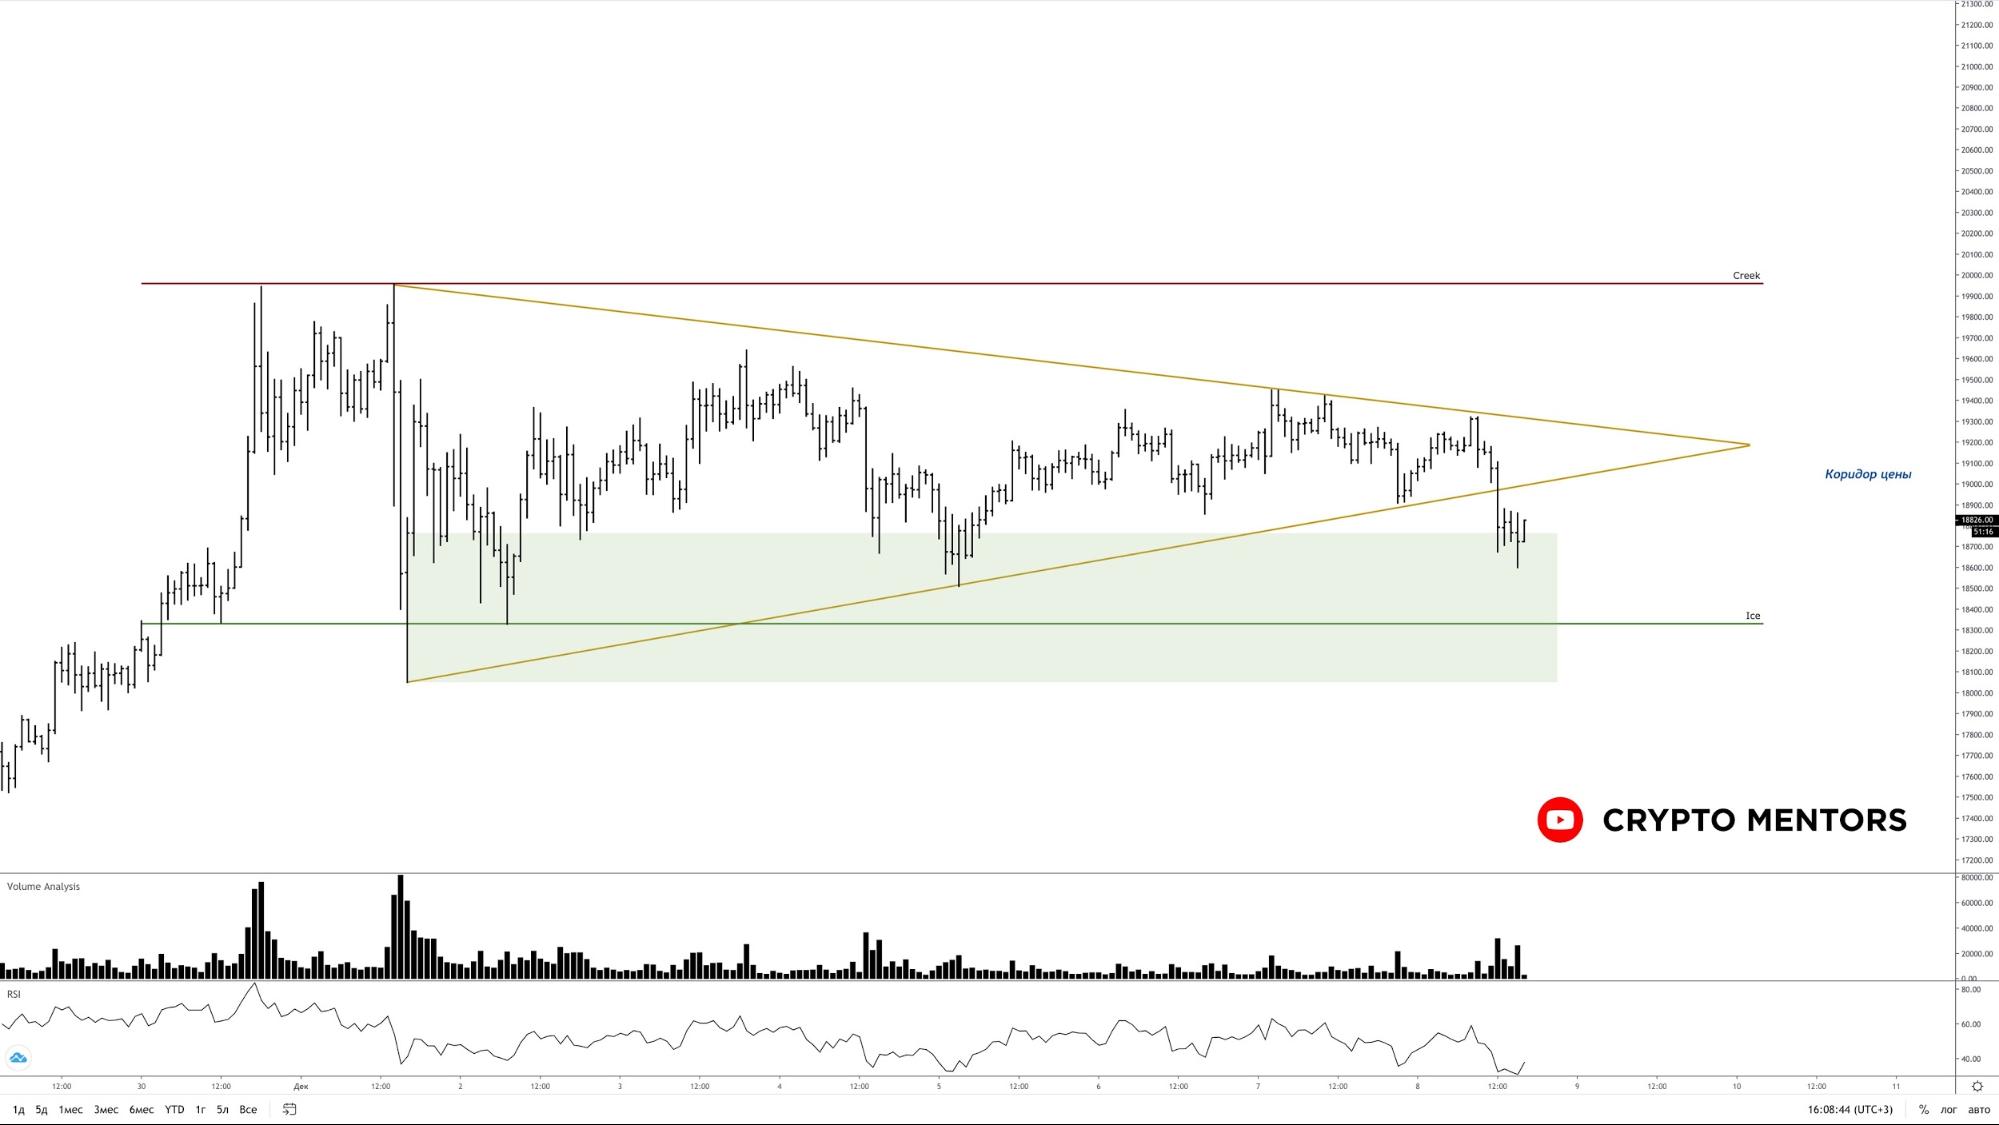
Price Action and VSA
Price is in an obvious squeeze between the Creek and Ice levels, and the current sideways structure more closely resembles accumulation. At the moment, buyers have entered the single-bar bullish engulfing zone, and from here a renewed buying interest and price rise toward the upper boundary is likely (the appearance of a bullish pattern only confirms this idea).
The breakout from the triangle is likely false and intended to trigger long-stop orders.
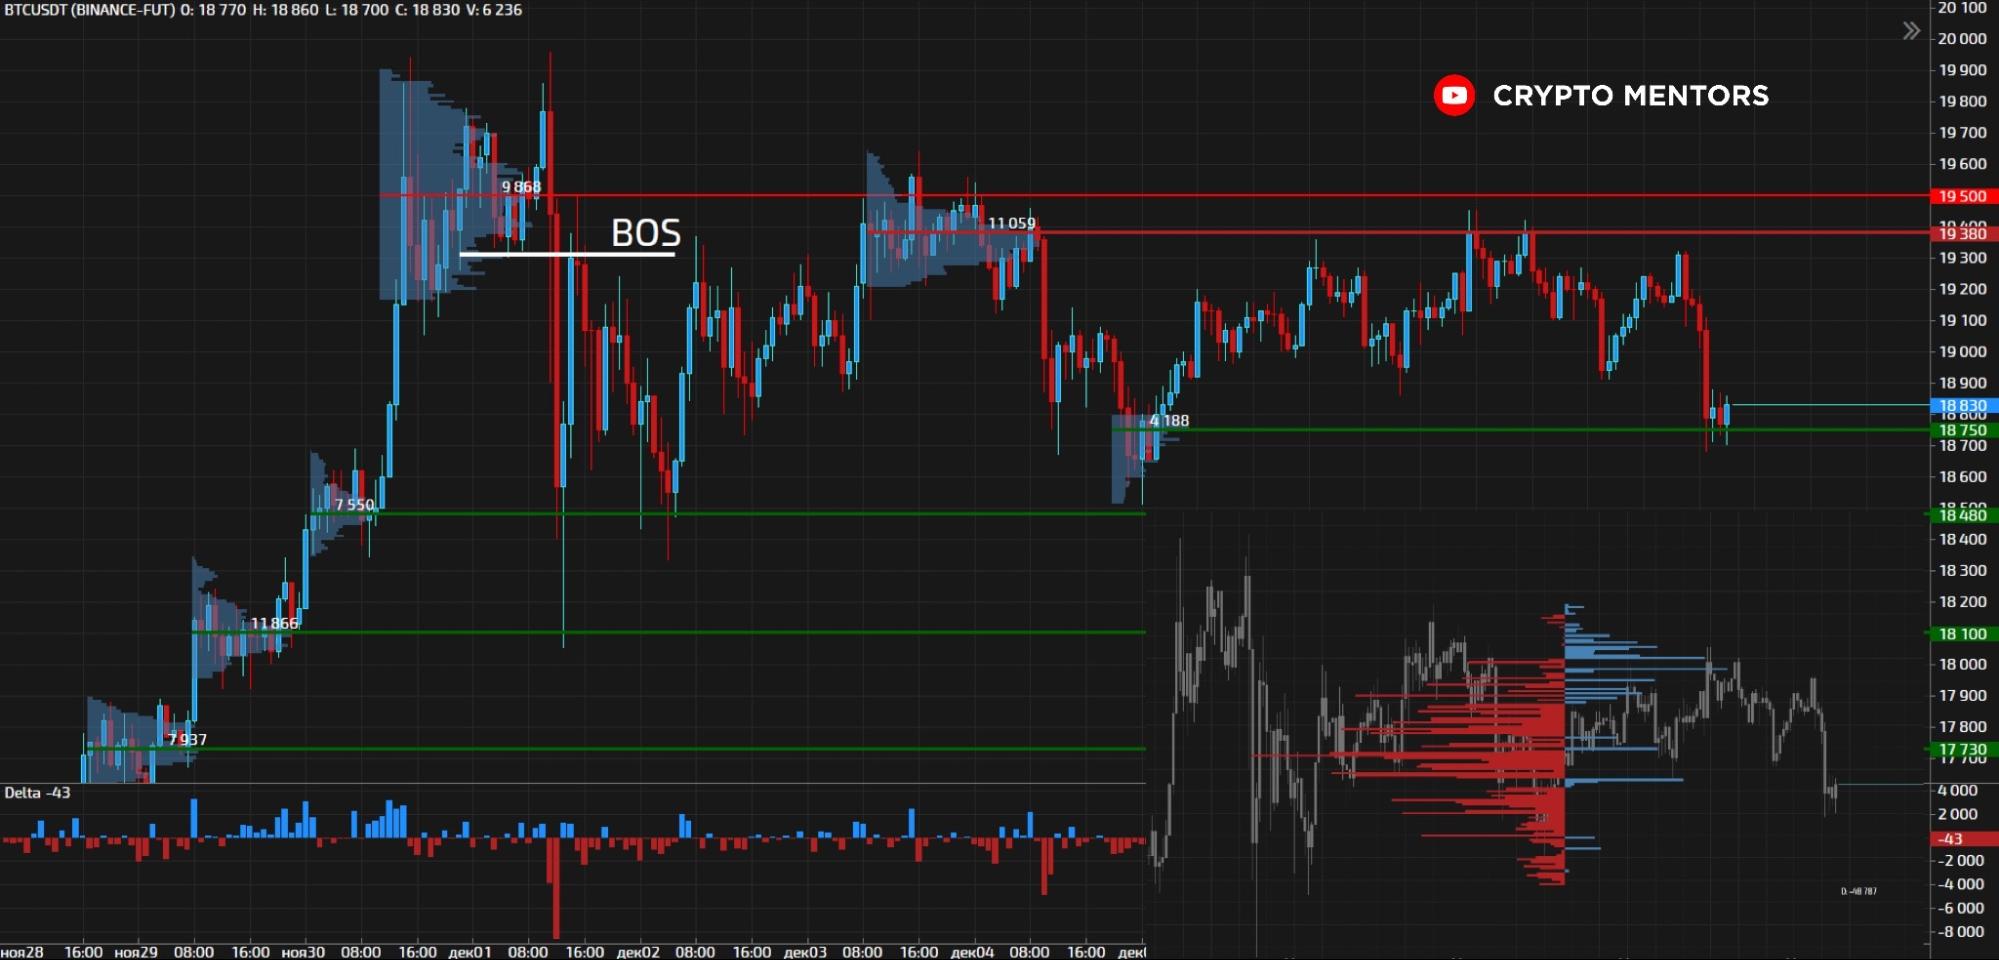
Analysis of horizontal volume and deltas
Price is squeezed into balance, with the range narrowing. Against this backdrop, market selling gains momentum. This is visible both in the cumulative delta and in the horizontal distribution. Moreover, pay attention to PA, where selling waves are significantly stronger than buying.
Important levels above and below have been tested, so a breakout could occur in either direction. However, given the delta information, we expect a move lower to test $17,730—the last bastion of the up move. Its breach would signal the end of the uptrend at least until the end of the year.


Subscribe to ForkLog news on Twitter!