


The market picture is provided by Vadim Shovkun, a practising trader and founder of the project Crypto Shaman.
More than six weeks have elapsed since the onset of an almost uncorrected correction that swallowed the last wave of gains. Is this the start of a bear market? Is there still room for buyers? We examine the issue.
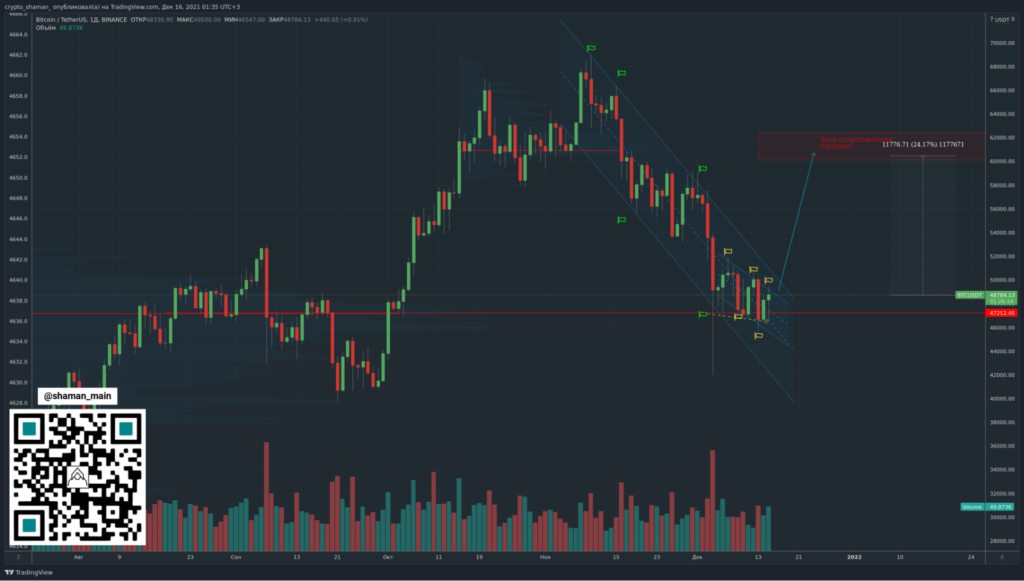
On the daily time frame, the price is moving in a descending channel. After a sharp dump, quotes have become confined to another downward channel, though a narrower one.
Also important is that after the dump the price sits above the PoC of the previous up-move. With the formation of a small down-channel, a small bullish RSI divergence has emerged. The close of the last daily candle with a long lower wick also points to buyer strength.


Turning to the local picture on the lower time frame, on April 12 a key selling bar formed, around which the price has traded for two weeks. The last bounce off the lower boundary occurred impulsively, on high volume.
Overall, the price action in the range suggests a weakening of the sellers’ ascent and an increasing assault by buyers. Consequently, the bulls are gaining strength.
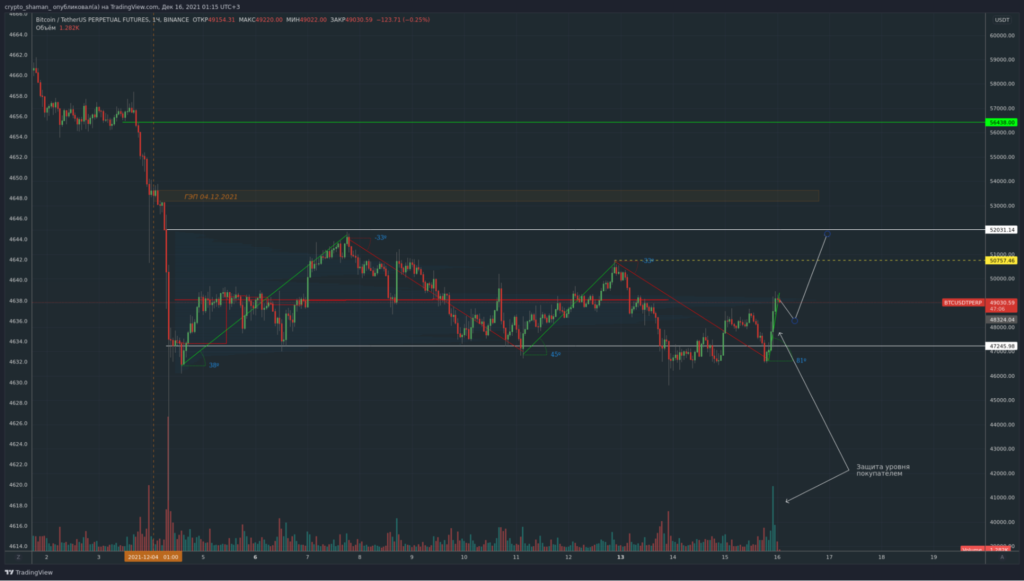
After the current impulse, a small pullback is likely, followed by a move toward the upper boundary of the range.
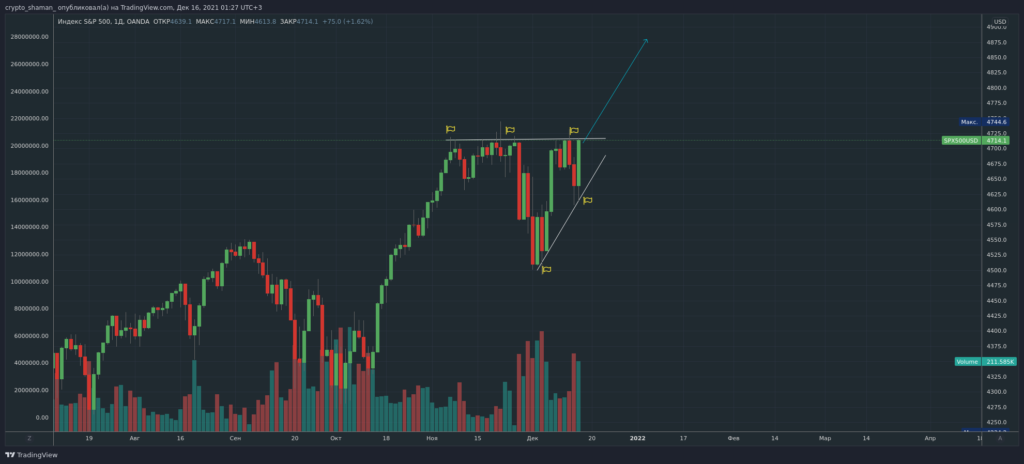
Let’s look at the S&P 500. On the daily timeframe, a very strong compression is developing with a prospect of moving toward $4,875. Given that the correlation between Bitcoin and the index has revived in the past weeks, this could be a factor in the ascent of digital gold.
Bitcoin needs to break above the yellow-labeled level of $50,757 in the near term, breaking the first of the bearish structures.


Bitcoin is likely at its extreme. A bounce at least to $59,000 should occur within a few weeks. The trajectory of the S&P 500 should not impede this move.
Subscribe to ForkLog’s channel on YouTube!