


The trader Ilya Meshcheryakov explains the current market situation.
The year began for the cryptocurrency market in perhaps the best possible way — Bitcoin managed to reach all-time highs (ATH) near $42,000, while the altcoin market allowed many investors to double their money over the past weekend.
However, the past two days for BTC do not start with coffee — at one point it had fallen about $10,000 from its ATH, and buyers have noticeably cooled on the coin and are no longer buying the dips as actively.
Let us examine mid-term prospects and assess zones favourable for building positions. We will base our view primarily on the technical picture: we observe a head-and-shoulders reversal pattern, as well as a sharp decline after a marked overbought phase — similar to what happened at the very start of January (the chart below in red).
When comparing these two corrective phases, we will see that the suitable time for aggressive buying has almost arrived — the zone $28,500–$32,500, marked by a broad green rectangle.


Trend lines of movement to $20 000 and beyond, corrective formations (in red), the head-and-shoulders pattern and zones for potential purchases (in light green). Four-hour BTC/USDT chart on the Binance exchange from TradingView.
The trend line provides a sense of a technically fair price level for BTC at the moment and also backs the view that the correction is nearing its end near the current prices — the chart will cross it near $31 000, but often move further to collect buy stops below $30 000. Let me reiterate that these prices are suitable for aggressive buying, or for re-entries after taking profits near the ATH.
More conservative ideas are centered around the $24,000–$26,000 level, where a gentler trend line underpinned movement to $20,000 runs. Moreover, BTC has more than doubled its all-time high, but has not shown a multi-stage correction — such moves typically end in a 10–20% downward squeeze.
Thus, in this case, many may be forced to sell their coins at lower prices, allowing large capital to reload its positions. Moreover, the pattern near the ATH suggests that it was divested from that position — we see high volumes and candles with long shadows, typical of a distribution phase.


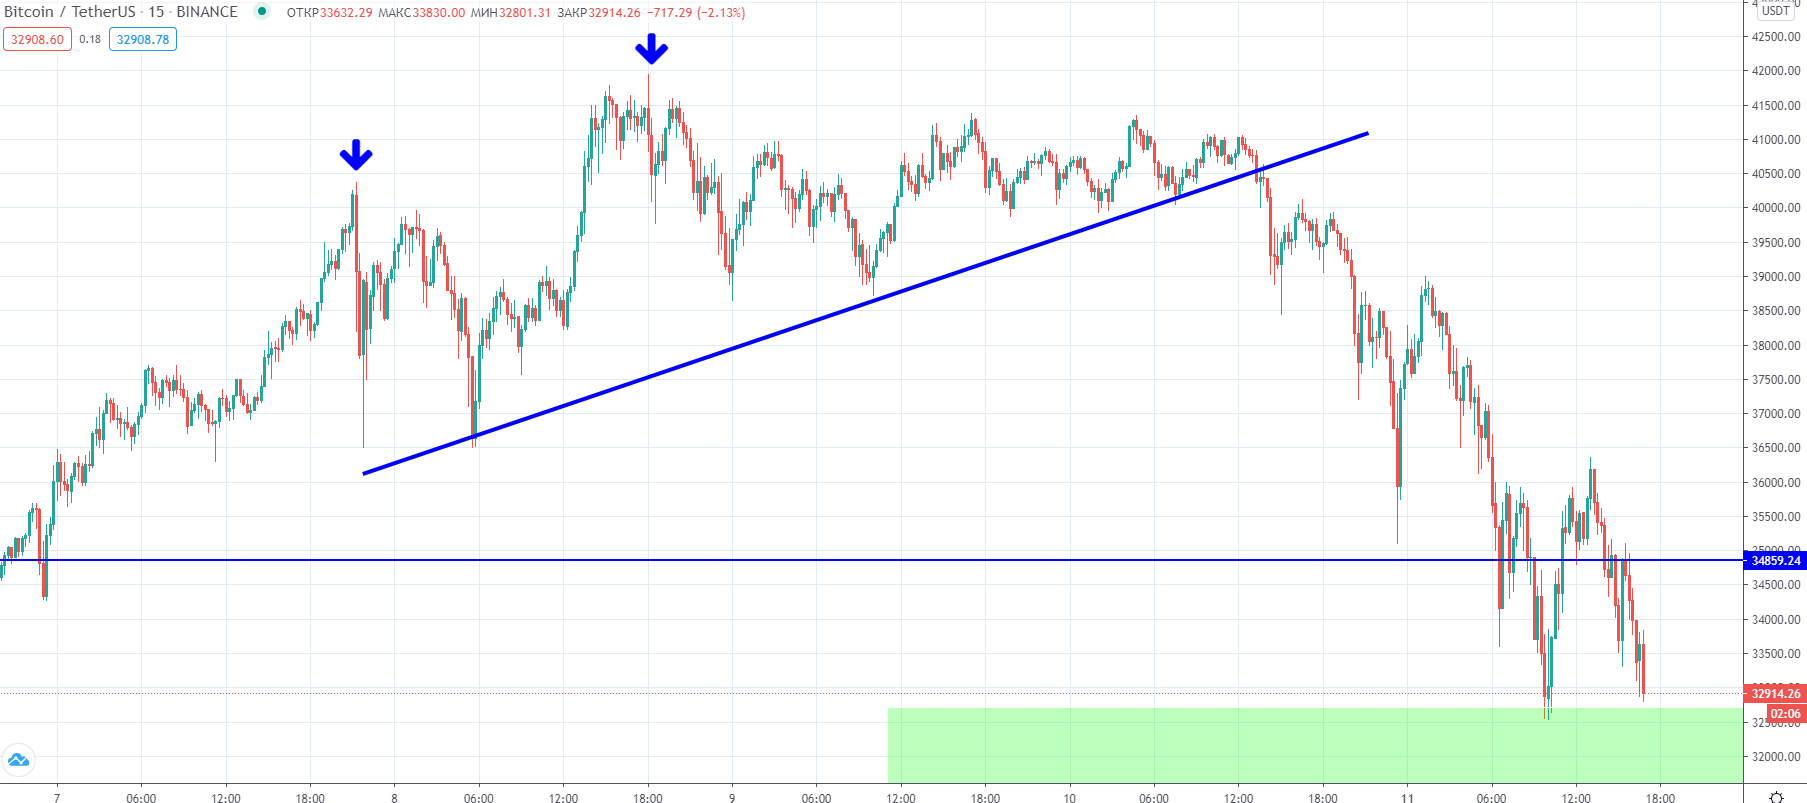
Zone around the current ATH with active selling indicated (blue arrows). Fifteen-minute BTC/USDT chart on the Binance exchange from TradingView.
Thus, the current market downturn could extend, and while aggressive buying may be possible soon, more conservative investors would be better off waiting for around $24,000–$26,000, or focusing on altcoins.
Subscribe to the Forklog channel on YouTube!