


The trader Илья Мещеряков explains the current market situation.
Last week proved positive for the entire cryptocurrency market. Bitcoin broke through the $11,000 mark, but even more notable was the rally of the altcoins — Ethereum rose by more than 40%, and this is not even a record among all coins.
In the previous briefing I noted signs of possible growth, though I remained cautious. At present, bolder bullish scenarios can be considered.
BTC, finally, broke out of a long accumulation phase. It took nearly three months for the market to push through the sideways range of $8,600-$10,000. And the fact that the breakout occurred to the upside may indicate a fairly strong subsequent price rise.


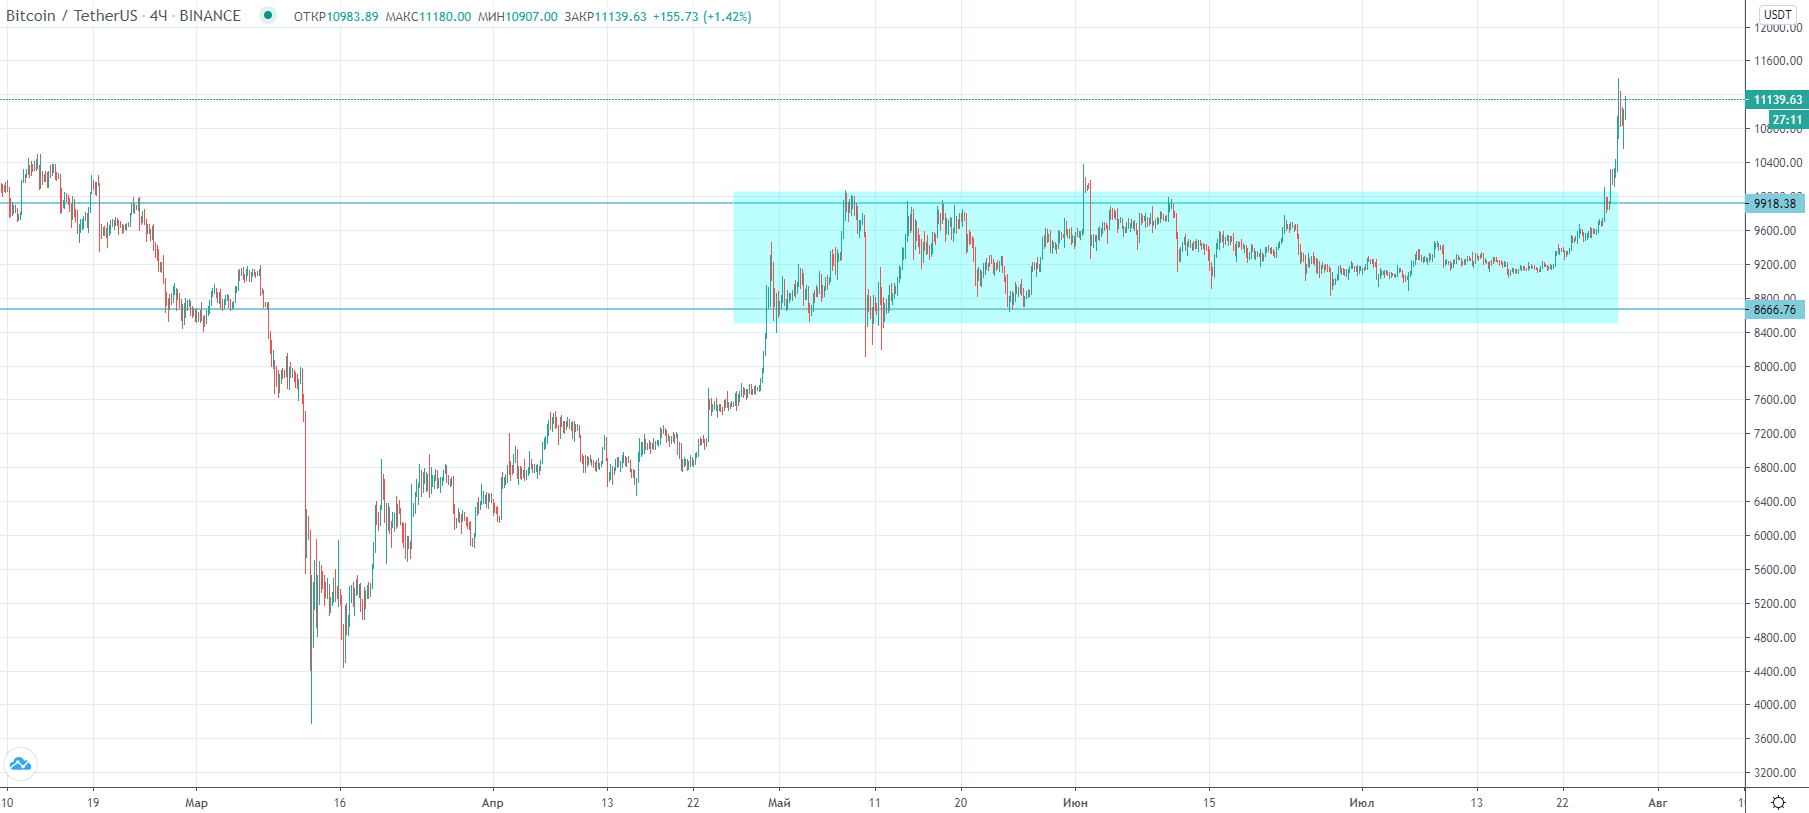
Global accumulation zone (blue) with marked horizontal boundaries. The four-hour BTC/USDT chart from TradingView.
One can draw an analogy with a similar accumulation zone in duration and width. From this, the potential price move could be around $3,000. A similar accumulation zone: from 9 June to 12 November 2018 (marked on the chart below). These zones have much in common — besides width and duration, also formation in the middle of the trend.


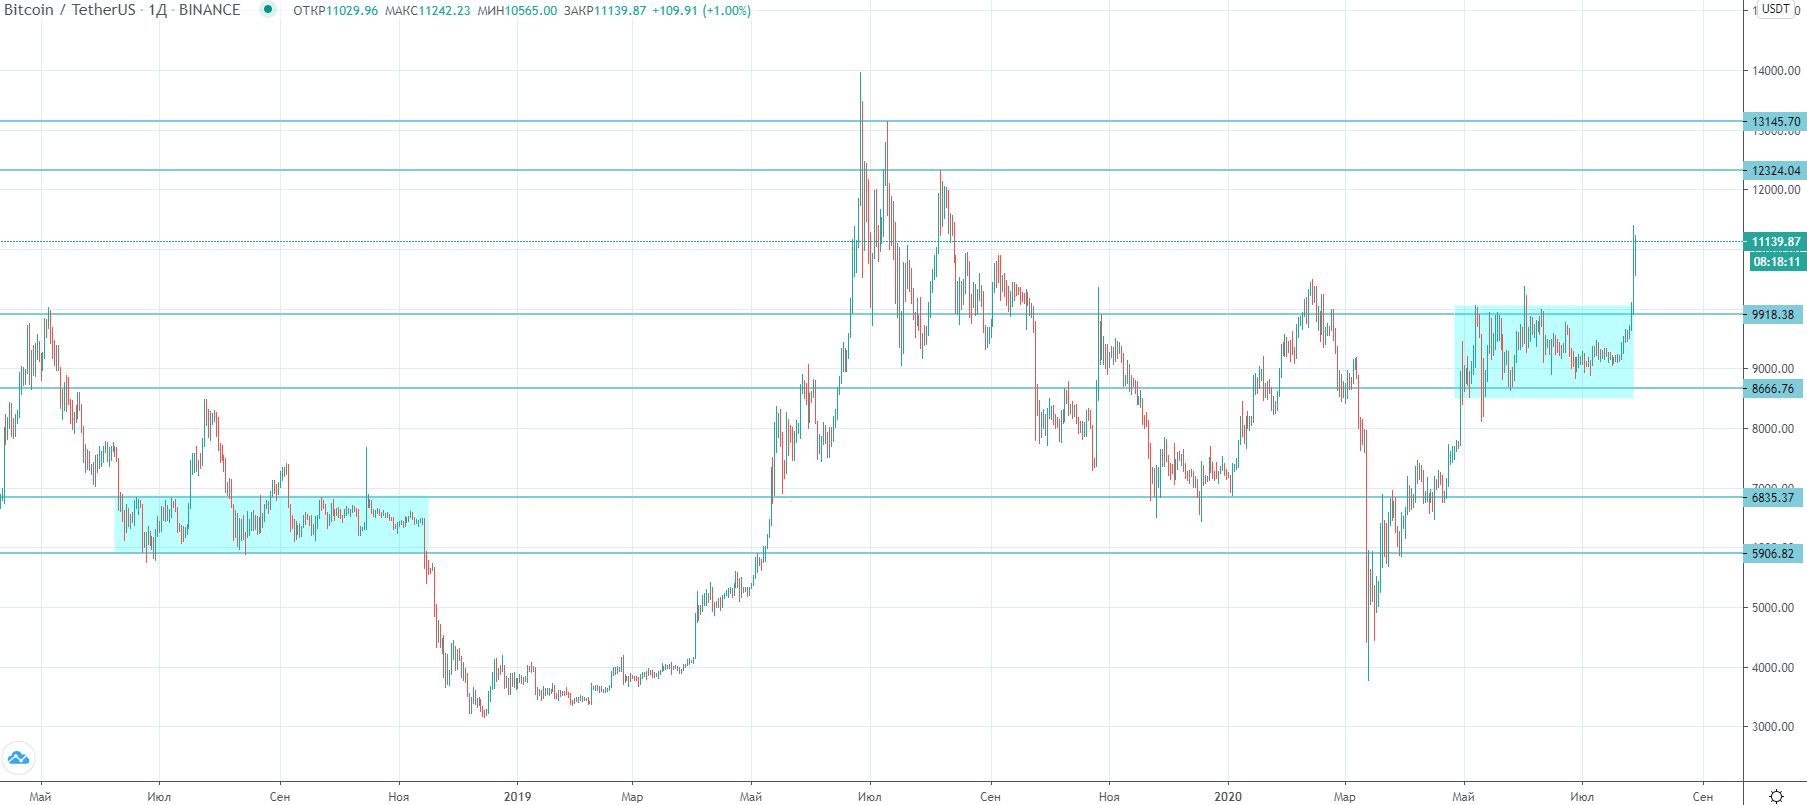
Current accumulation zone (blue on the right) and its comparison with a similar one (left, blue) with the zone boundaries and resistance levels for the current price highlighted. Daily BTC/USDT chart from TradingView.
Based on this, the first target level for BTC could be $13,000. Intermediate targets are $12,300 and $13,100. Bitcoin does not tend to corrective moves after exiting accumulation zones, so one should be wary of declines of more than $1,000.
The altcoin market paused after the surge, and capital is now flowing back into BTC. The Bitcoin dominance index had fallen below 61%, but is now around 63%. The same pattern may unfold over the course of the entire uptrend — a gradual rise in the price of the first cryptocurrency, followed by a rally in the altcoin market, and then an acceleration of BTC’s growth with a correction in other coins.
As for BTC’s support levels, these are currently only $10,000 and $10,500, which had acted as resistance and were breached earlier. Given the price breakout from the channel, there is a high likelihood of continued rise to $13,000.
Subscribe to the ForkLog channel on YouTube!