

Trader outlines Bitcoin’s odds of reaching $50,000
The trader Илья Мещеряков explains the current market situation.
Early February has seen the crypto market continue the trend that began at the end of last month. Bitcoin remains in a global flat, its dominance index is falling and, at the time of writing, sits at 61.5%.
Over the past three days, BTC has traded within a local upward price channel, reaching a strong resistance zone marked in the previous review — $38,700–$40,000. Currently we see a rejection at the lower boundary of this zone and a break from the price channel to the downside.
Although such a breakout is often a false signal and the price may attempt again to break through $39,000, in the medium term this is a strong signal of downside. This is also evident on the hourly chart, where buyers reacted at $38,700, leaving a large upper wick on the hourly candle.
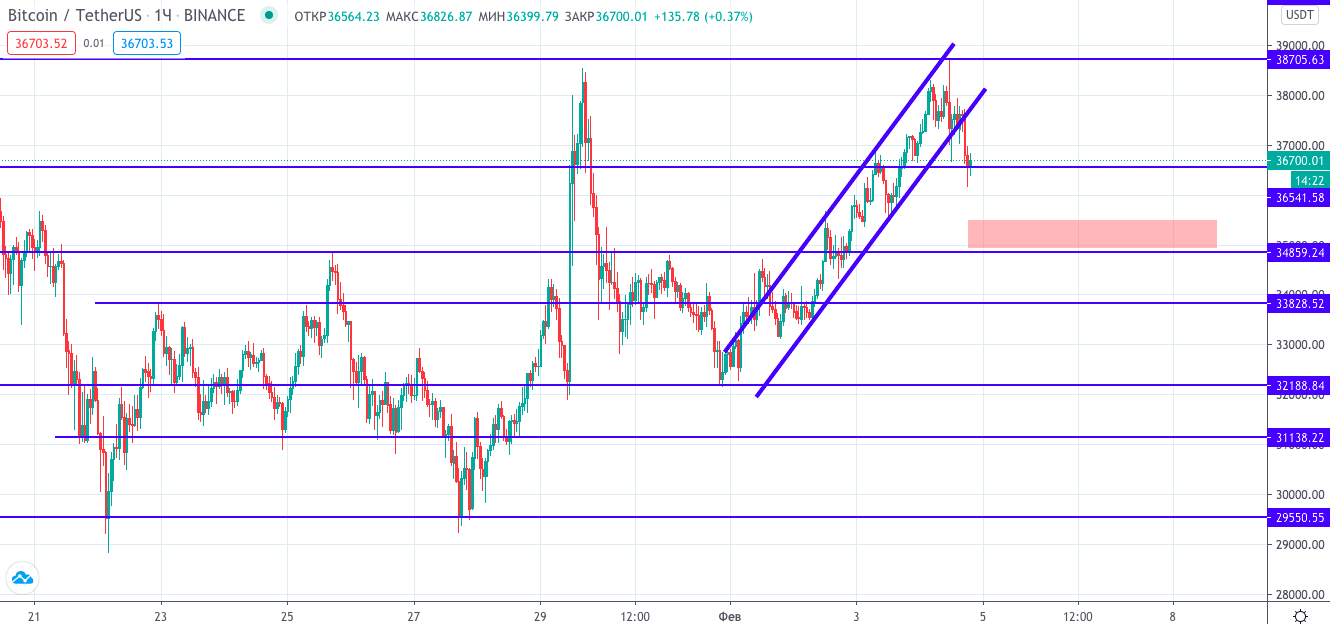
The ascending price channel and the proposed zone for accumulating buy-stop orders. The hourly chart BTC/USDT on Binance from TradingView.
On a smaller time frame, the Head and Shoulders pattern is visible; a break of the neckline would confirm the bearish movement. The initial break of the neckline has already occurred, and we may see a seller squeeze and a fall to $34,700 — the pattern’s target, about $2,000 in height.
Globally BTC is in a phase of uncertainty — buyers and sellers alternately seize the initiative, and everything should be decided at the moment of breaking through either $30,000 or $42,000. Given the current length of the consolidation and its range ($12,000), the move could be very strong—around $15,000, in the trader’s view.
This implies we could see prices well above $50,000 in the long term. However a downside breakout of the consolidation could lead to a protracted correction.
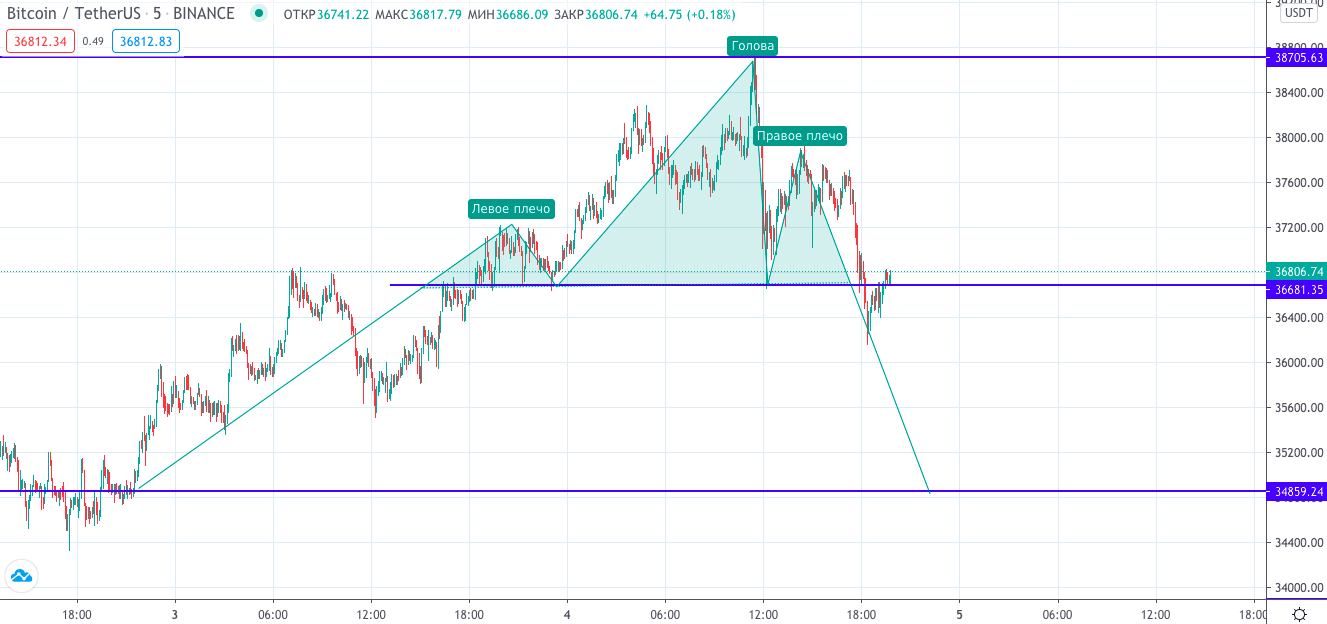
The Head-and-Shoulders pattern on the Bitcoin chart, and its targets. The five-minute BTC/USDT chart on Binance from TradingView.
Short-term traders have several options in the current price action of Bitcoin:
- breakout-and-retest strategies on local support and resistance levels;
- trading altcoins — many offer clear trading setups.
Long-term traders are better off simply watching how the market unfolds. They may also take note of other coins that hint at an “altseason.”
Subscribe to ForkLog news on Telegram: ForkLog FEED — the full news feed, ForkLog — the most important news and polls.
Рассылки ForkLog: держите руку на пульсе биткоин-индустрии!