


A practicing trader and founder of the Crypto Mentors project, Nikita Semov.
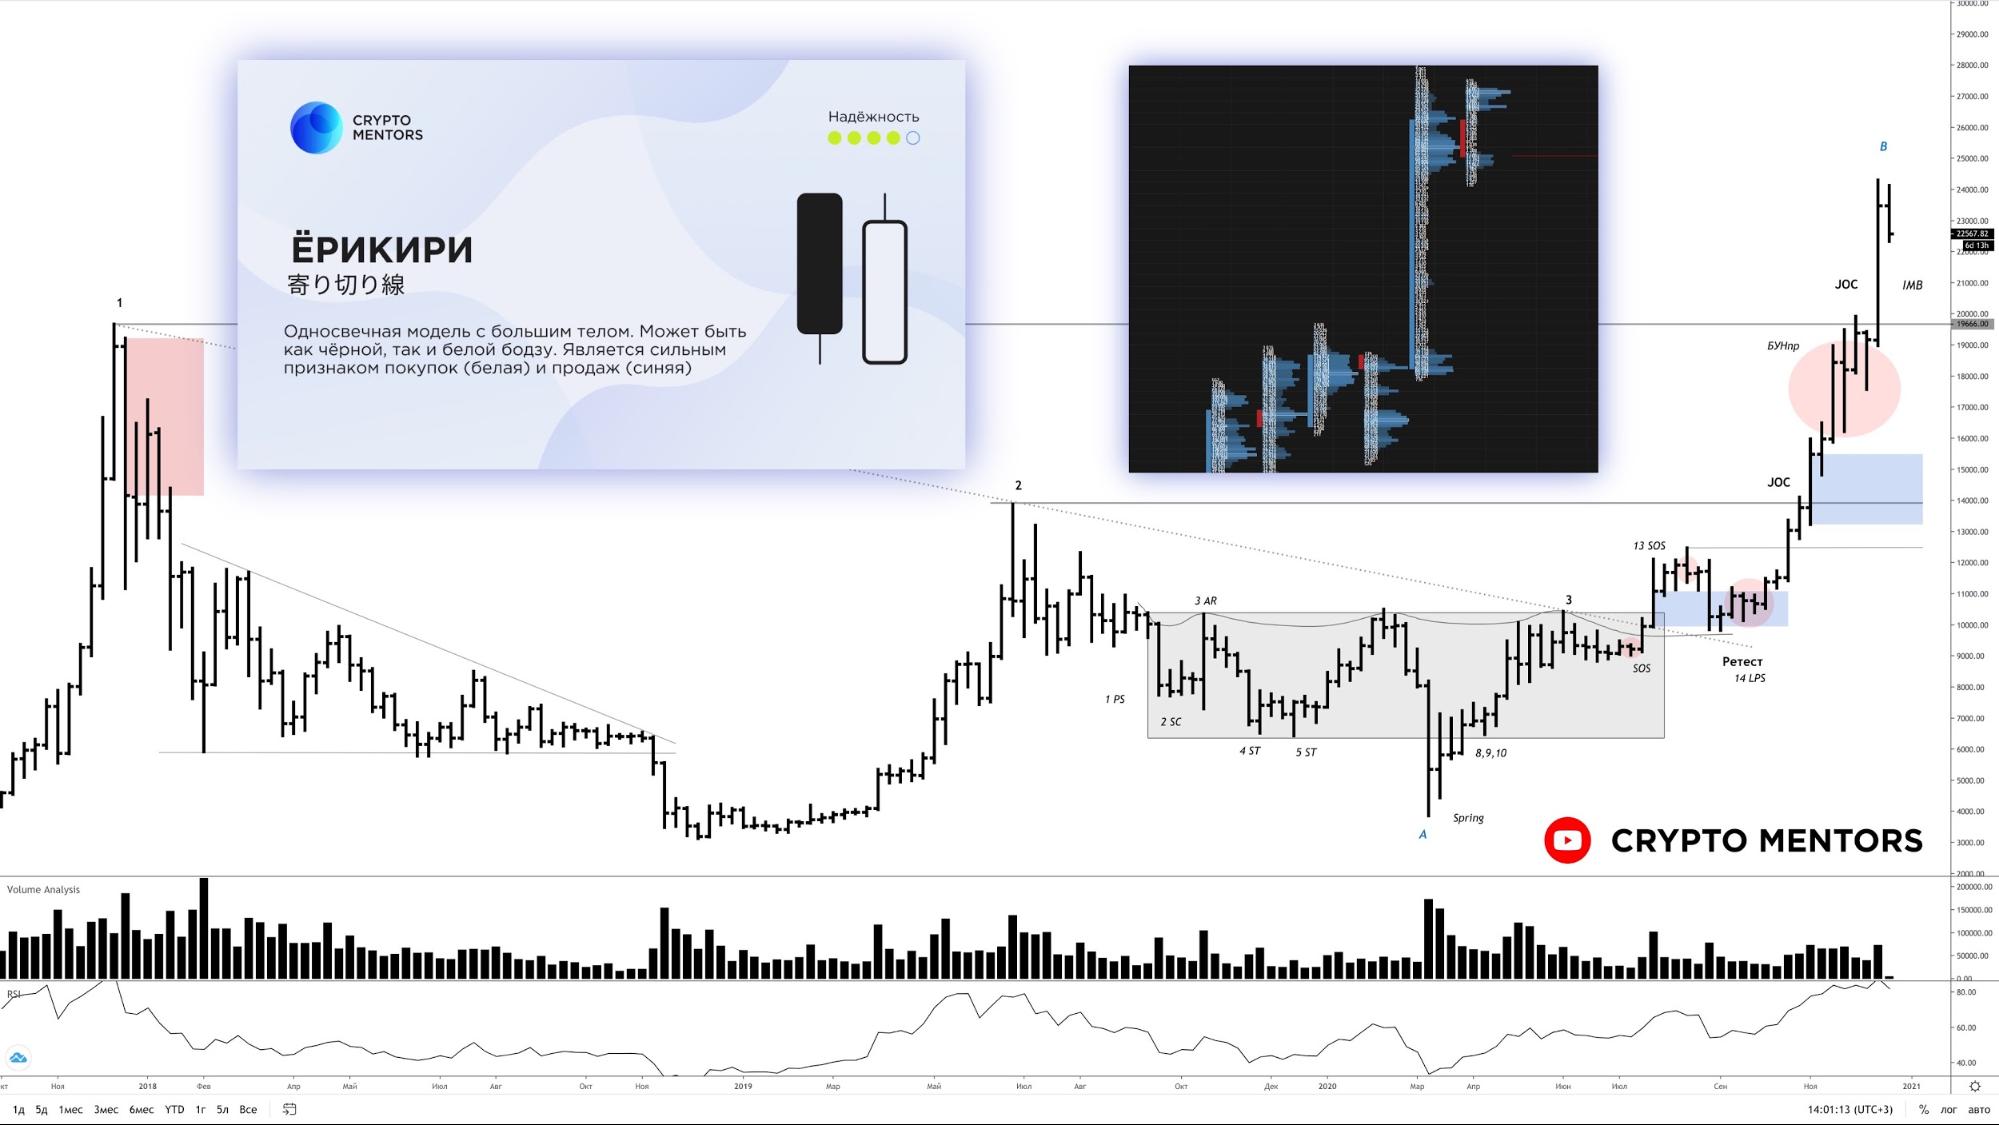
Bar-by-bar analysis. The week’s spread is large relative to the current AB wave, and relative to all previous ones. A Type 2 close.
Volume is large across the matrix, with a correlation to the spread evident. The obvious progress points to buying pressure; the result is visible in the bar: the horizontal has been effectively breached.
Expectations in such bars are built on a weak test and a further resumption of buying
Japanese candlesticks. The “erikiri” pattern — a candle indicating substantial buying. Expectation of a possible correction and continued growth.


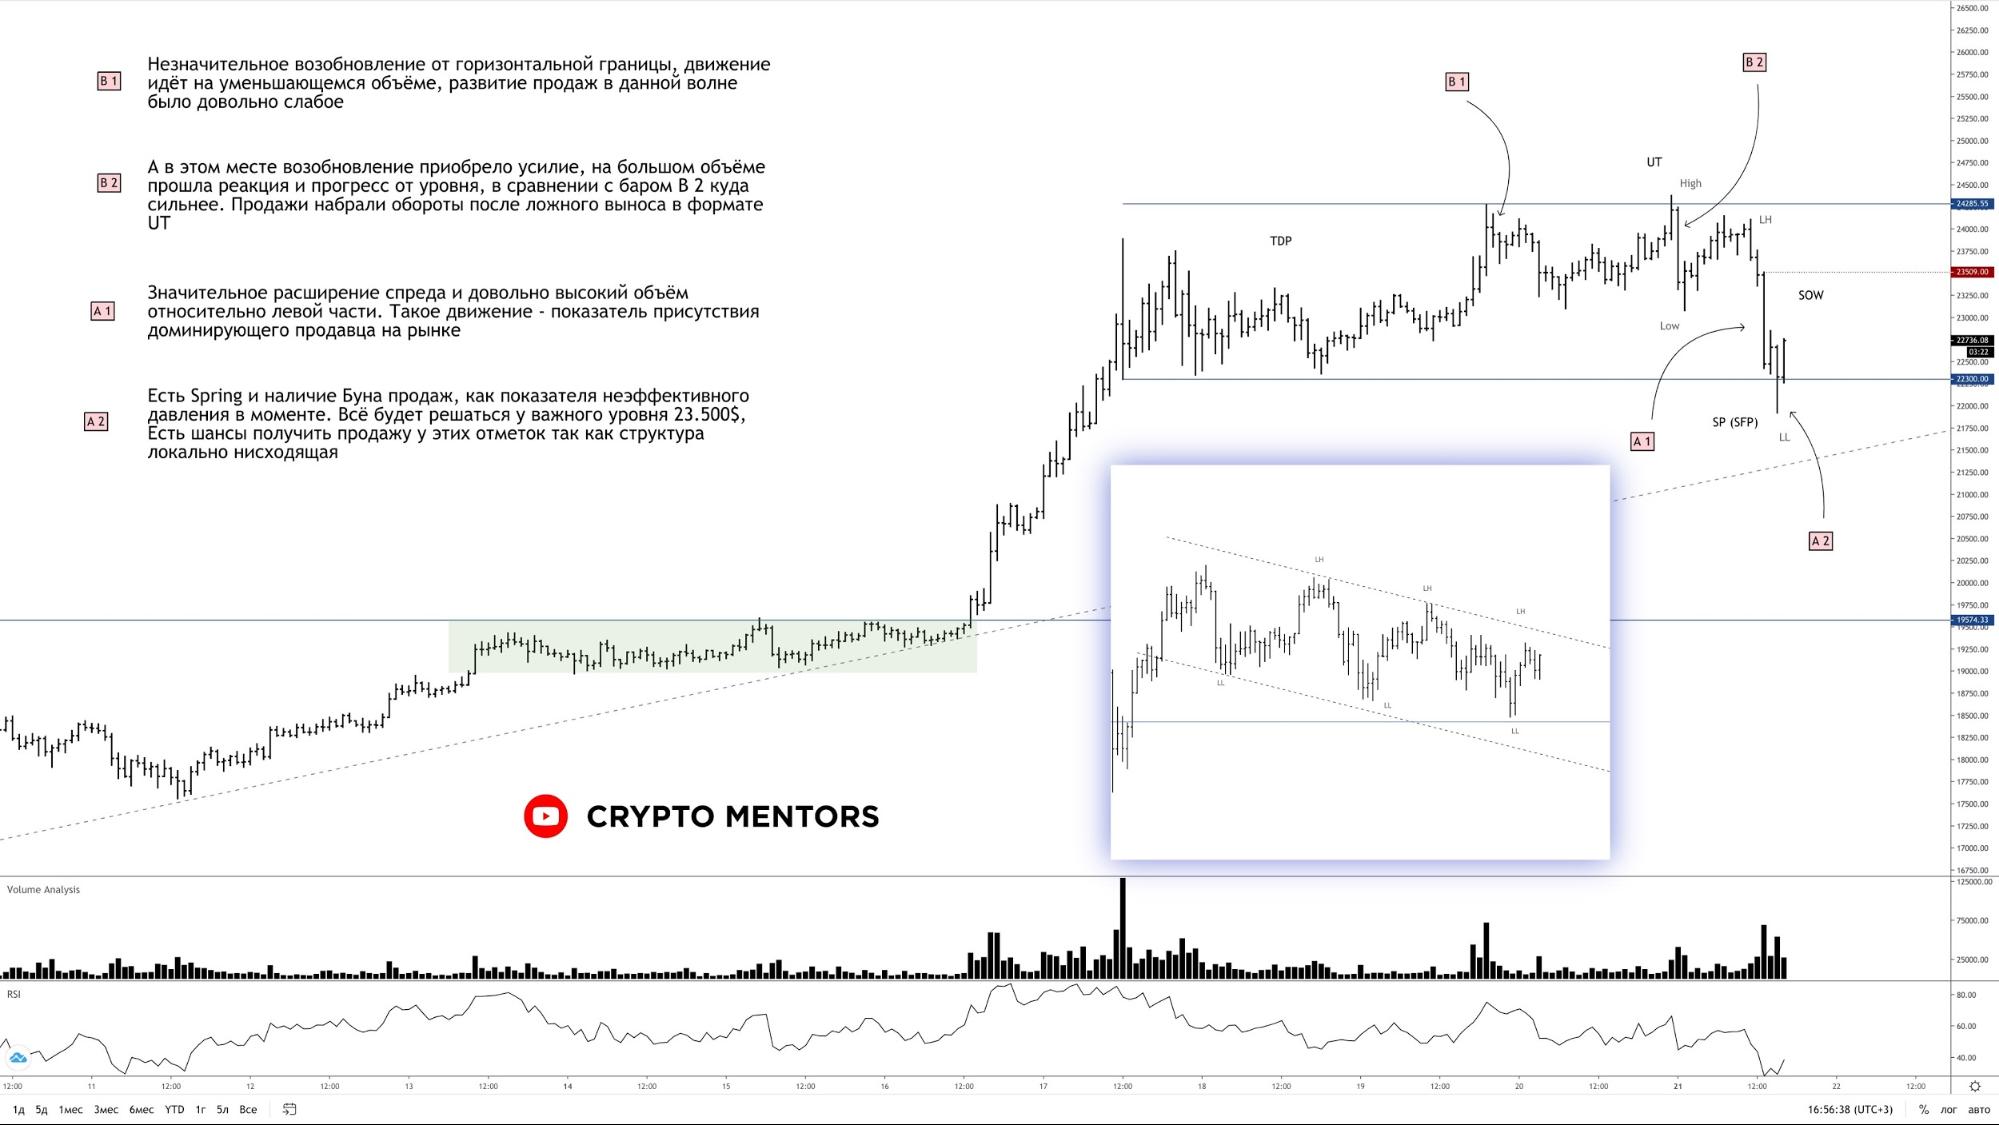
Price Action and VSA
The price produced a substantial sell-off, dropping 9% in a few hours. This pattern of decline signals supply-side dominance in the market.
A retracement to $23,300 has been achieved, and pressure toward the lower bound is forming to refresh the local minimum and push toward $20,000 per coin.
Analysis of horizontal volumes
At present, a two-block accumulation model has formed, under which we are currently positioned [1]. Accordingly, the POC at $23,000 and $23,500 are important resistance levels.

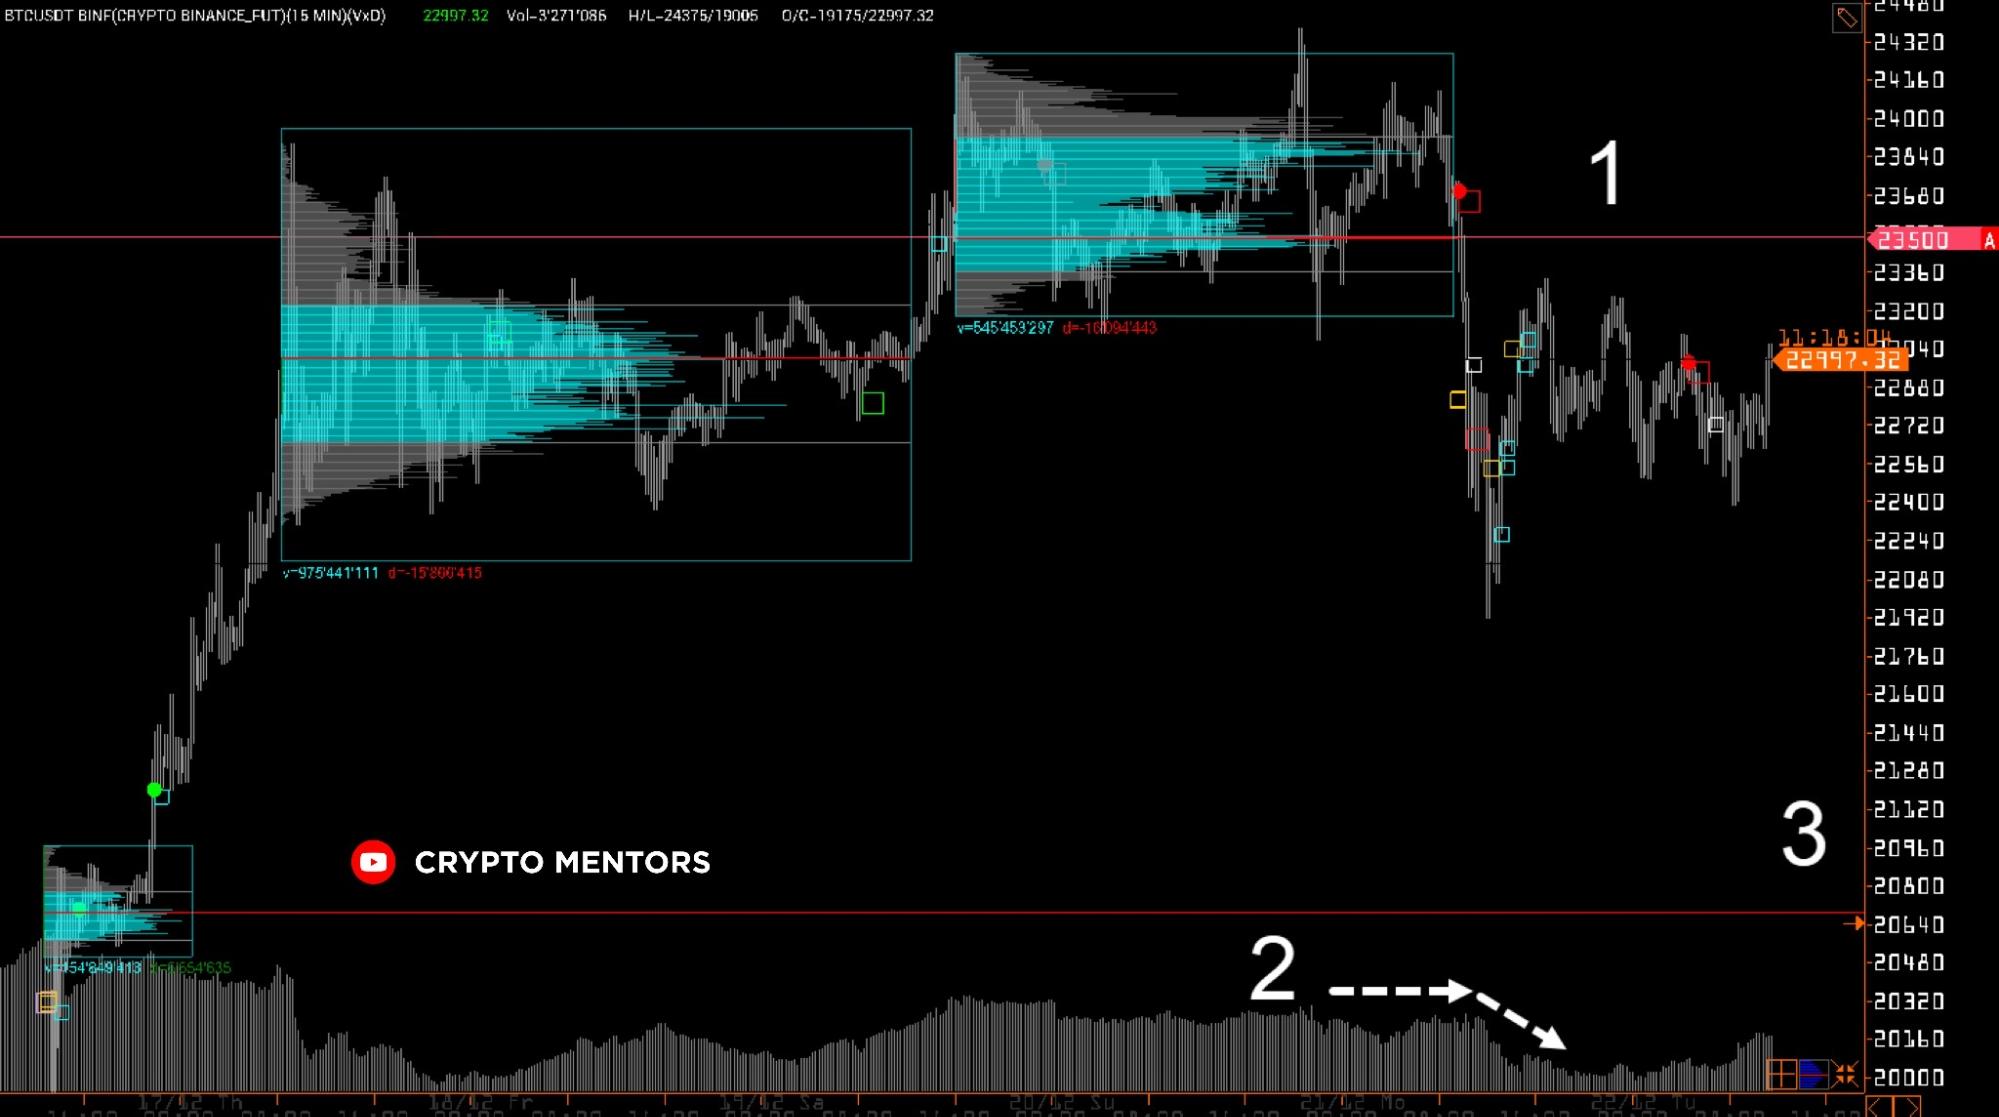

Moreover, a divergence in cumulative delta has formed, indicating a loss of bullish initiative. Additionally, open interest, for once, does not decrease on the fall, and maintains its levels, while the rise does not correspond to opening new positions [2].
Thus, much points to a short-term correction, which is likely to land in the zone of the next important trading range around $20,700.
Subscribe to ForkLog news on Telegram: ForkLog Feed — the full news feed, ForkLog — the most important news and polls.