


The trader Ilya Meshcheriakov explains the current market situation.
After dipping to $17,500, Bitcoin rose by more than $1,500 over a couple of days and, at the time of writing, was trading slightly above $19,000.
For the bulls, this is excellent news not only from the perspective of price growth but also with regard to holding above $17,400 — a level I previously identified as crucial to the development of the long-term trend.
At the moment we are witnessing the formation of a fairly strong bullish pattern — an ascending triangle. The resistance zone around $19,500 serves as its upper boundary, and the lower boundary is drawn through the November 26 and December 11 lows (as shown in the chart below).
The strength of the pattern lies in buyer pressure, with activity appearing at ever-smaller pullbacks, while sellers merely try to hold the same zone.


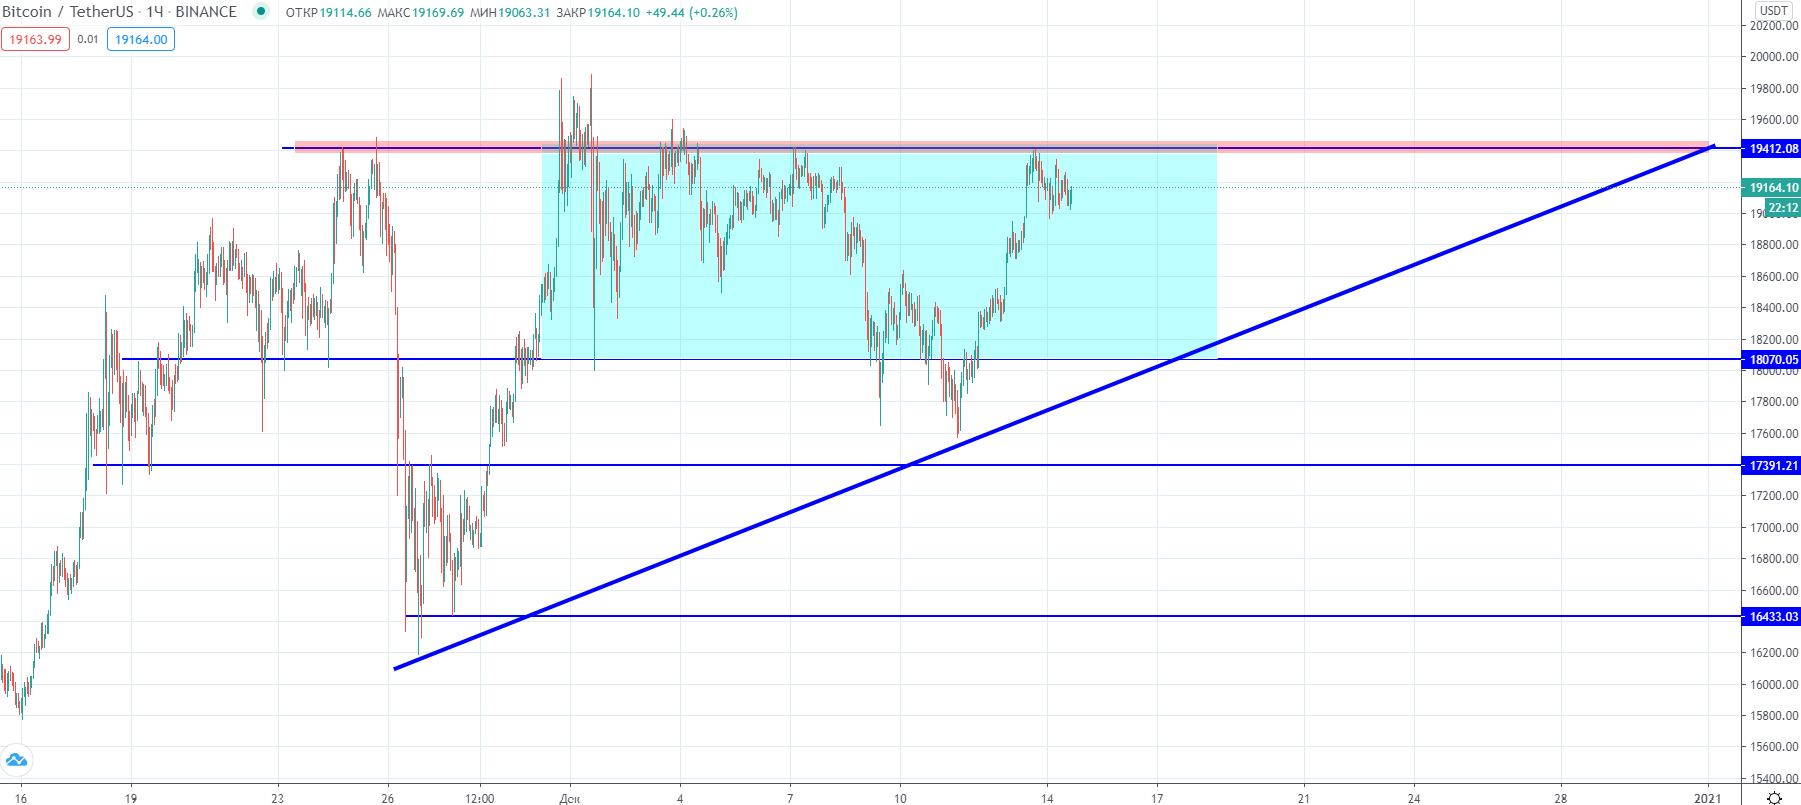
Ascending triangle formed by Bitcoin price with a resistance zone of $19,500. The hourly BTC/USDT chart from TradingView.
Thanks to the pattern, we can gauge both the approximate range of further volatility and the targets for a breakout. The current lower boundary of the decline within the pattern sits around $18,100, and the upper boundary coincides with the $19,500 resistance zone.
It is worth noting that weekly volatility has been sufficiently large to suggest an imminent breakout of the pattern — the extreme readings will occur only by the middle of next week. This means that over the 7- to 10-day horizon we may see a relatively calm market, followed by an impulsive move.
Regarding movement above the $19,500 resistance, although the price does not show a strong tendency for false breakouts of this zone (of four touches, only one was followed by a false breakout upward), we can, with a high degree of probability, say that behind it lies a large concentration of stop-loss orders from sellers and those looking to go long on a breakout. As a result, tickets have already begun for the ‘margin-call carousel’, since the first breakout is likely to be false with a return to the triangle.
Local levels I marked on a finer time frame, the key level is $19,000 — that is from which we are currently seeing the main buyer support, enabling an attempt to push through a false breakout of $19,500; a strong level is also at $18,600.


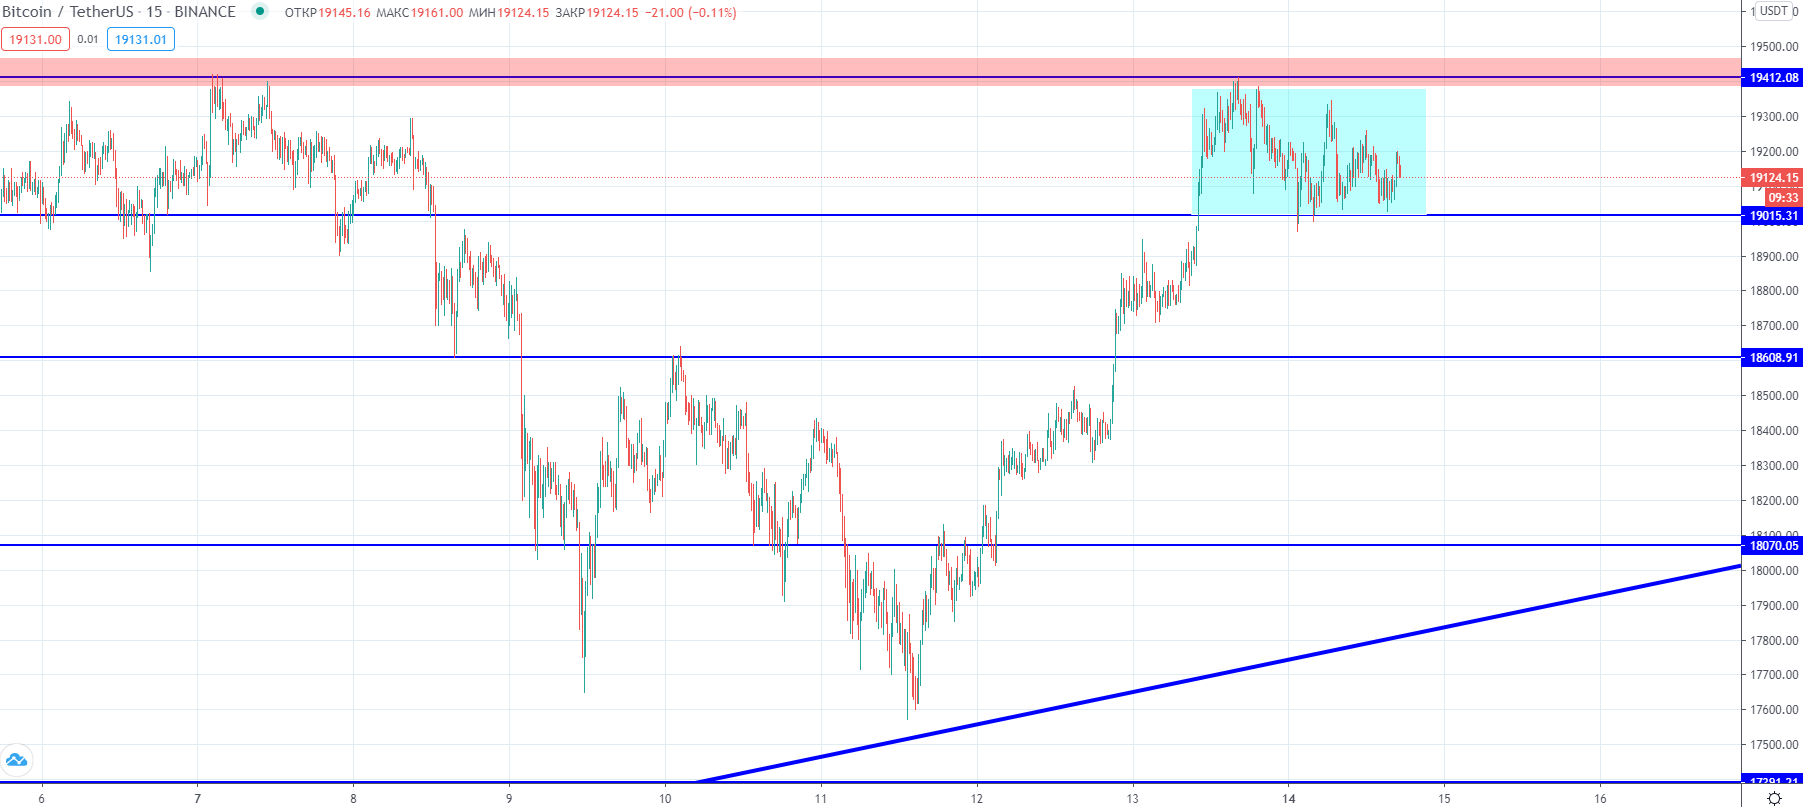
Local uptrend and support levels on Bitcoin. Fifteen-minute chart BTC/USDT from TradingView.
Thus, BTC has emerged from substantial uncertainty into a more bullish formation — buyer activity on pullbacks has made itself felt.
The long-term objective derived from the pattern sits about $23,000, but in the mid-term we may face both a false breakout of the $19,500 level and a notable decline in volatility.
Subscribe to ForkLog news on Telegram: ForkLog Feed — the full news feed, ForkLog — the most important news and polls.