


A practising trader and founder of the Crypto Mentors project, Nikita Semov, explains the current market situation.
Bar-by-bar analysis
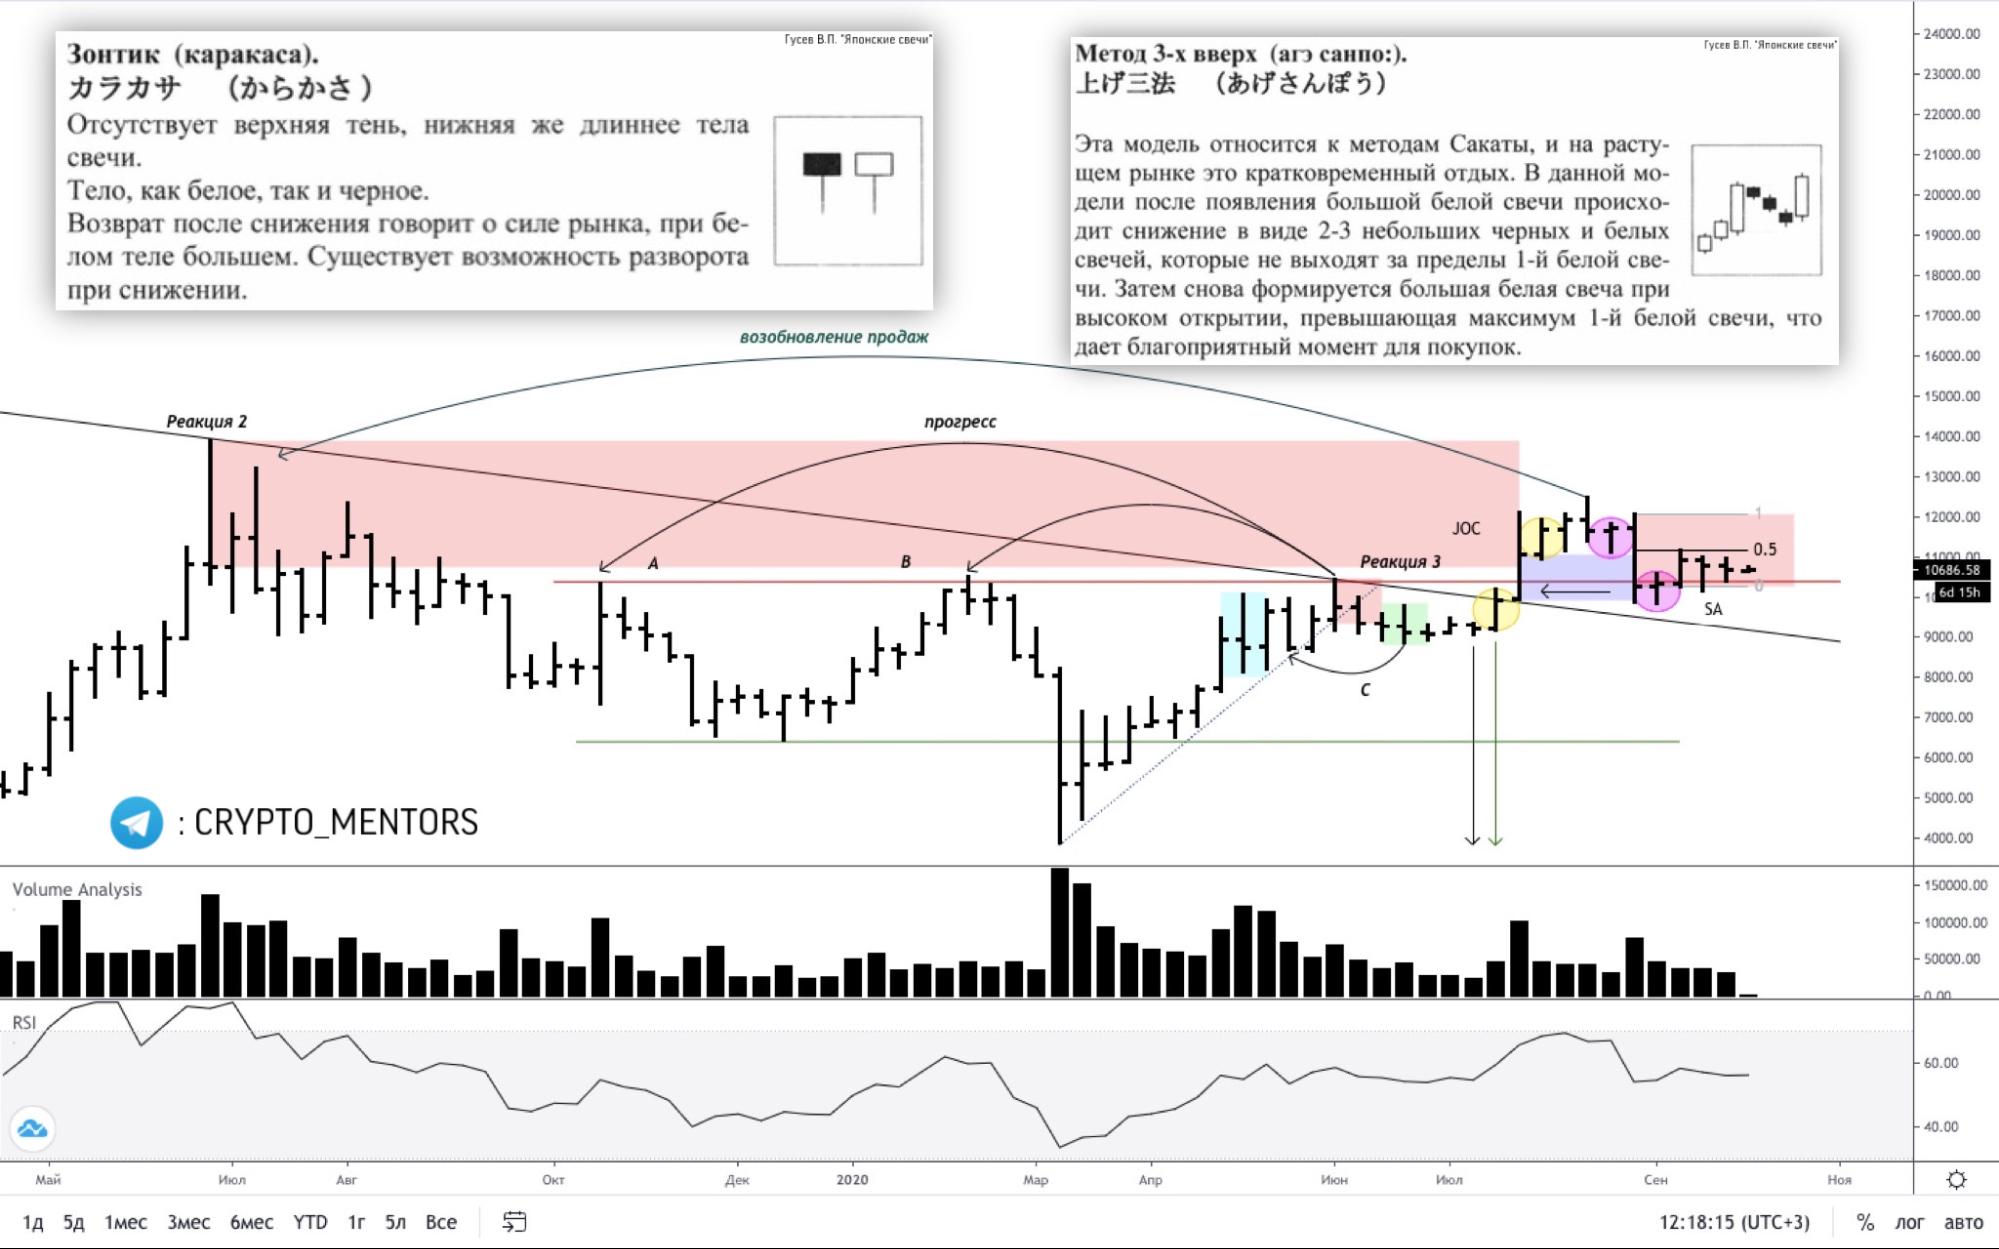
On the weekly time frame, last week’s spread is very weak, with a tiny sell-off in the current local corrective wave, which in turn is a test of the buying bar.
Volume is likewise too small, one of the lowest in recent times. There is no resumption from the selling zone; bears’ progress is weakening, indicating a lack of initiative. The reaction from 0.5, as expected, was achieved but has since faded. The movement of the last two weeks is a SA signal plus a test with a shadow rejection.
We expect buying activity this week; the week will close with a bullish bar. According to Japanese candlestick analysis, a rise is expected, as the pattern resembles the “Three Methods” and several “umbrella” candles are appearing one after another.
One could stretch to the “two black crows” pattern, but that would not be entirely correct, though it is permissible.


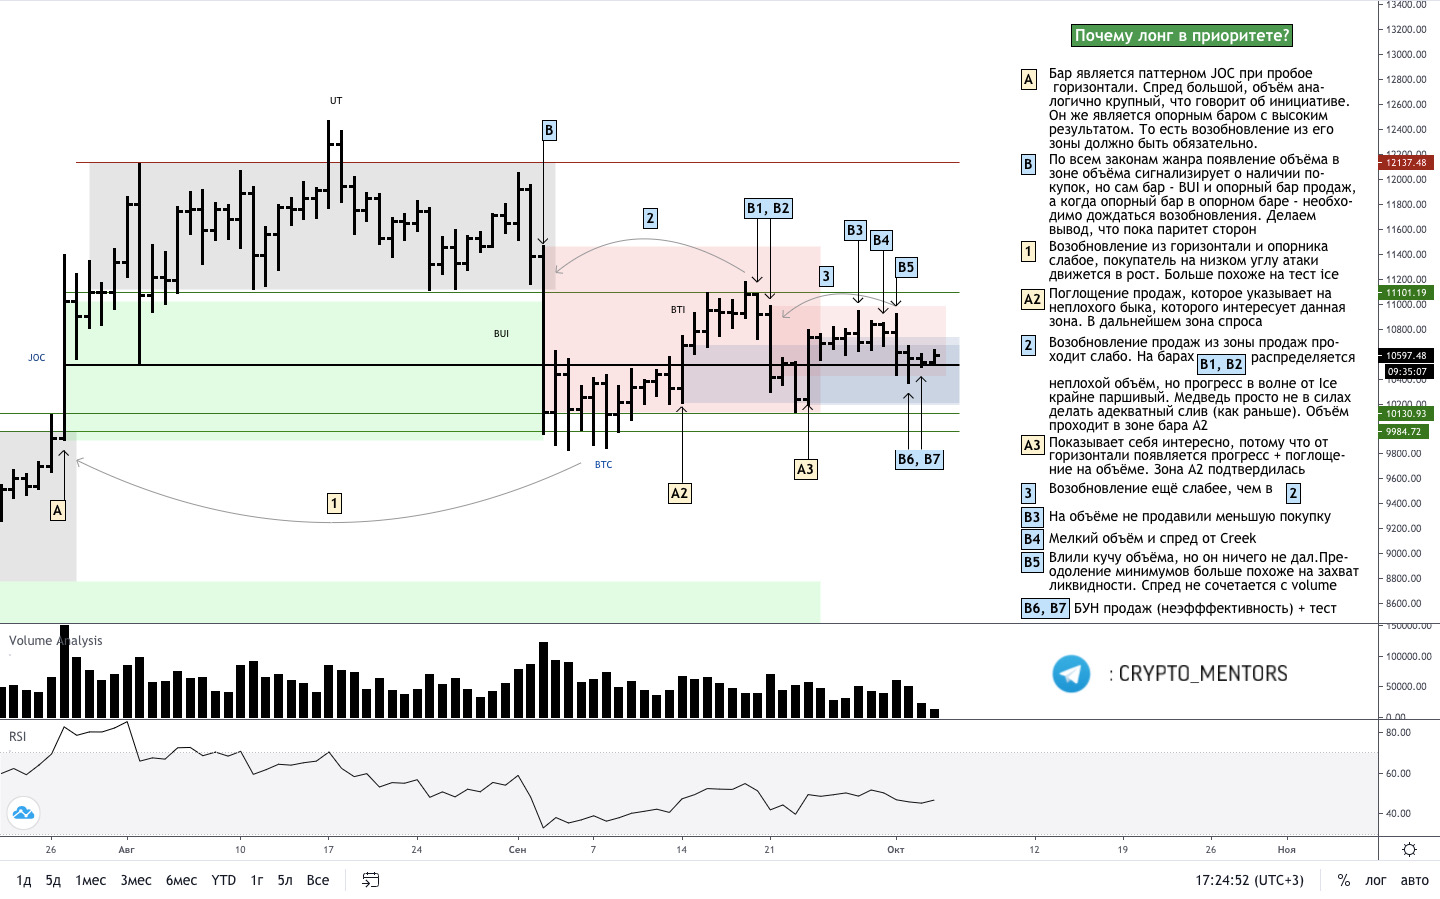
On the daily time frame, in the second and third waves we get a weak continuation of selling, and in VSA there is the golden rule: whoever showed weakness last is defeated. In the current situation, the bears suffer a fiasco on the D1 chart.
In the last bars B6, with effort, the price could not be pushed down; we saw a BUNpr with large volume and a small spread. There was simply no money left (bar B7), and this became a tail test. We see more signs for a long, waiting for buyers to appear, as indicated earlier.


Price Action and VSA
Because a bar signalling mispricing appears in the absorption zone of selling, we can speak of weakness on the sellers’ side. Consequently, the path to $11,000 is open, and that is where we will look to enter long.
In the mid-term, the angle of attack by sellers leaves something to be desired — weakening with each new wave from the support bar zone. The narrowing of the range in the market and the appearance of volumes at the lower boundary indirectly point to interest in an upside breakout from the triangle.
Analysis of horizontal volumes
Globally, price is trapped between two major volume clusters, indicating the market is in a balance phase. Given that most of the volume sits at the lows, one can with high probability claim that this is indeed a balance-accumulation.
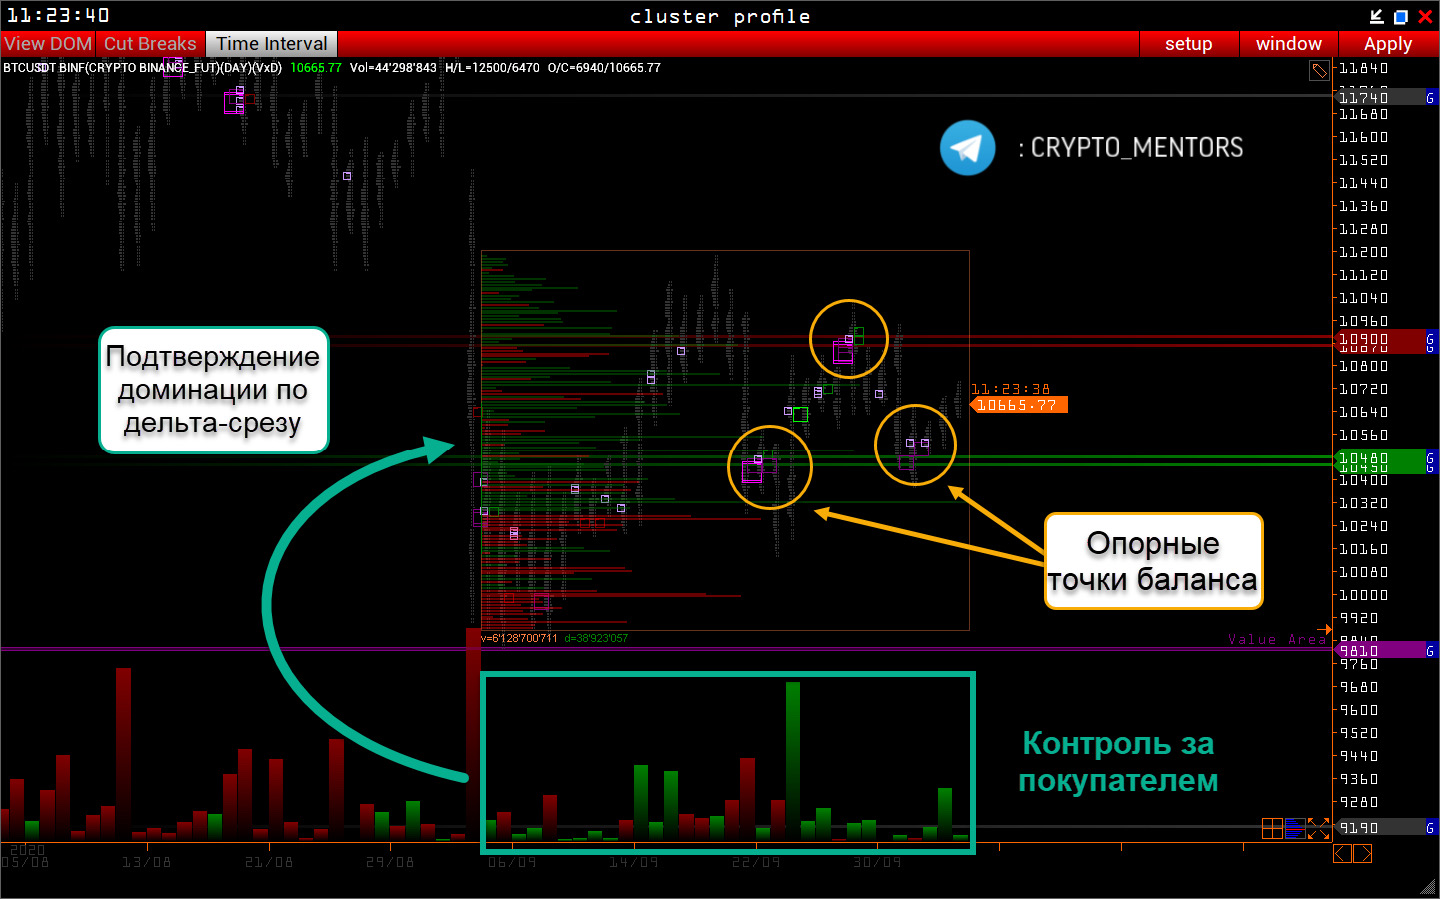
Another sign of potential disruption of this balance is buyer control over delta, expressed in both the histogram and the delta slice, where the majority of prices with a large gap are won by buyers.
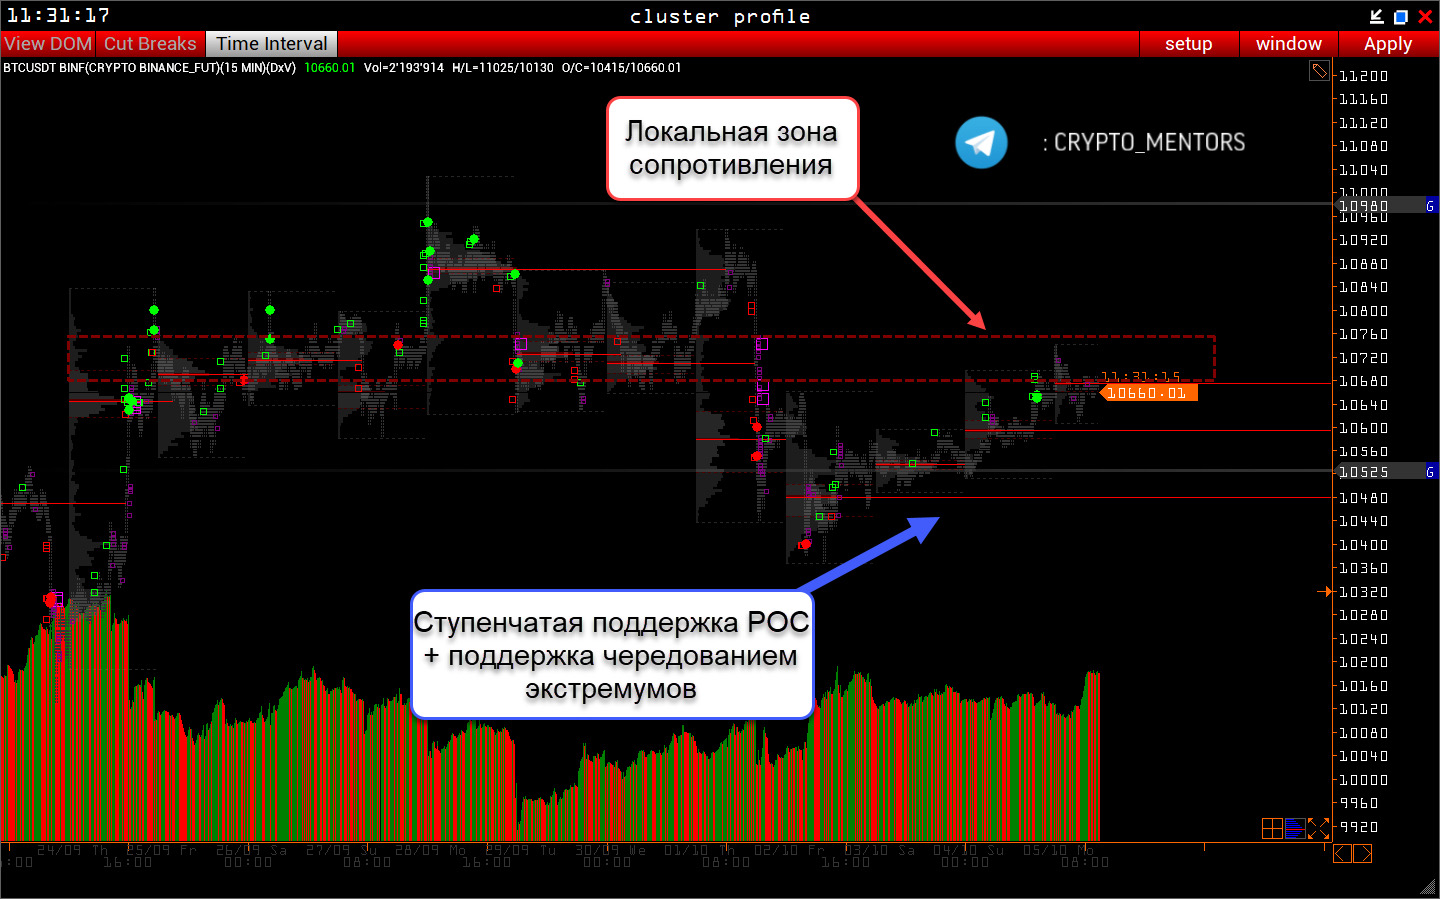
Nevertheless, locally we have reached a resistance zone that may create an even tighter balance in the range of $10,600–$10,720. However, the overall structure of an ascending move with stepped POC shifts, together with the maintained order of alternating extremes, suggests a high likelihood the market will go higher, toward $11,000.
Subscribe to the Forklog channel on YouTube!