


Trader Sets Next Bitcoin Price Target on Path to All-Time High
The trader Ilya Meshcheryakov explains the current market situation.
Bitcoin managed to hold above the $15,900 support and reach the previously indicated target of $17,500 in just a few days.
Moreover, Bitcoin briefly hit the year’s high of $18,500, and after a correction continues trading around $18,000. Altcoins continue to lag, and the dominance index has already surpassed 66%.
After reaching the $18,500 level, Bitcoin faced a fairly sharp correction of about $1,300, but it would be premature to conclude that the rally has ended. The decline may have been driven not only by profit-taking among large players but also by the squeezing out of buyers who eagerly chased peak prices with leverage.
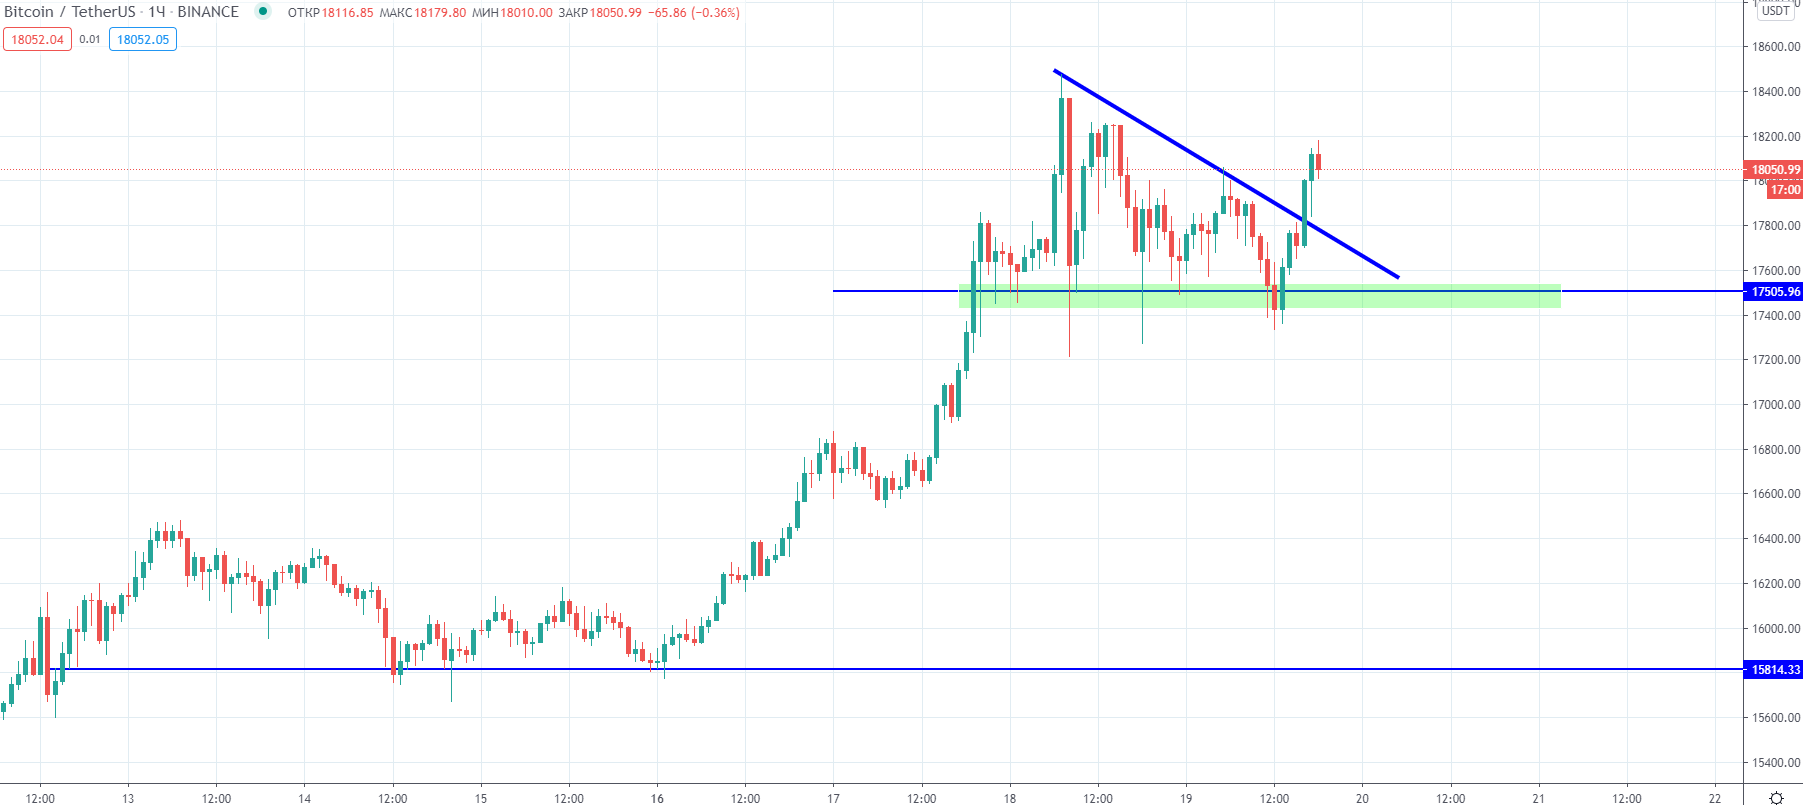
Bitcoin has found strong support in the $17,400–$17,500 zone and has tested it several times, suggesting that the bulls may not concede before pushing toward an all-time high.
The descending triangle, which previously could signal a decline, was also broken to the upside, so technically the picture looks relatively safe.
 BTC/USDT от TradingView.” width=”1803″ height=”805″ srcset=”https://forklog.com/wp-content/uploads/image1-372.png 1803w, https://forklog.com/wp-content/uploads/image1-372-300×134.png 300w, https://forklog.com/wp-content/uploads/image1-372-1024×457.png 1024w, https://forklog.com/wp-content/uploads/image1-372-768×343.png 768w, https://forklog.com/wp-content/uploads/image1-372-1536×686.png 1536w” sizes=”auto, (max-width: 1803px) 100vw, 1803px” />
Broken descending triangle on Bitcoin with highlighted support zone (green). Hourly chart BTC/USDT from TradingView.
Targets for further growth can be defined from the height of the figure — in the range of $18,800–$19,000, and beyond that Bitcoin’s all-time high is not far away. The path to it is somewhat more challenging.
It is unlikely the price will stop right near the maximum if it can reach it, since this would be unattractive for large capital: media buzz is typically strongest only when an all-time high is broken, attracting some private investors to the market.
However, a rise decisively above $20,000 looks doubtful — if we go back to 2017, recall that the bear market began with derivatives that made short positions commonplace for market participants. Since then there is not much fundamental difference between a substantial rise and a substantial fall, except for moments of attracting new capital.
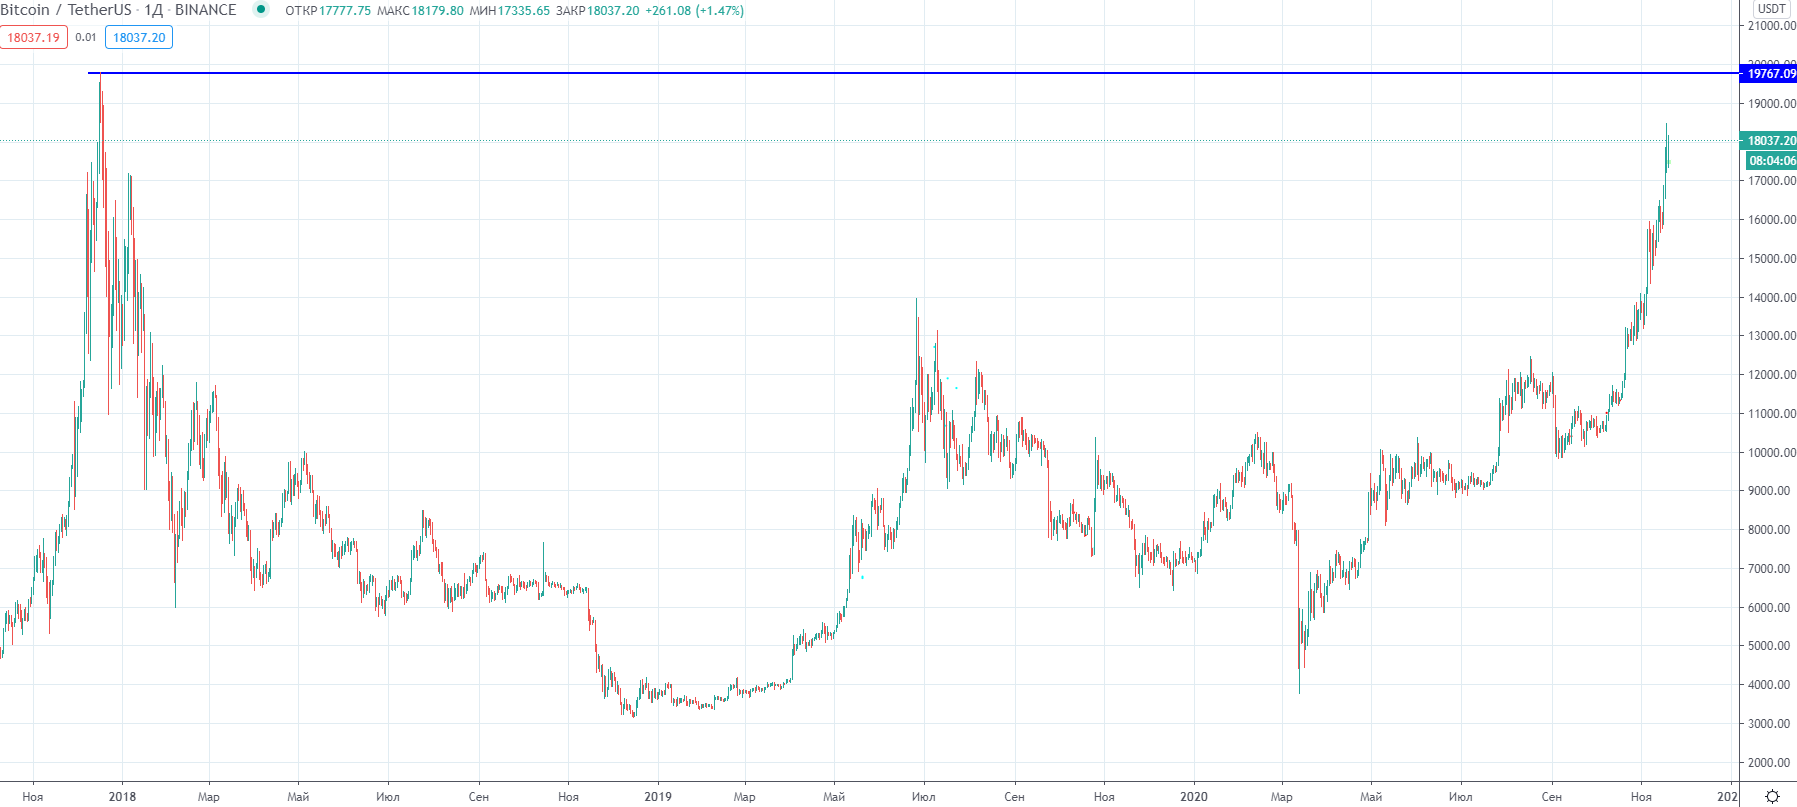
Current Bitcoin price and the 2017 high. Daily chart BTC/USDT from TradingView.
Liquidity has risen, so paying for each new dollar of gains becomes more expensive, not to mention that buying 10,000 BTC at $5,000 and at $20,000 are two different propositions. But these are distant prospects; for now there is support at $17,400, a break below which would invalidate the scenario of new highs, and the $18,800–$19,000 zone as the target of the current pattern — it must be crossed to reach the historic price record.
Subscribe to ForkLog news on Twitter!
Рассылки ForkLog: держите руку на пульсе биткоин-индустрии!