


A practicing trader and founder of the project Crypto Mentors Nikita Semov explains the current market situation.
Weekly Auction


Globally, Bitcoin is currently in a phase of range contraction. This can be easily identified by shrinking bar spreads, as well as the overlap percentage of each successive bar with the previous one, which in the last four bars has exceeded 60%.
Given our focus on fairly large timeframes, moves should be expected to be commensurate — a price move of about $10,000.
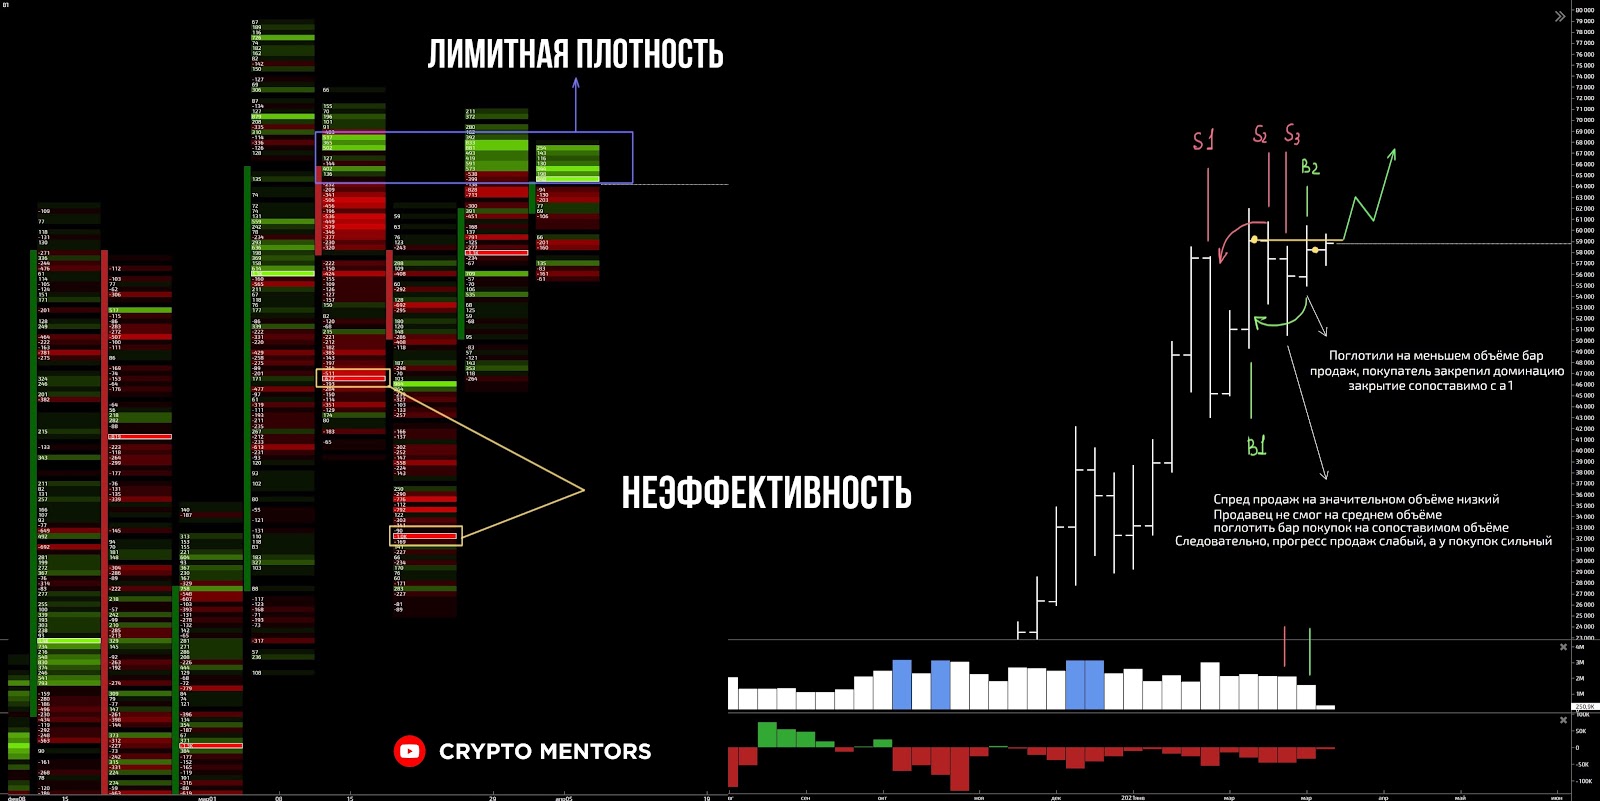
Analyzing each weekly bar individually, following the bar-by-bar technique, we can note the formation of a selling-engulfing pattern. Taking into account the substantial wick on the buy side last week, as well as decreasing volumes, one may conclude that the buyer is currently winning this confrontation.
Examining the horizontal distribution by bid and ask imbalance, it becomes evident that in the upper part of the traded range, namely $59,200–$60,200, market buys dominate by a wide margin, or more accurately, there are selling limit orders.
Analyzing price reaction to this range, one can assert with confidence that a “limit plate” has been set here, temporarily restraining the price.
Considering the overall uptrend context, as well as patterns on more local auctions, we tend to think this is not a reversal, but an artificial restraint ahead of a further rally to rebalance positions held by major players.
As soon as interest in the restraint fades — we may witness a highly impulsive and volatile move.
Local Perspective
Signs of buying leadership evident on higher timeframes are corroborated by shorter-term auctions as well.
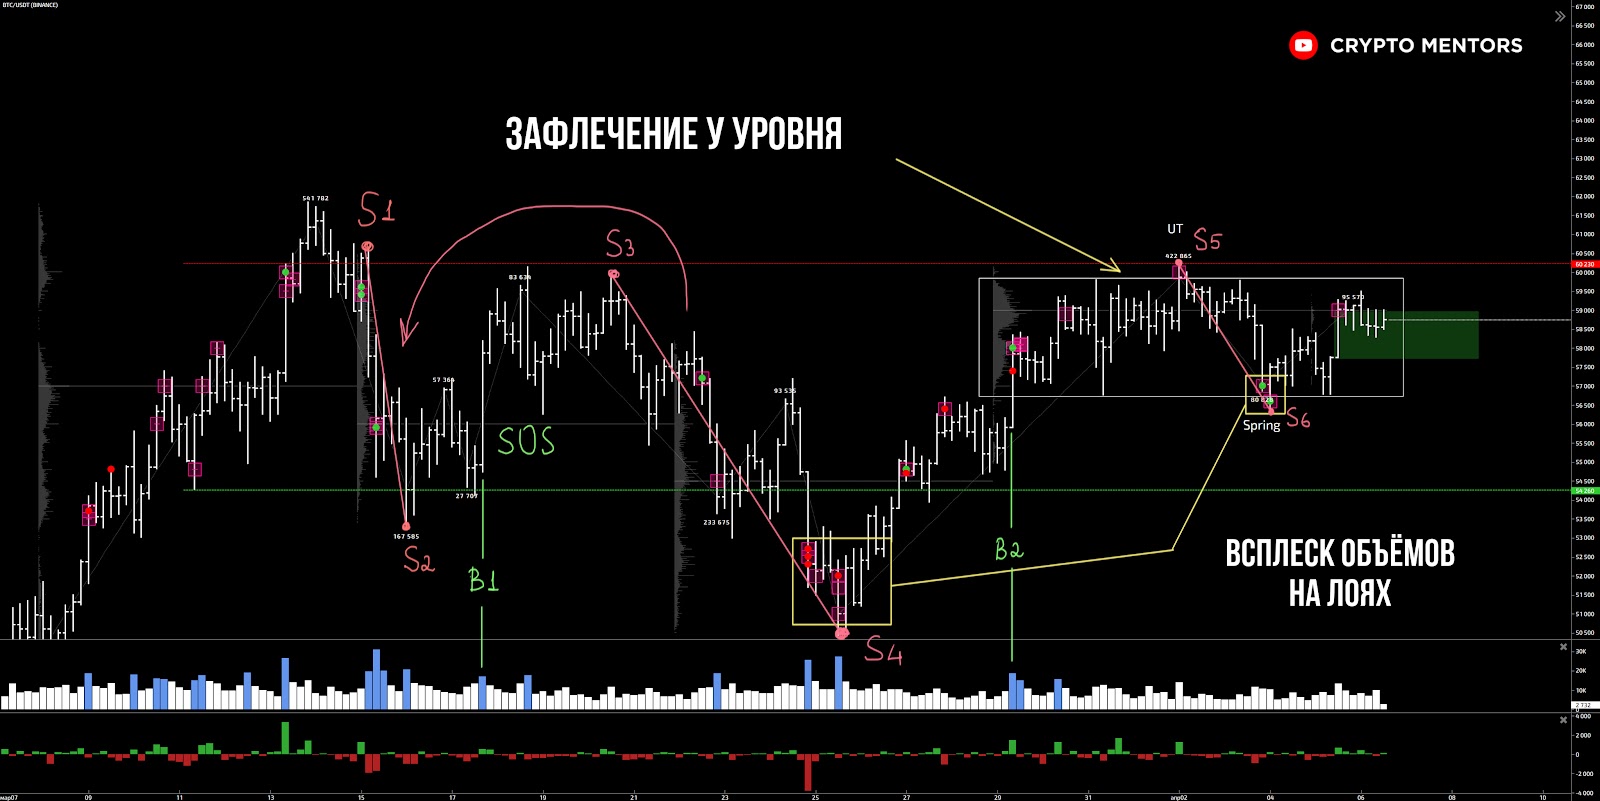
Thus, on the hourly chart we can see that the range $58,350–$58,650, which we wrote in the previous analysis, remains a key link in deciphering what is happening.
Note that at the moment we have again returned to it and performed the so-called reverse retest of the lower boundary of $58,350. Such a pattern indicates price acceptance and, accordingly, market participants’ acceptance of this price range.
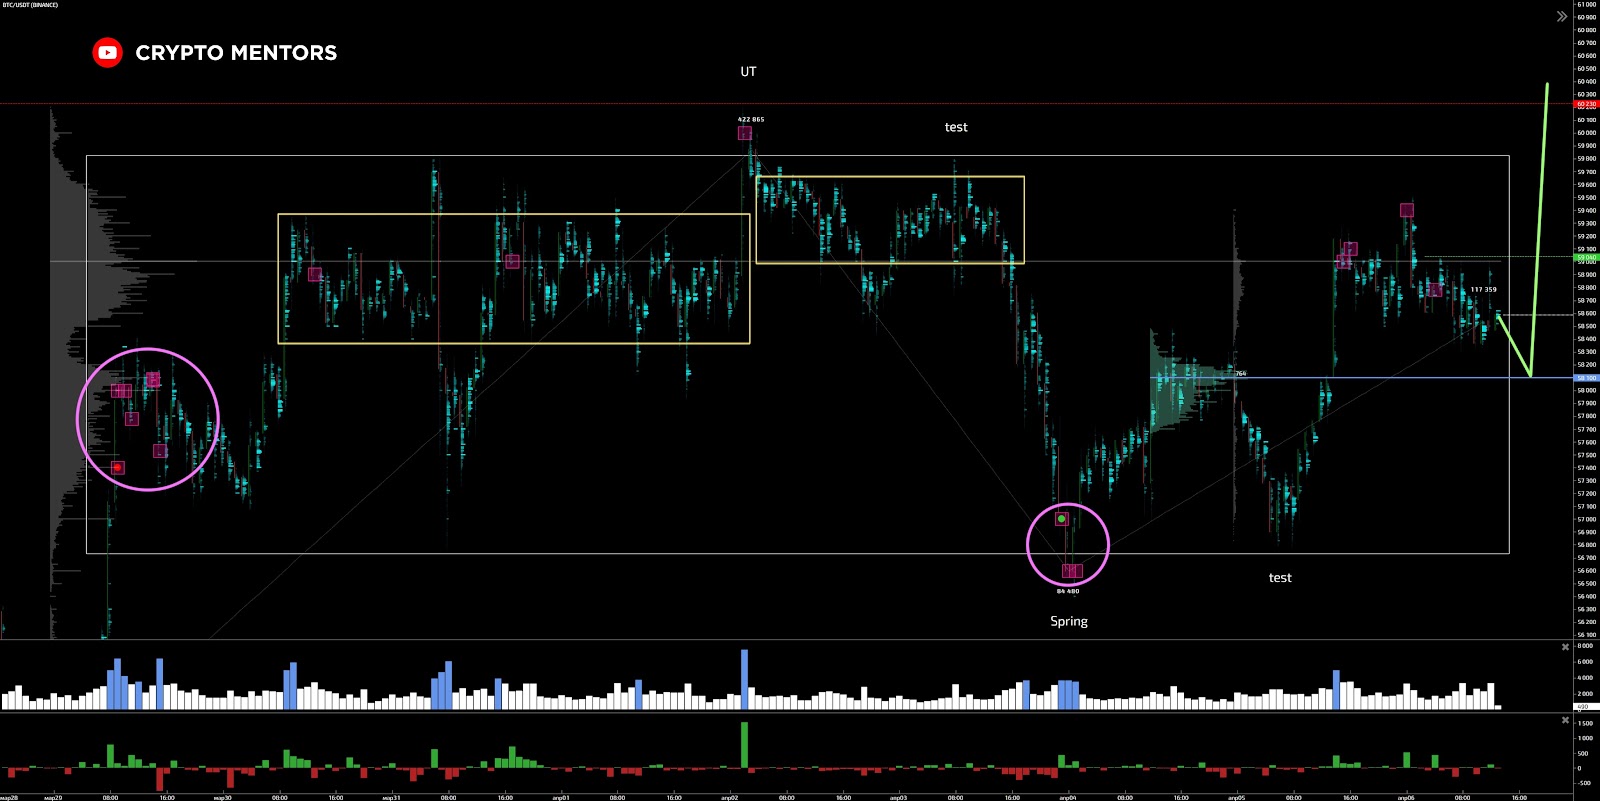
Also notable is the dynamics with which moves occur. Notice how impulsively and aggressively buyers returned the price to the range after drawing a “double bottom” for retail traders. Meanwhile, current selling shows a very shallow angle of attack and an inability for sellers to push the quote.
Given that this accumulation formed near a significant historical selling level, one can say with confidence that the probability of breaking through this important level and updating the all-time high is substantially elevated.
Even more detail emerges when we analyze the delta, i.e., the balance of market buys and sells. In addition to the “double bottom,” a very powerful selling-engulfing pattern through limit orders formed, one of the manifestations of “inefficiency.”
This confirms the strength and willingness of buyers to push Bitcoin’s price higher.
Thus, a range of factors point to a breakout of Bitcoin’s last all-time high and the resumption of the rally. How long it will last and what exact levels Bitcoin will reach remains too early to say.