


A practicing trader and founder of the project Crypto Mentors, Nikita Semov, explains the current market situation.
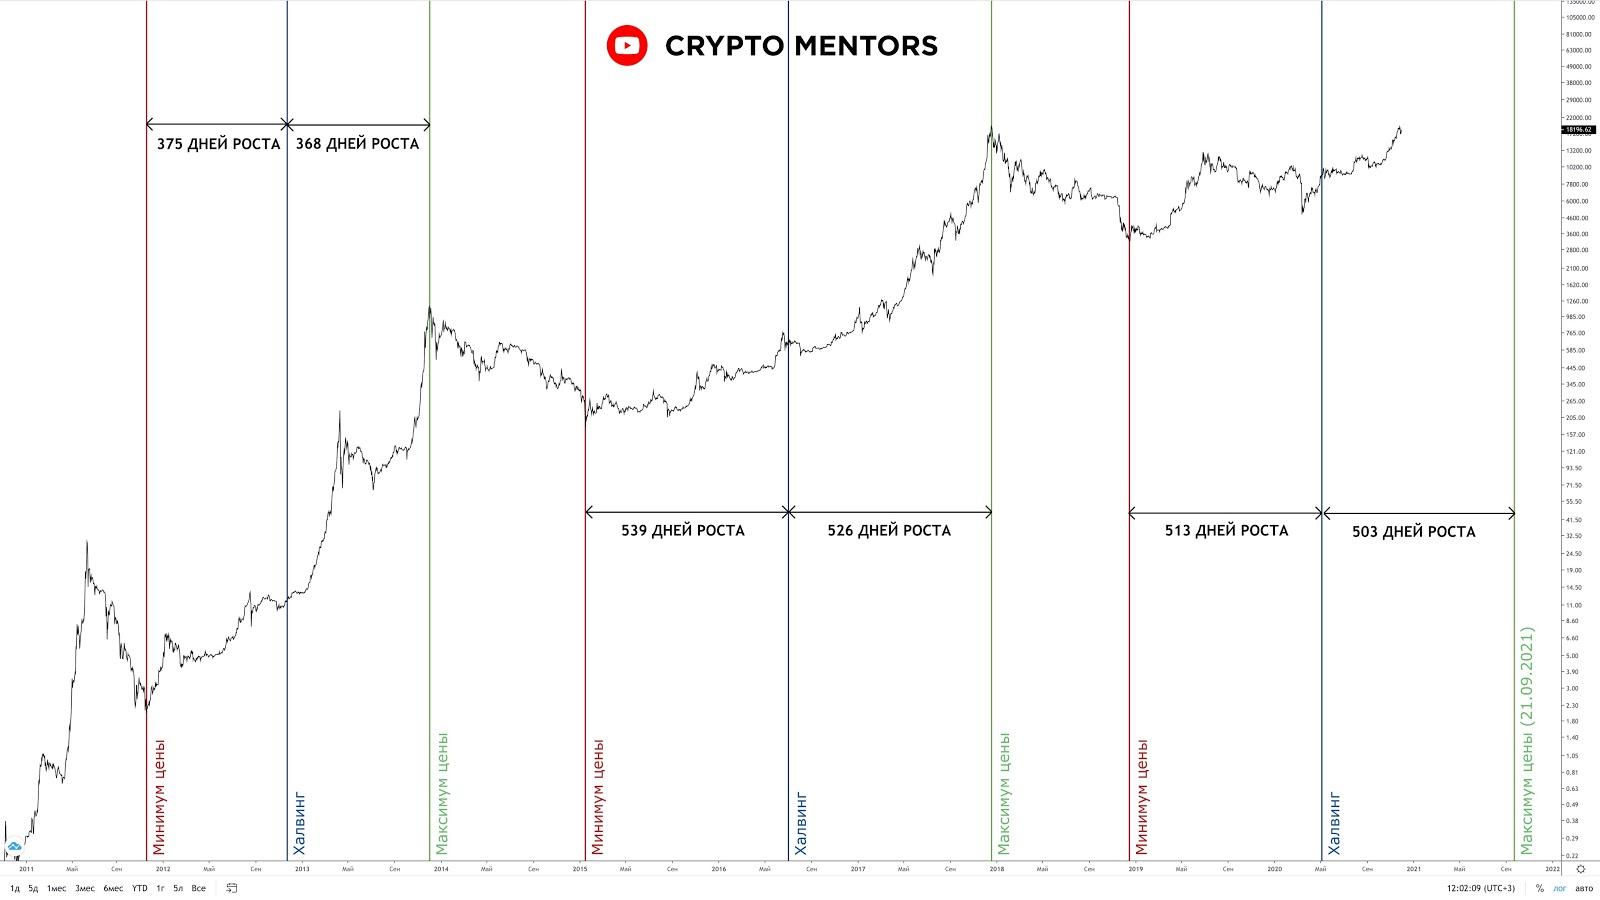
History on charts tends to repeat itself. A scenario played out in the past does not guarantee an exact repetition, but it increases the likelihood of events unfolding in a similar fashion.
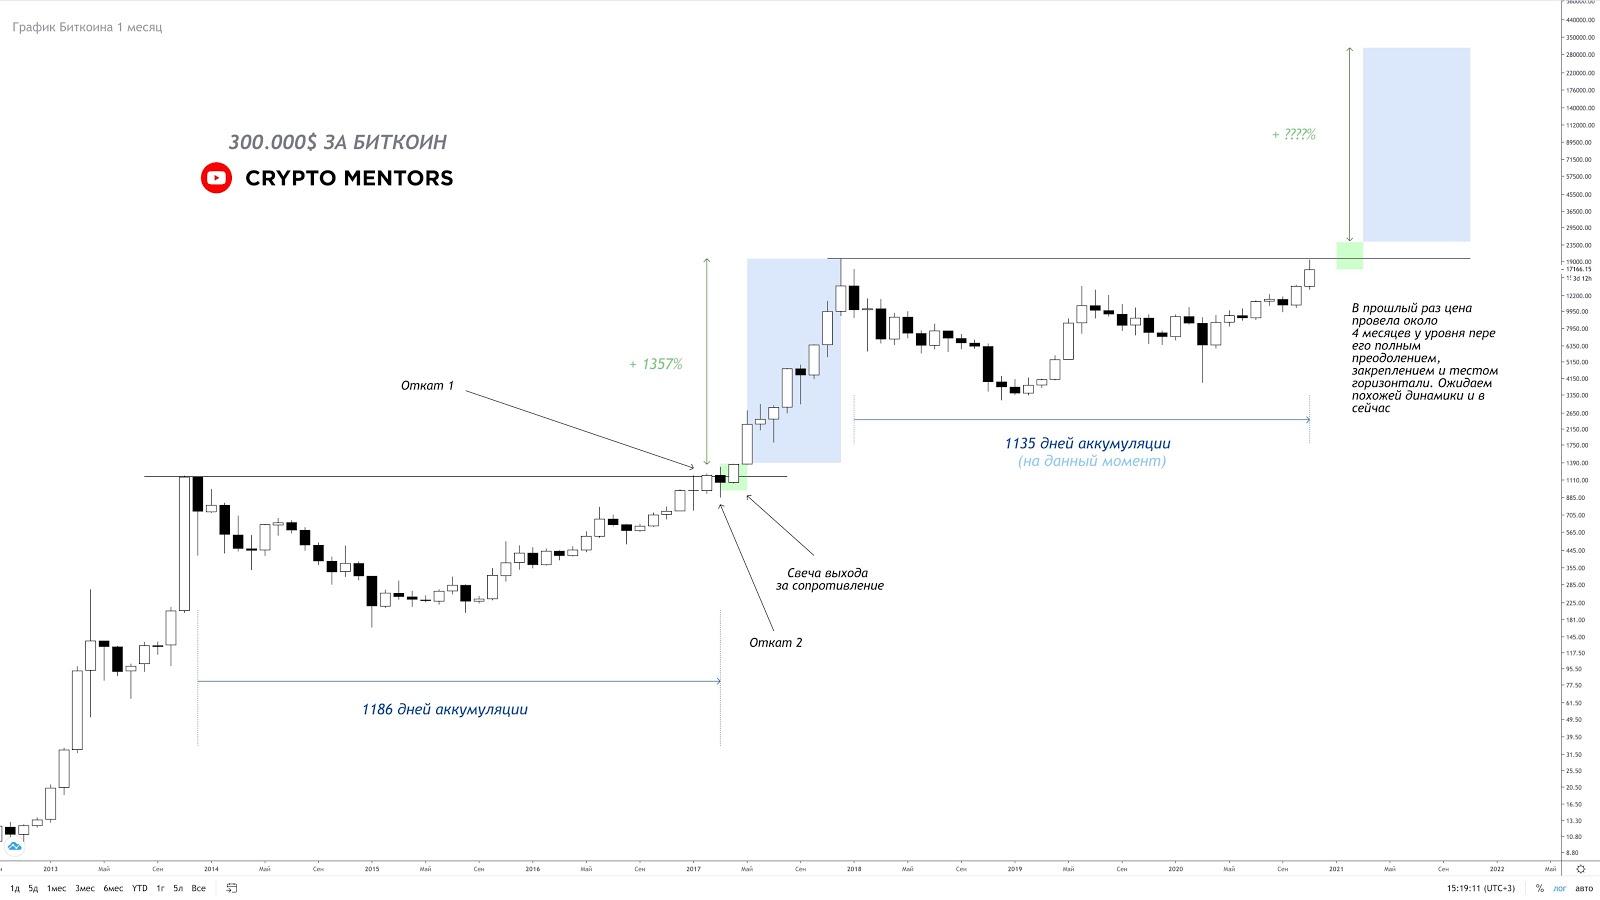
A high may be reached by September 2021. It could reach $300,000, based on historical data.
The traders’ task is to trade the real picture on the chart and the facts. Such fractals should be taken into account, but not used to shape one’s trading strategy.
In Price Action there is a concept of ‘price projection’. It implies that the size of the current wave (without signs of its fade) will be similar to the size of the previous wave. This means one can anticipate a substantial price rise by referring to historical data.


Pobar Analysis
The spread of the past week is small in size, although by the matrix it sits in the mid-range. All selling efforts in this wave are insignificant. Volume is rising toward the level and, by the matrix, is large, though in combination with the previous approach — very weak (186k vs 71k). Progress from the horizontal is weak.
There is no correlation between spread and volume; an ascending bar can be expected. The candlestick chart has formed an ‘umbrella’ pattern, with similar expectations.
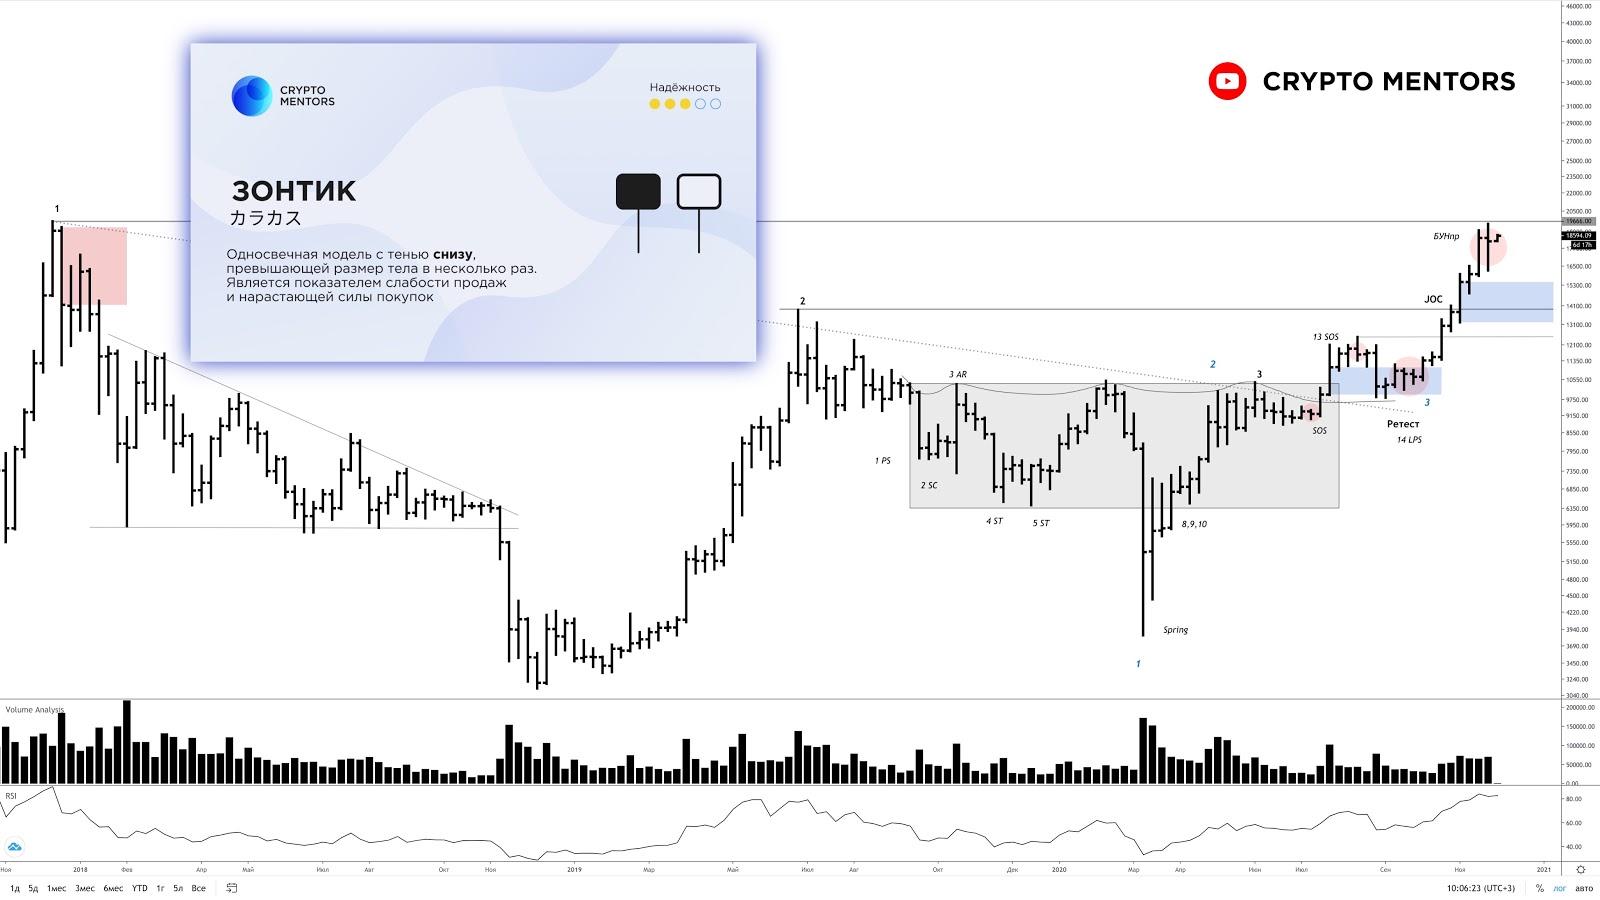
Similar squeezes to the current one are commonplace not only in crypto markets but also in traditional ones. ‘BUN’ is precisely the term for this selling inefficiency in the VSA analysis method. It is often seen in American stocks even at the top tier.
A compression toward the historical maximum is forming, with the formation of a liquidity pool in the EQH format and a deliberate false move below. There is a fairly high probability of breaking the $20,000 level with subsequent consolidation and a move lower. There are no bear initiatives, as there is no renewed selling pressure at the Creek level.
Pobar Analysis of horizontal volumes and deltas
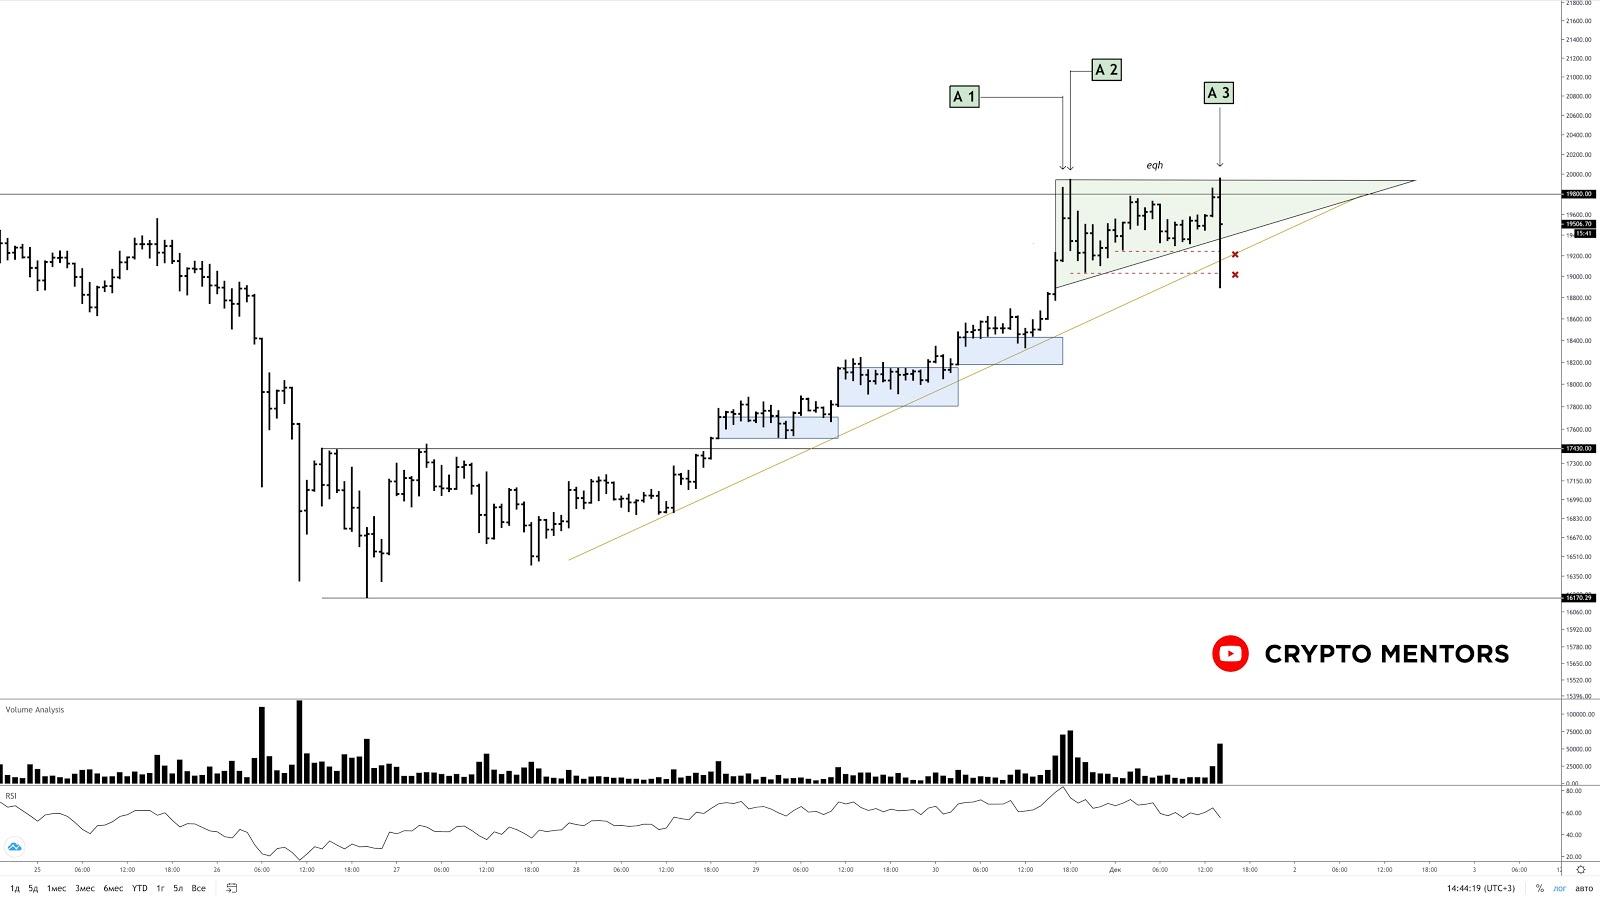
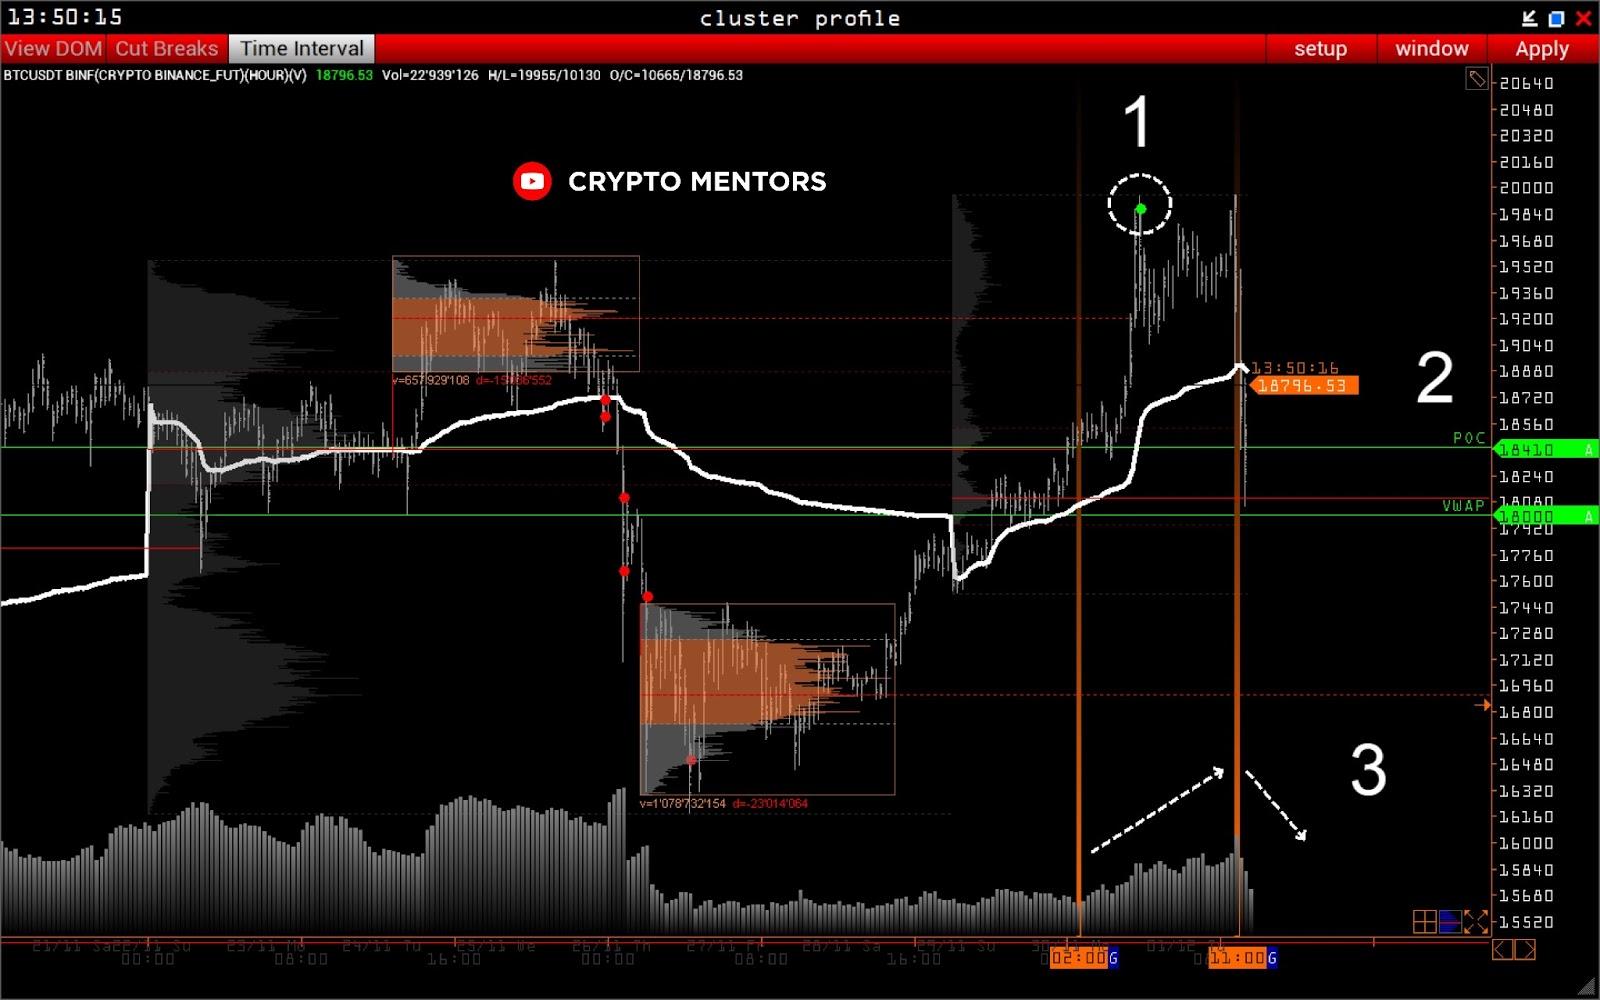
Let us examine the situation locally. The attempt to breach the ATH was accompanied by inefficiency and the withholding of limit orders, after which we did not breach the zero point [1]. This is a serious resistance.
The current squeeze was triggered, as usual, by a lack of liquidity and some holders’ desire to finally exit their positions at break-even dating back to 2017. Nevertheless, the price fell to very important supports in the form of a volume array, POC. Given the current reaction, the probability of breaking these levels is low. It is important to watch the 18,000 level [2].
OI helps us determine that, again on this drop, many closed their positions en masse, rather than flipping into shorts. The situation is likely to be similar to what was observed on November 27 [3].


One can expect a local high update in December if the market provides no new information.
Subscribe to ForkLog news on Telegram: ForkLog FEED — the full feed of news, ForkLog — the most important news and polls.