


Views of BTC/USD chart on the TradingView platform in November reached 3.4 million. This is about half the levels seen at the peak of the 2017 bull market. Similar data were provided to CoinDesk
Compared with October, the figure rose 82%. A similar pattern was observed for other cryptocurrencies. The price of Bitcoin over this period rose 42%, and year-to-date — 152%.


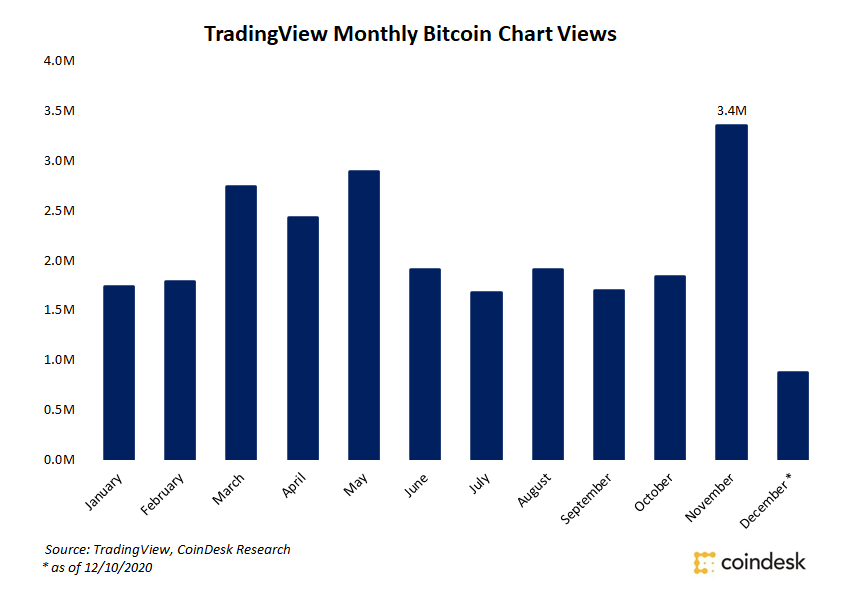
Data: TradingView, CoinDesk Research.
“BTC/USD remains the most frequently viewed trading instrument this year,” commented David Bell, TradingView’s Director of Growth in the United Kingdom.
Earlier, Chainalysis noted that the new 2020 records in the Bitcoin market were the result of the ‘insatiable appetite’ of institutional investors. In 2017 the market was driven higher by retail investor money, according to analysts.
Nick Carter, co-founder of Coin Metrics, explained that the strong price rise of the leading cryptocurrency in November was due to fiat-currency inflation and the development of institutional infrastructure.
For other fundamental shifts in the Bitcoin market, read in our article.
Subscribe to ForkLog news on Facebook!