


Key points
- The moving average (MA) is a technical indicator based on the average price over a chosen time frame. As a trend-following tool, it smooths volatility and helps identify the direction of travel.
- MAs can be applied not only to price but to any series: trading volume, readings of other indicators, statistics, currencies, commodities and other instruments.
- Crypto analysts often watch the 50-day and 200-day moving averages.
What types of moving averages are there?
The MA is one of the simplest—and therefore most popular—indicators for technical analysis. Different variants are used depending on objectives and trading style:
- The simple moving average (SMA) is the arithmetic mean of individual periods (minutes, hours, days, etc.) over a chosen window. For example, to calculate a 100‑SMA on an hourly chart, the indicator sums the past 100 hourly prices and divides by 100. For a 20‑SMA, it sums the past 20 values and divides by 20.
- The exponential moving average (EMA) is more sensitive to price changes. It is calculated like the SMA but gives greater weight to recent data rather than the “tail” of the window. EMAs are used to assess the leading edge of the curve by prioritising fresh information.
- The smoothed moving average (SMMA) assigns more weight to the tail of the calculation window and much less to recent values. As a result, the SMMA is less sensitive to impulses and smooths the front of the curve, emphasising the broader trend.
- The linear weighted moving average (LWMA) prioritises the most recent periods and linearly reduces the importance of data toward the tail. LWMAs are more sensitive to fresh data than EMAs.
How to use a moving average?
All moving averages have adjustable parameters and are tuned to a given strategy, time frame, instrument and market conditions. Even with identical lengths, each type of MA behaves differently.
As shown in the chart, the SMA, EMA and SMMA all use a 200‑day length yet behave differently.


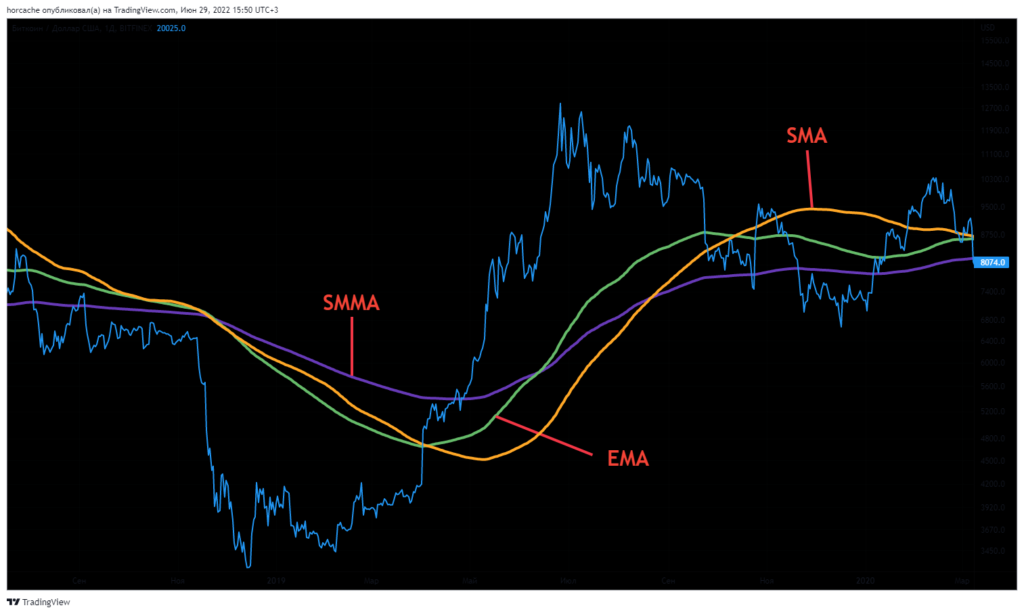
Besides gauging the broader trend, traders use the MA indicator to infer potential support and resistance. Crossovers between moving averages can also signal the strength or continuation of a trend.
For example, price below the 200‑day MA may indicate a strong bear trend; below the 50‑day MA, a short‑term downtrend. When an asset trades above both the 200‑day and the 50‑day MAs, the trend is commonly viewed as strongly bullish.
Which MAs are used in the crypto market?
For long‑term trends, the 50, 100, 150, 200 and 250‑day periods are most common. For short‑term moves, 5, 10, 20 and 50 days are typical.
These periods mirror the number of trading days on exchanges, excluding weekends and holidays. Thus, a 50‑day MA corresponds to roughly ten trading weeks, while a 200‑day MA covers about 40 weeks. A 5‑day period represents one trading week.
Although crypto trades around the clock, analysis of digital assets has borrowed tools from traditional markets. Hence traders in crypto also use 50, 100, 150, 200 and 250‑day periods.
The 50‑ and 200‑day moving averages are the most widely watched in crypto.
What are the golden cross and the death cross?
Traders often refer to the “golden cross” and the “death cross” — two of the most common moving‑average crossover patterns.
The golden cross occurs when the short‑term (50‑day) MA crosses above the long‑term (200‑day) MA, a formation widely seen as bullish.
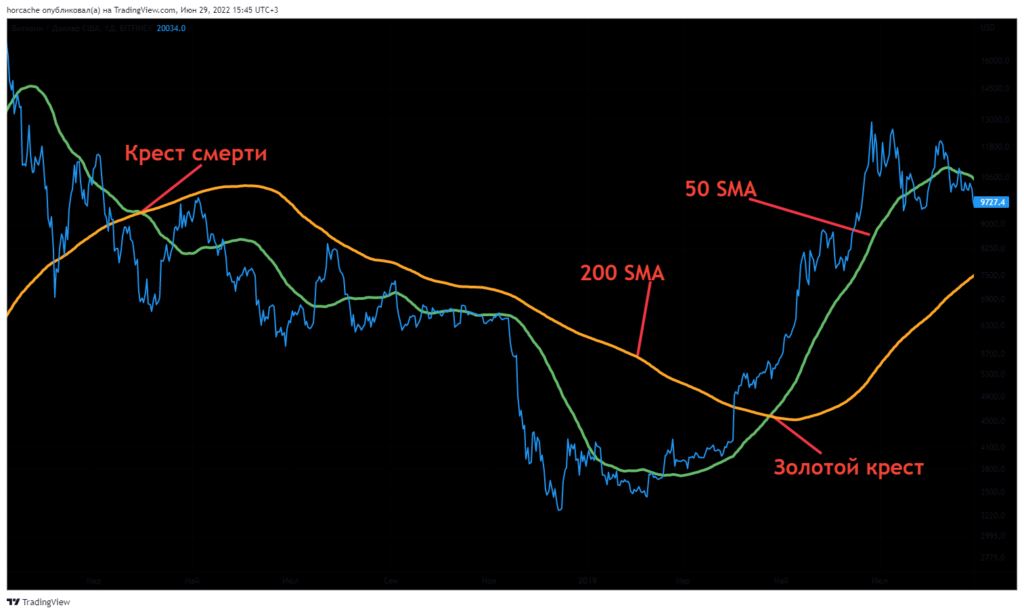
The death cross is the bearish counterpart: the short‑term (50‑day) MA crosses below the long‑term (200‑day) MA.
Popularity and wide use offer no guarantees of success. Weigh risks and prospects alongside many other factors.
What are the advantages and drawbacks of moving averages?
On the plus side, MAs make it easier to identify short‑ and long‑term trends. By smoothing price volatility, they make the direction of travel clearer.
They are also easy to set up and use, and the output is visually intuitive.
But, like any indicator, MAs have downsides:
- Lagging by design. Moving averages trail both rallies and sell‑offs. In sharp moves, the gap with the current price can be large; by the time the MA reacts, the trend may already be reversing.
- Trend only. In a sideways market, an MA can be misleading and show no clear direction.
- False signals. High volatility can generate many false buy or sell signals. Trading above or below an MA does not guarantee similar behaviour in future.