

What is on-chain analysis and how to use it?

Key points
- On-chain analysis is a crypto-specific methodology that seeks to explain investor behaviour and forecast price movements using blockchain data.
- It uses a range of metrics drawn from a cryptocurrency’s network: the total number and growth rate of addresses, changes in exchange balances, the share of short- and long-term holders, and more.
- Its instruments are indicators that link changes in individual blockchain metrics with a crypto-asset’s price.
Why use on-chain analysis?
On-chain analysis is a relatively young discipline which, unlike technical or fundamental analysis, lacks a long history and a firm theoretical base, yet is developing rapidly.
Researchers who apply on-chain analysis use a set of basic metrics tied to addresses and holders, transactions and network fees.
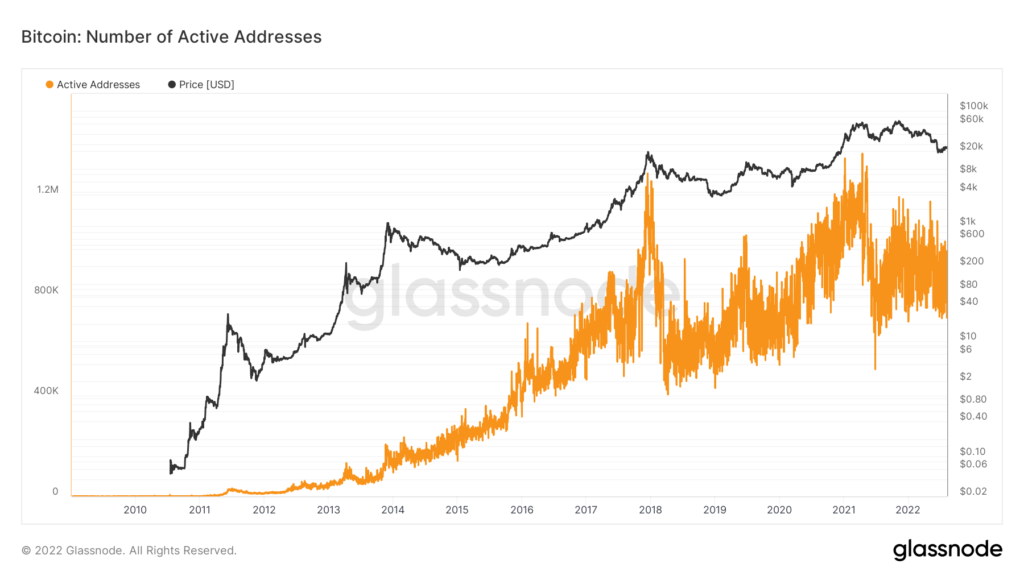
One popular metric is the number of active users, meaning those who have made at least one transfer over a given period. If a cryptocurrency shows a rise in active addresses and transactions, it may signal that its price is about to climb.
The blockchain can display other signs of the trend. For example, a rising share of long-term investors among all holders — those who have not moved their funds for an extended period — indicates bullish sentiment.
Where and how is on-chain analysis used?
With on-chain analysis, a trader or investor can not only refine a trading strategy but also better gauge likely near-term market moves.
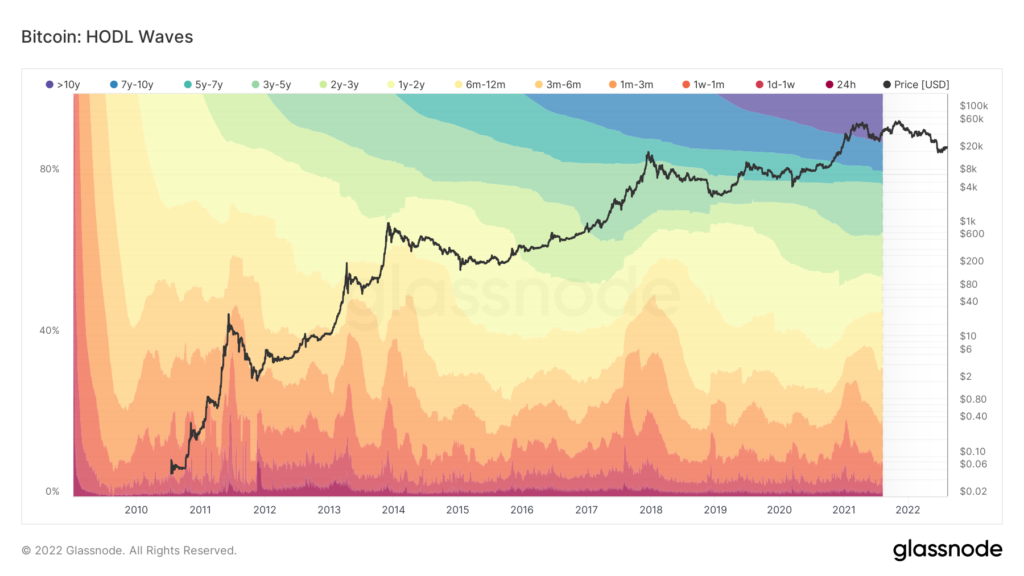
One basic on-chain indicator is the so-called HODL Waves: addresses on a cryptocurrency’s network are split into several groups by activity, and changes in each group’s share are shown over time. HODL Waves help reveal whether traders are betting on a price rise or selling in anticipation of a fall.
Experts caution against drawing conclusions solely from on-chain metrics or indicators: you must also understand the context of the specific crypto-asset. For example, a high share of long-term holders may be explained by vesting terms for large investors rather than expectations about the market.
Another popular on-chain metric is holder concentration — it shows the percentage of the largest addresses in the coin’s circulating supply. This helps identify the dominance of “whales”.
Many analysts track the activity of large holders of a given cryptocurrency; depending on the context, their actions can serve as an additional argument for a particular market view. Large transactions, in particular, are tracked and published on Twitter by Whale Alert.
Key on-chain indicators
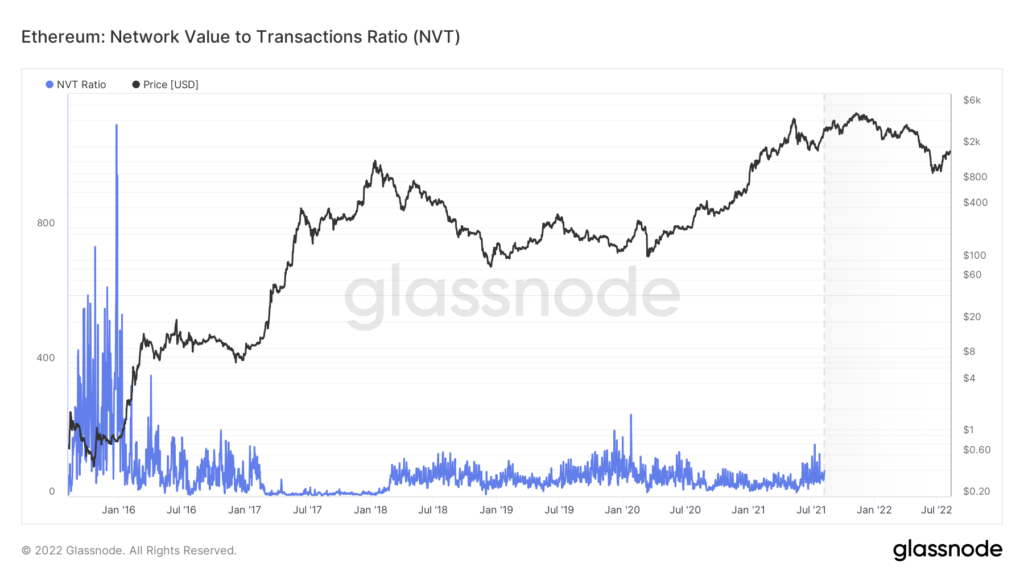
1. NVT Ratio — the ratio of market capitalisation to transaction volume in US dollars. A high NVT Ratio suggests the coin is “overbought”.
2. MVRV Ratio — the ratio of current capitalisation to realised capitalisation. It shows whether the asset’s price is below or above the “fair” level.
3. Number of active addresses — indicates demand and the extent to which the cryptocurrency is used.
4. Bitcoin inflows to exchanges — reflect the intentions of large investors. Rising exchange balances point to bearish dominance; falling balances to bullish sentiment.
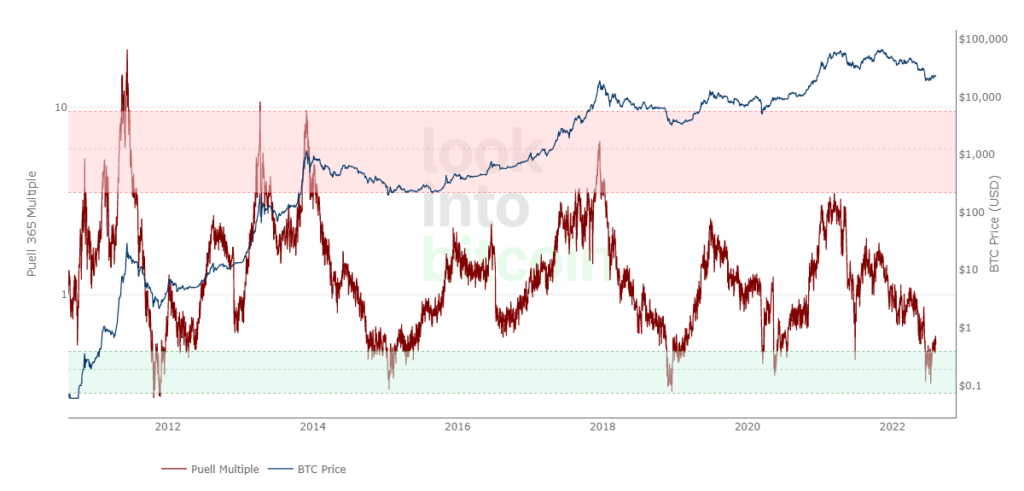
5. The Puell Multiple — the ratio of the dollar value of bitcoin mined in a day to its 365-day moving average. Used to identify optimal buy and sell points for bitcoin.
How does on-chain analysis help fight financial crime?
Beyond trading and investing, on-chain analysis is also used for anti-money-laundering (AML) compliance, including the detection of stolen cryptocurrencies.
Any company or application that uses blockchain addresses to receive payments — for example, cryptocurrency exchanges — must screen incoming user transactions for “tainted” funds. Such services are provided by specialised firms, for example Chainalysis or Crystal.
These programmes automatically check all incoming transfers and, thanks to the transparency of blockchain data, identify those linked to crimes. Know-your-customer (KYC) and customer due diligence/enhanced due diligence (CDD/EDD) procedures make it possible to identify criminals and associated parties.
Which services offer on-chain analytics?
Several popular platforms now provide on-chain analysis tools, including APIs and blockchain data visualisation:
- Nansen. Focused on analysing the Ethereum blockchain. Publishes its own research on the crypto market.
- Dune Analytics. A platform for creating customised dashboards that visualise various on-chain metrics. It fosters a community whose members share their observations.
- Glassnode. Another popular service with free access to standard charts.
Further reading
Рассылки ForkLog: держите руку на пульсе биткоин-индустрии!