

What is the Hash Ribbons indicator?
Key points
- Hash Ribbons is an indicator designed to identify bitcoin’s major price bottoms.
- The metric gauges market sentiment and the likelihood of miner capitulation driven by a falling bitcoin price or rising operating costs.
- It rests on the premise that miners are both the most resilient cohort in downturns and the most sensitive to market recoveries.
Who created Hash Ribbons?
Hash Ribbons was developed in 2019 by Charles Edwards, founder of the investment firm Capriole Investments. It followed his earlier work on identifying bitcoin price bottoms using the network hash rate (Hash Rate Capitulation).
Edwards drew on the work of analyst Willy Woo, who proposed the Difficulty Ribbon Compression indicator based on the “Difficulty Ribbon”. He later combined both approaches into a single concept.
What is miner capitulation?
In the context of Hash Ribbons, miner capitulation is the moment when equipment servicing and electricity costs over one to two months exceed the value of the coins mined.
Using bitcoin’s hash rate, Hash Ribbons signals presumed miner capitulation. Put differently, it points to a material share of mining hardware being switched off.
Rationale behind Hash Ribbons
Edwards posited that bitcoin’s price and mining costs are inextricably linked to hash rate. The lower the price and the higher the costs, the fewer miners remain in the network. Conversely, higher prices and lower costs attract more participation.
Because Hash Ribbons relies on smoothed hash rate data, the indicator suits the analysis of long-term trends and identifying market entry points.
Its lagging nature makes it ill-suited to timing exits or pinpointing favourable selling opportunities.
How to use Hash Ribbons?
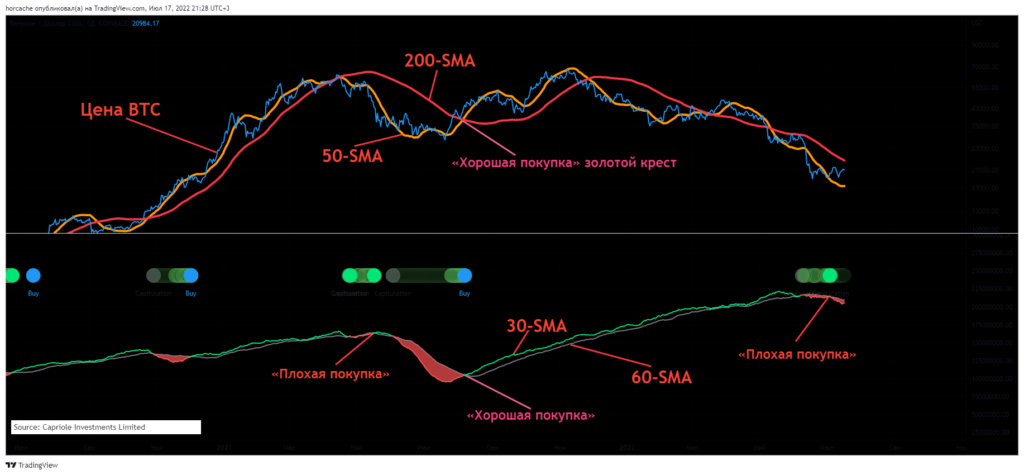
The Hash Ribbons chart is built from two simple moving averages (SMA) of bitcoin’s daily hash rate with 30- and 60-day periods. When the 30-SMA crosses below the 60-SMA, it indicates the start of miner capitulation. A cross back above is a buy signal.
According to Edwards, in 2015 the Hash Ribbons indicator signalled a “bad” entry—bitcoin’s price fell by 42%. Similar patterns occurred in 2019, 2021 and 2022.
In Edwards’ view, such “bad trades” can be avoided by adding 50-SMA and 200-SMA for bitcoin’s price. Using both tools together can help reduce risk.
Risks of using the indicator
Popularity and a historically positive return profile for Hash Ribbons-based strategies do not guarantee future performance. Consider the following risks.
Hash rate
Hash rate is the sole input for the metric. Unlike mining difficulty, the network’s computational power is an estimate and highly volatile. Inaccurate data can lead to faulty conclusions.
Market volatility
According to Edwards’ statistics, after a buy signal bitcoin’s price can fall by 3% to 42%. Future drawdowns could be larger, so volatility risk must be considered.
Regulation
China’s mining ban demonstrated that regulation affects bitcoin’s hash rate. Local or global government restrictions can disrupt industry participants in specific jurisdictions, lowering network hash rate and distorting the logic embedded in Hash Ribbons.
Technological risks
The rollout of more efficient mining hardware, performance gains in older rigs and new cheap energy sources complicate analysis of hash rate distribution worldwide.
New technologies can displace old ones without reducing aggregate network hash rate. Inefficient miners may exit while the cost of production falls. Miner capitulation can thus occur, yet Hash Ribbons may not detect it.
Further reading
What is a moving average and how is it used for cryptocurrencies?
What is dollar-cost averaging?
Рассылки ForkLog: держите руку на пульсе биткоин-индустрии!