


Key points
- The Relative Strength Index (RSI) is a technical-analysis tool that measures the speed and magnitude of an asset’s price moves, including cryptocurrencies.
- RSI’s main purpose is to gauge momentum and help identify whether an asset is overbought or oversold.
- RSI appears on charts as an oscillator ranging from 0 to 100. Conventionally, readings above 70 indicate overbought conditions, and below 30 oversold.
Who created the RSI
The RSI was devised by American mechanical engineer and technical analyst Welles Wilder, who first presented it in his 1978 book, “New Concepts in Technical Trading Systems”.
Wilder is a recognised specialist and innovator in price analysis and forecasting. He also created other popular tools, including the Average Directional Movement Index (ADX), Average True Range (ATR) and Parabolic SAR.
RSI calculation and settings
The RSI “weighs” the strength of upward and downward price moves. It is computed as follows:
RSI = 100 — 100 / (1+RS)
RS is the exponential average of the price when the asset rose over the period under review, divided by the exponential average of the price when the asset fell over the same period.
Most modern trading services and exchanges have a built-in RSI with precise customisation for traders’ needs. Many use the default 14-day period. Depending on preference, other common choices include:
- for intraday trading, a 7–11 day time frame;
- traders operating on a medium-term horizon apply a 14-day period;
- for long-term trading, a 21–30 day period.
Initially used on the stock market, it is now applied to cryptocurrencies too, including analysis of bitcoin and other crypto-asset instruments.
Using the RSI
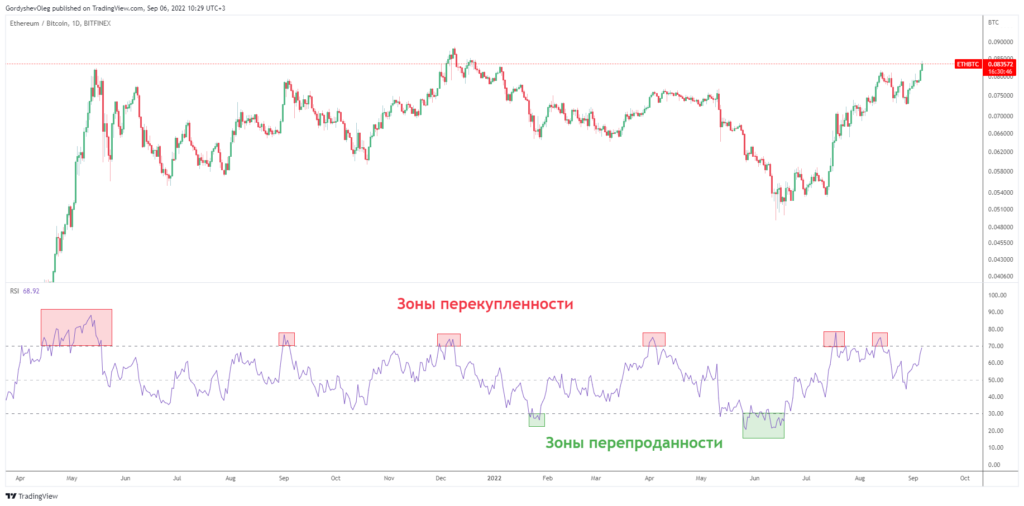
As an oscillator, the RSI lends itself to drawing chart patterns, support and resistance levels, and to spotting overbought or oversold conditions.


When the RSI rises, bullish momentum outweighs bearish momentum—typically read as a sign of a bull trend. When the RSI falls, bearish sentiment is assumed to dominate.
The RSI ranges from 0 to 100. Readings above 70 are commonly taken as overbought; below 30 as oversold. In intraday trading the RSI is more sensitive to price changes, so traders often widen the bands to above 80 and below 20.
What is divergence
The RSI is often used to analyse and identify trend reversals. When price and RSI move in opposite directions, the situation is called divergence.
A bearish divergence forms when an asset’s price sets a new local high while the RSI peaks below its previous local high. Price is trending up; the RSI is trending down. Markets read this as a potential turn to a downtrend and fading upside momentum.


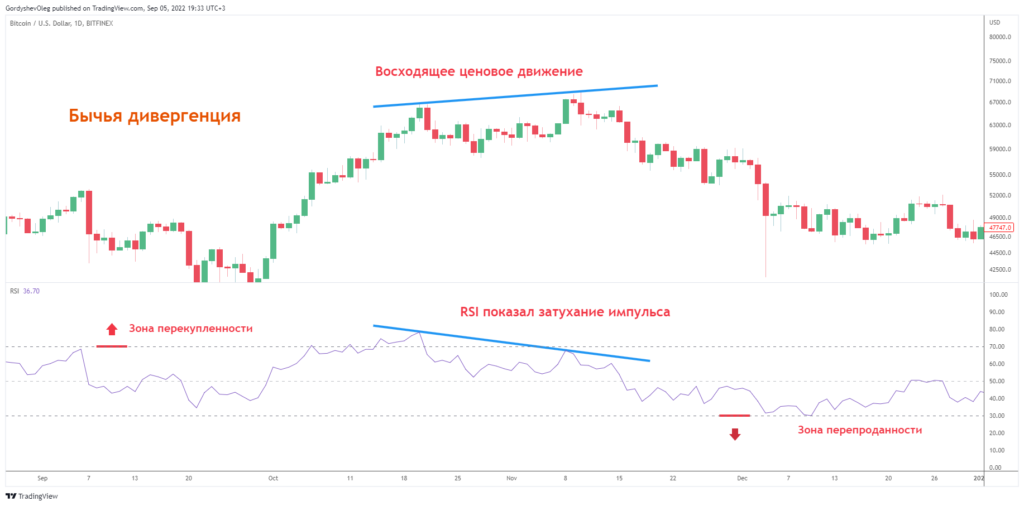
Conversely, a bullish divergence means the asset’s price is trending down while the RSI is rising. Markets read this as a possible shift to an uptrend and a waning of downside momentum.
Pros and cons of the RSI
The RSI is popular for its simple calculation and straightforward interpretation. It has become a go-to tool for analysing longer-term crypto price moves: the higher the averaging period, the fewer false signals the indicator tends to produce.
The indicator is used not only to find “good” entry and exit points; it also helps avoid trading situations such as bull and bear traps.
Despite these advantages, the RSI has well-known drawbacks. Chief among them is its lagging nature: by the time the reading appears on the chart, market conditions may already have changed. Like any other technical-analysis tool, the RSI is best used alongside other methods.