Key highlights
- Bitcoin and Ethereum updated all-time highs. Total market capitalisation exceeded $3 trillion.
- In the United States, Bitcoin-based futures ETFs were launched.
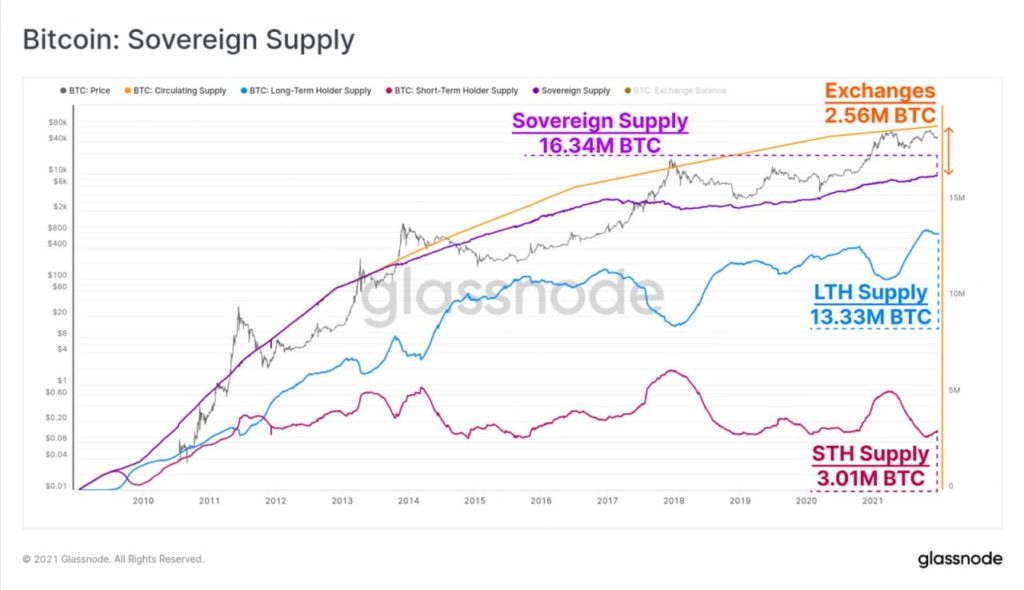
- Long‑term investors increased Bitcoin reserves.
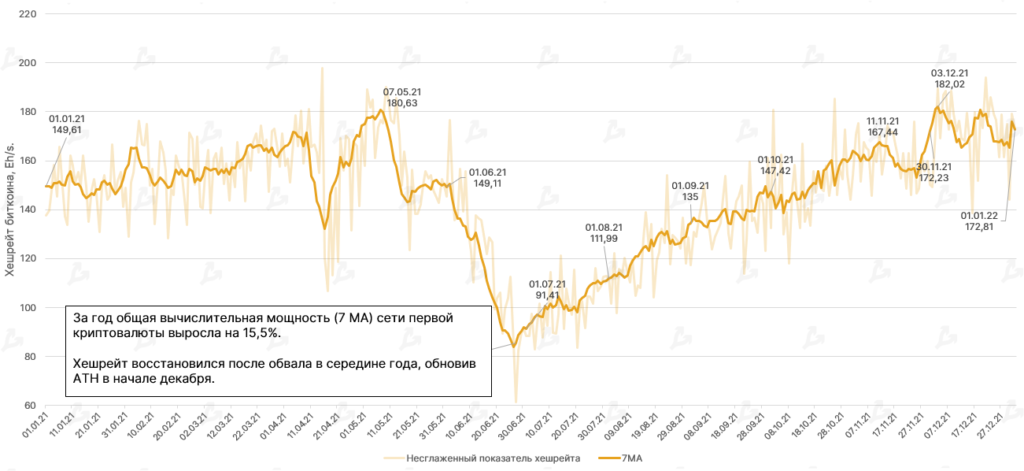
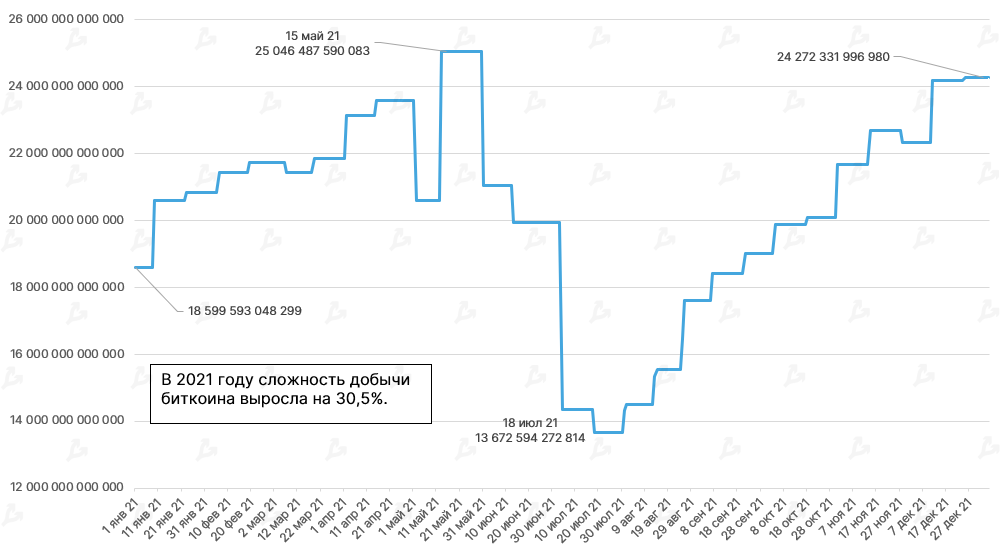
- Bitcoin hash rate fully recovered after the drop caused by the migration of miners from China.
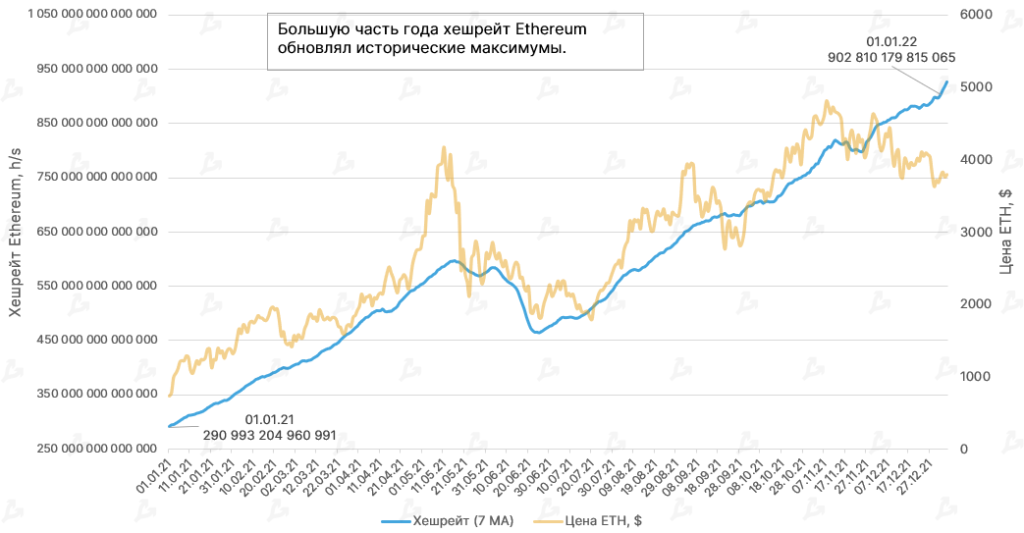
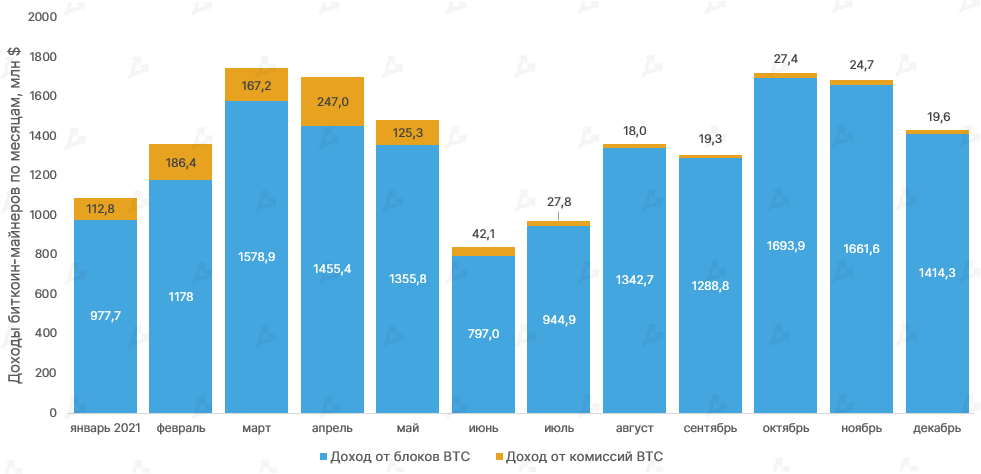
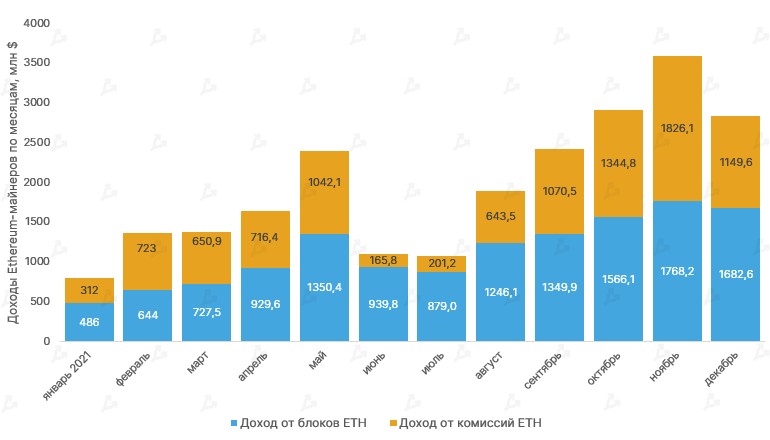
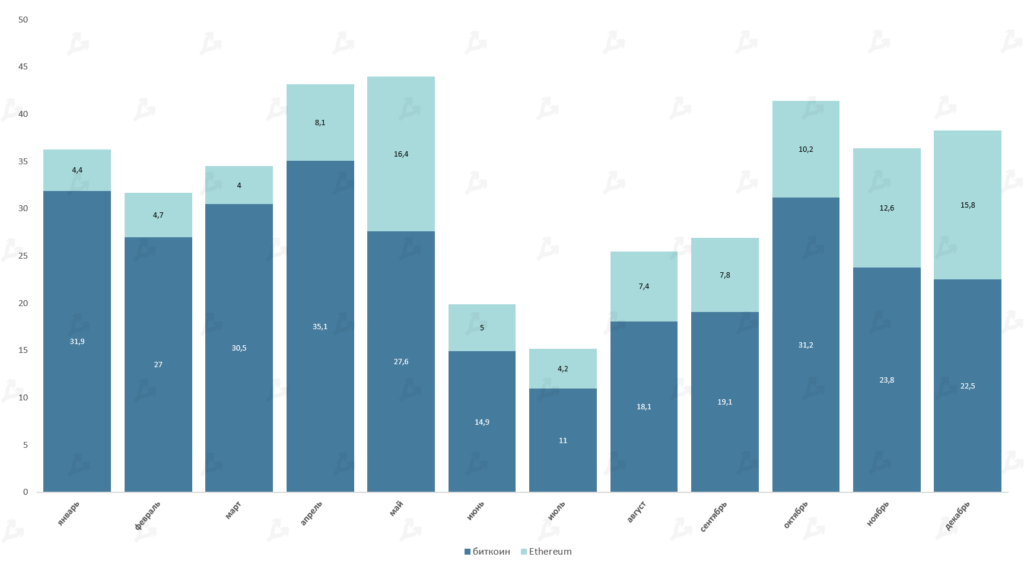
- Ethereum miners’ revenues surpassed Bitcoin miners by 40%.
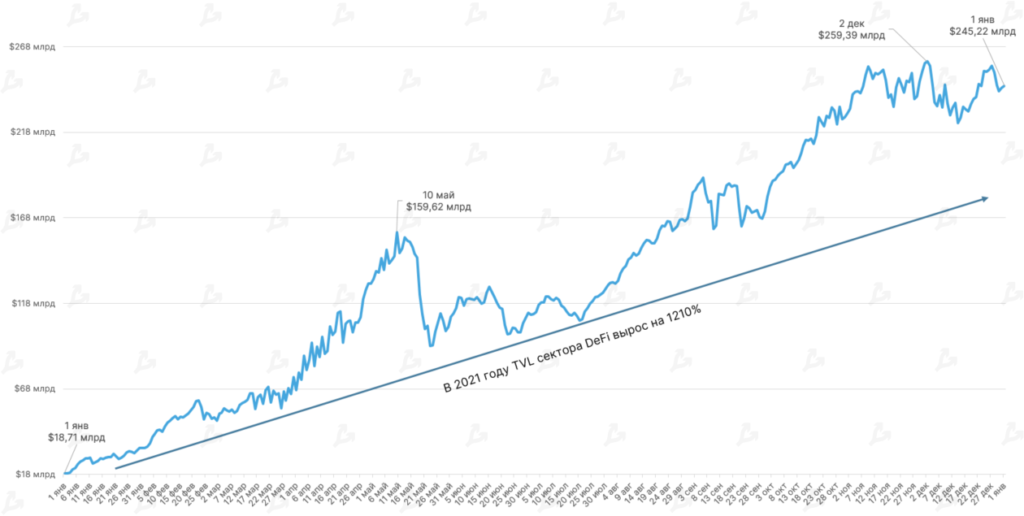
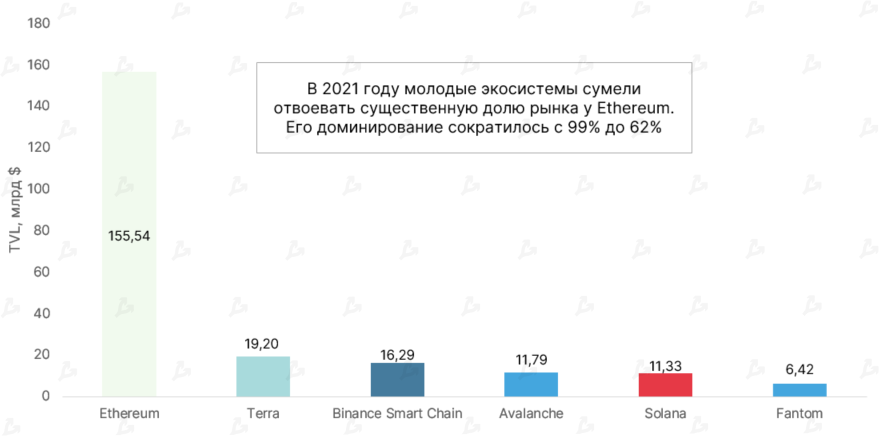
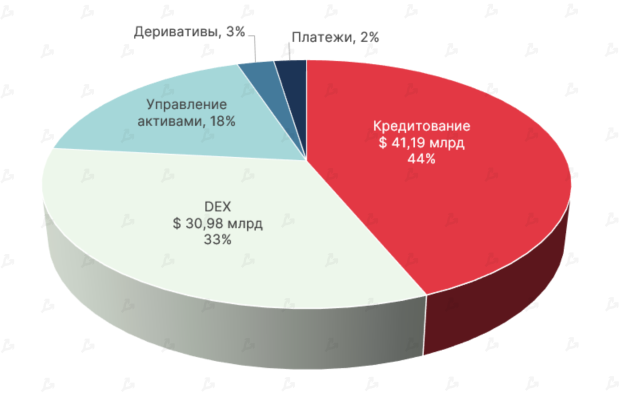
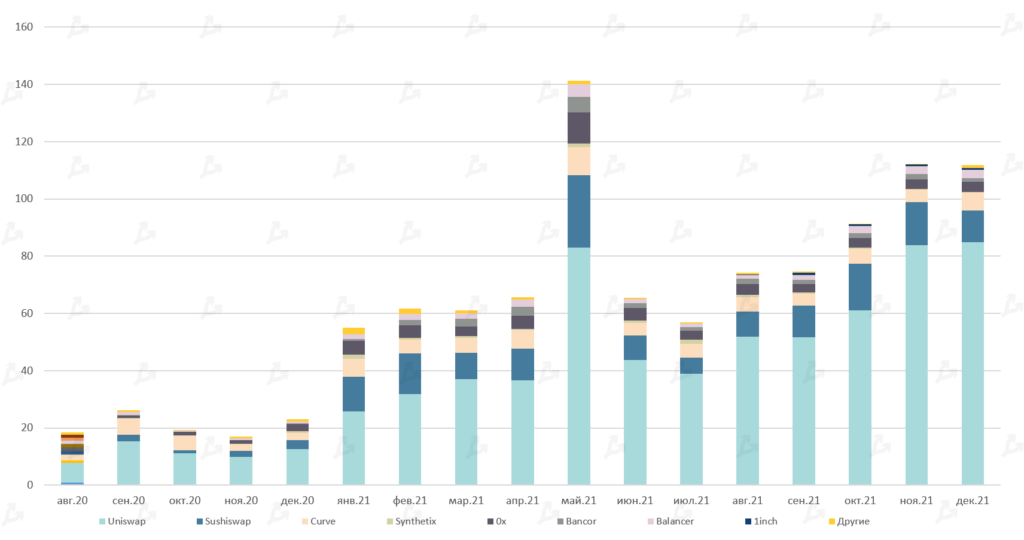
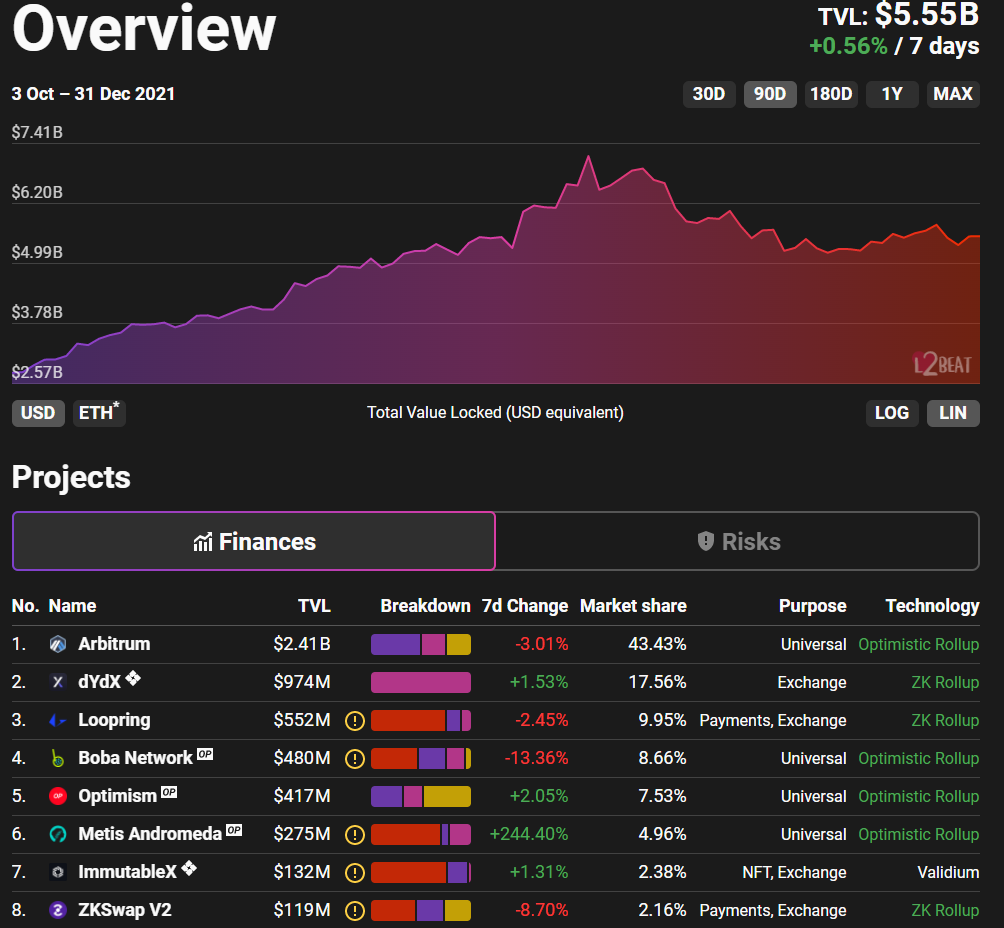
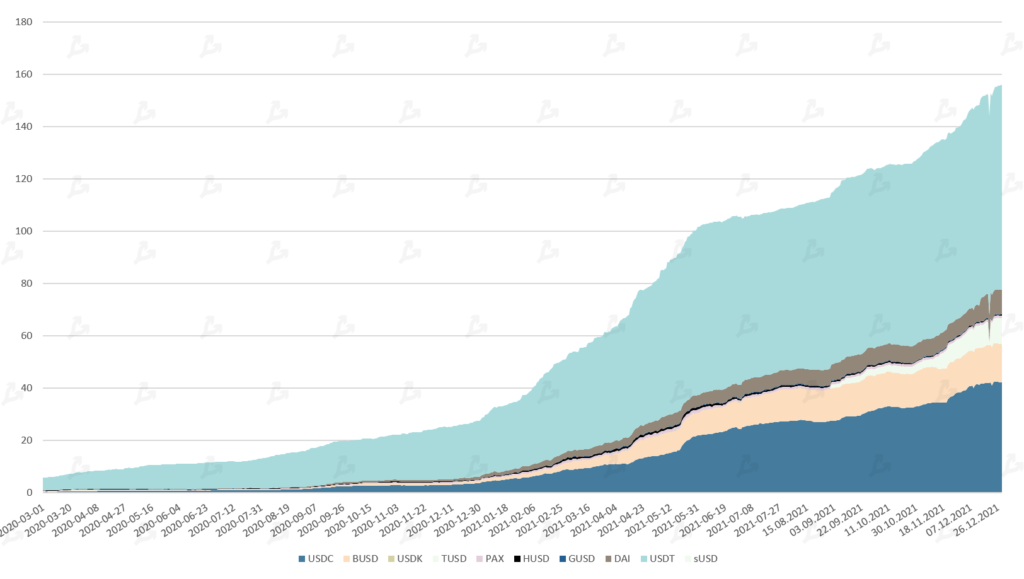
- Alternative L1 networks strengthened their positions. Liquidity in the DeFi sector rose 13-fold, to $245 billion.
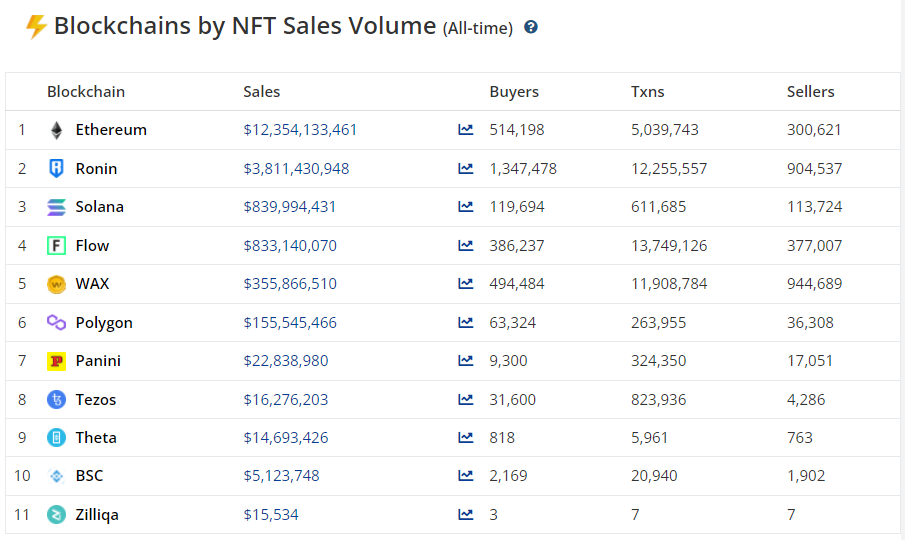
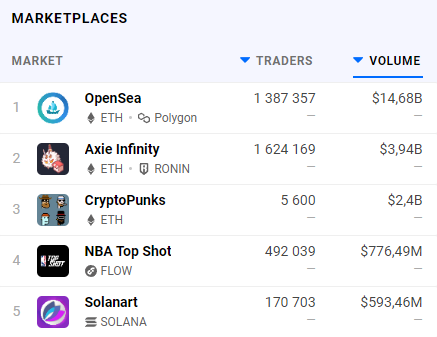
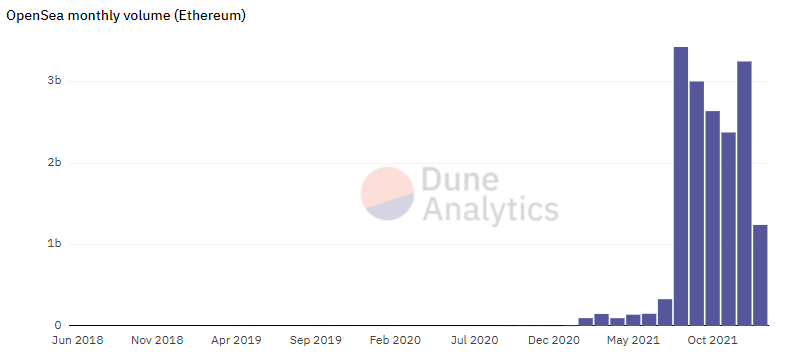
- OpenSea’s share of total NFT trading volume exceeded 90%.
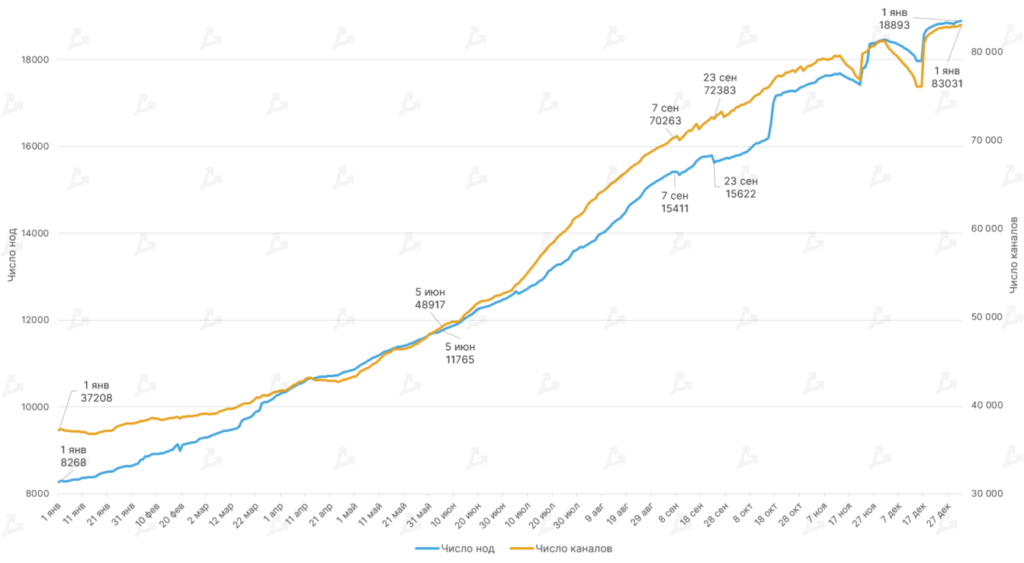
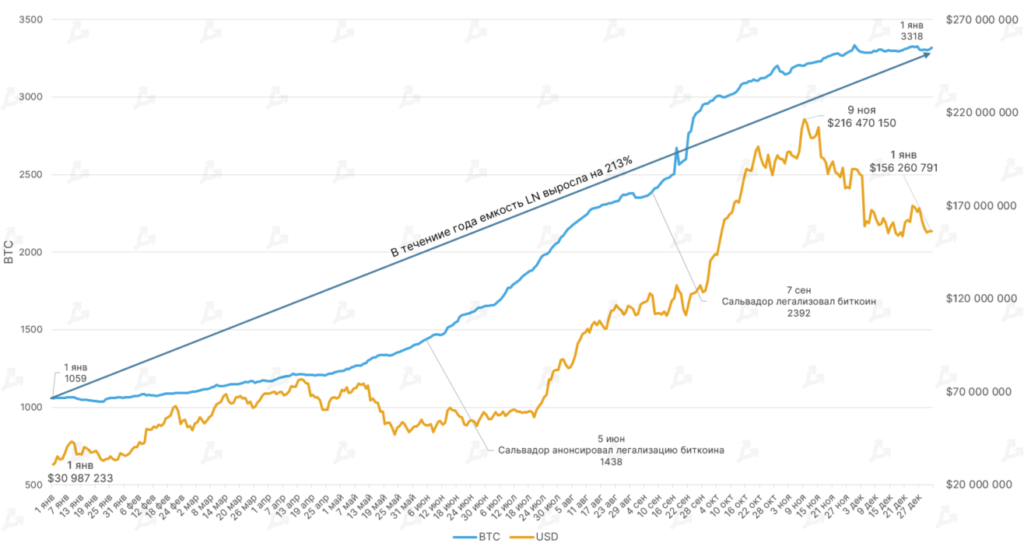
- With Bitcoin legalised in El Salvador, the capacity of the Lightning Network grew threefold.
- Venture investors poured more than $32 billion into the blockchain ecosystem.
Dynamics of leading assets


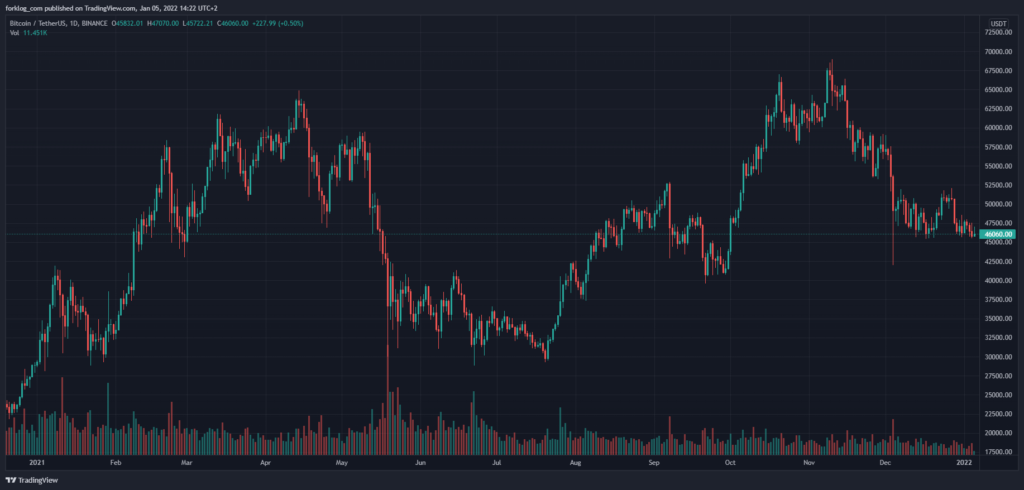


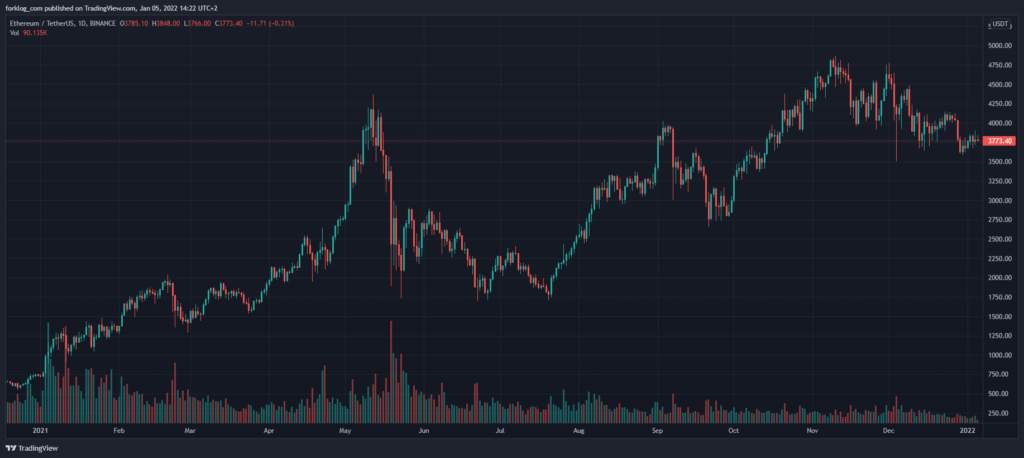
- On November 10, 2021, Bitcoin and Ethereum updated all-time highs at $69,000 and $4,868 respectively.
- The cryptocurrency market capitalisation at its peak surpassed $3 trillion.


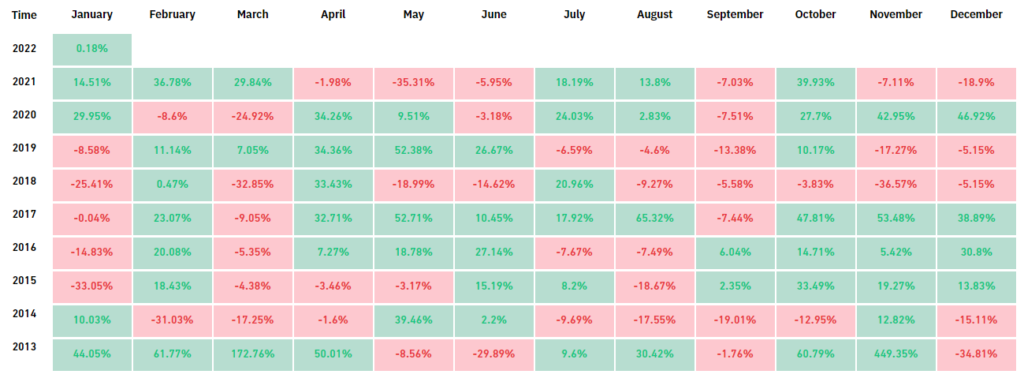
- Bitcoin’s year‑long performance resembled 2013 when the uptrend was only briefly interrupted by short corrections.
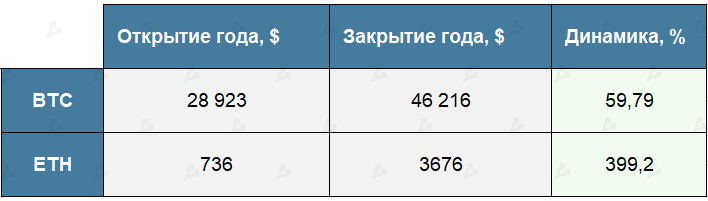
- Bitcoin annual return was nearly 60%, Ethereum about 400%.


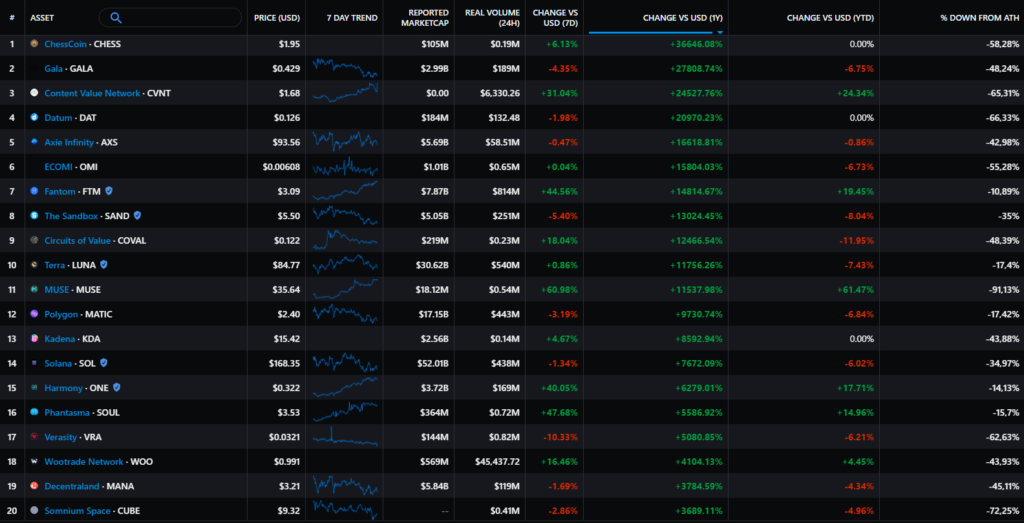
Gala (GALA):
+27 808%
Axie Infinity (AXS):
+16 618%
Fantom (FTM):
+14 814%
The Sandbox (SAND):
+13 024%
Terra (LUNA):
+11 756%
Polygon (MATIC):
+9730%
Solana (SOL):
+7672%
Harmony (ONE):
+6279%
Decentraland (MANA):
+3784%
Crypto-linked equities in 2021
MicroStrategy (MSTR):
+40,13%
Coinbase (COIN):
+0,95%(listing occurred on 14 April at a reference price of $250)
Bakkt (BKKT):
-14,9%(listing occurred on 18 October; reference price — $10)
Galaxy Digital (GLXY):
+107,8%
Mining-equipment stocks in 2021
Canaan (CAN):
-13,15%
Ebang International (EBON):
-83%
Riot Blockchain (RIOT):
+31,43%
Hut 8 (HUT):
+185,45%
Marathon Digital (MARA):
+214,75%
The performance of crypto-related equities generally remained robust through 2021. Some failed to hold gains and corrected by year-end as crypto markets did.
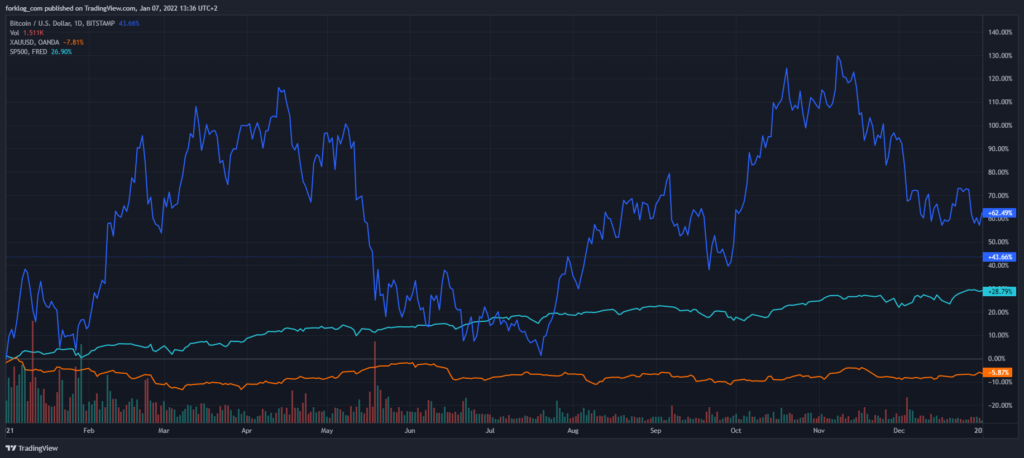
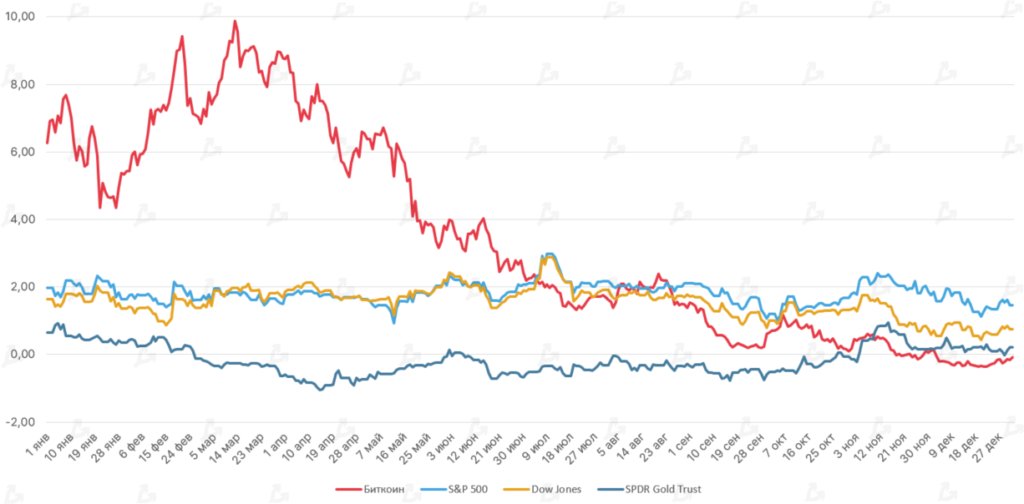
Bitcoin again outperformed gold and the S&P 500 over the year. Its return was more than twice the pace of the U.S. economy barometer. Gold declined by almost 6% over the year.
Macroeconomic backdrop


- Over the year the Fed printed $1.39 trillion; its balance sheet reached $8.83 trillion (37.9% of US GDP). Following the December 14–15 meeting, the department doubled the pace of asset-purchase tapering—from $15 billion to $30 billion. At this pace, the quantitative easing program will end in March 2022.
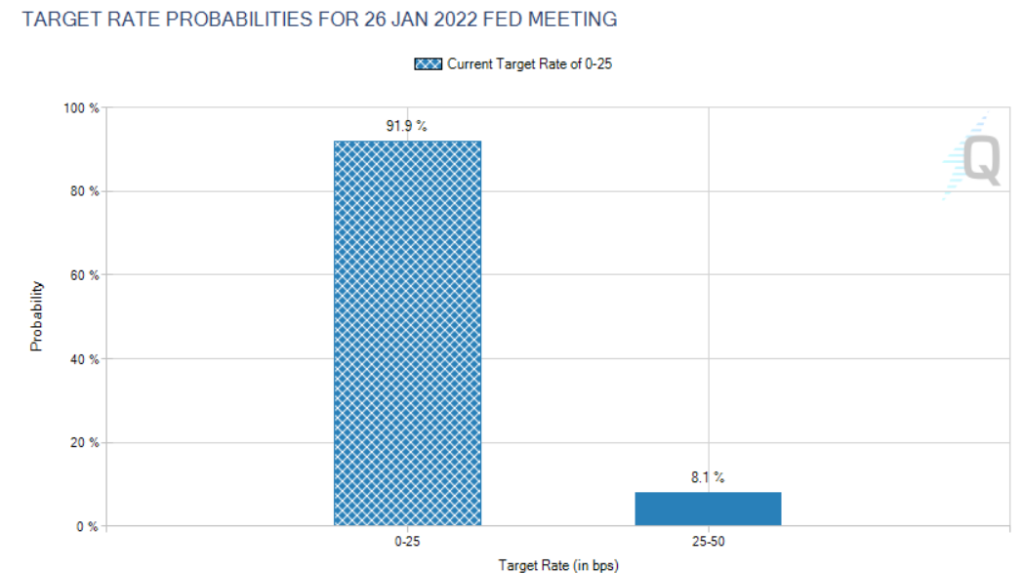
- The regulator did not rule out three rate hikes in 2022. The previous September forecast allowed only one increase this year and two in the next. At the current level of 0%–0.25% per year, this parameter has stood since March 2020 when the Fed loosened policy in response to COVID-19.
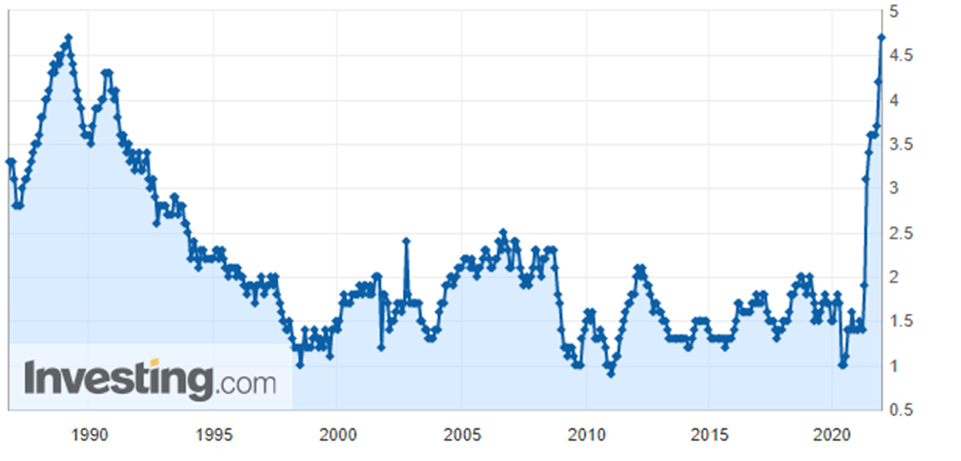
- The futures market with >90% probability does not exclude the first rate hike as early as the meeting on 16 March. Investors view this scenario against the backdrop of a rising key inflation gauge—the personal consumption expenditures price index core—to its highest since 1989.


- The prospect of faster tightening by the Fed limited appetite to buy digital assets. In December, Bitcoin’s correction from ATH reached 40%.
- The cryptocurrency market also ignored the U.S. stock market reaching fresh records in the Santa Claus rally.
Market moods, correlations and volatility


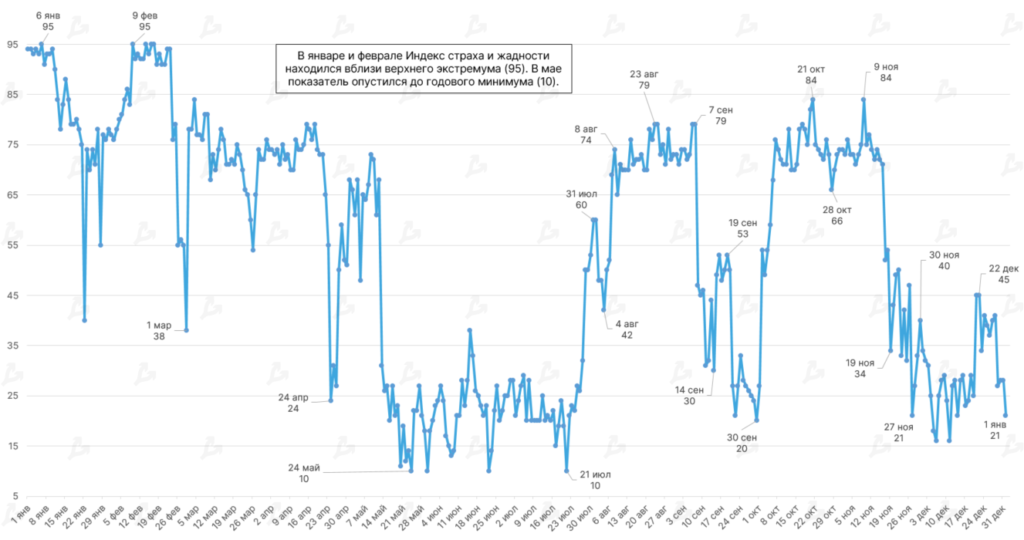


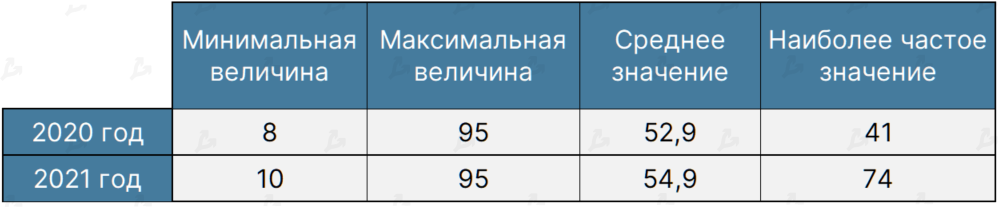
- Despite Bitcoin’s explosive price rise in 2021, the Fear and Greed Index moved in line with a prior pattern.
- In January–February, market sentiment was bullish. Yet, after the spring, following quotations, the indicator hit its annual low (10), signaling investor fear.
- A similar pattern occurred during autumn and winter corrections. In September the gauge dropped to 20, and in November–December to 21.


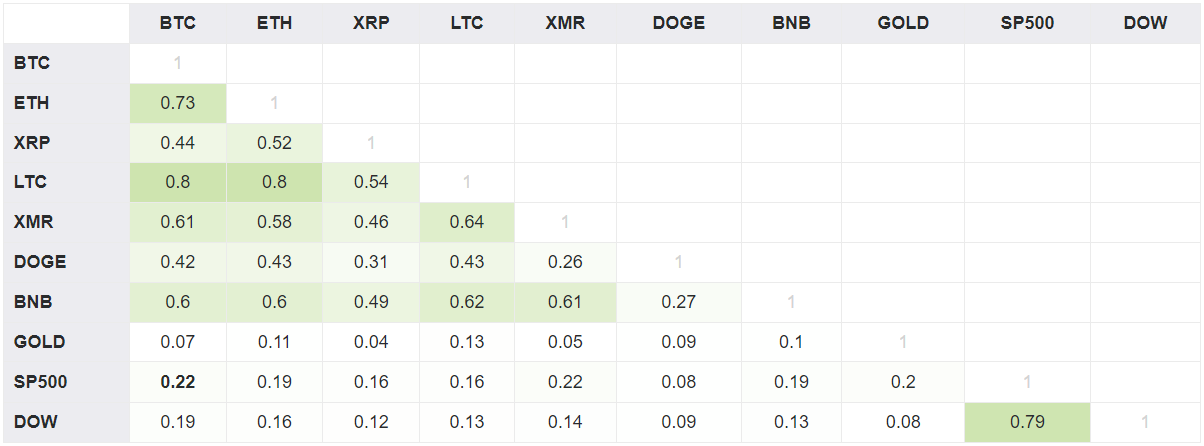
- Bitcoin correlated with gold over the year, but the correlation was weak (0.07).
- Movements in Bitcoin price, S&P 500 and Dow Jones were one‑way. The correlation with the first indicator was stronger (0.22 vs 0.19). The reason lies in high investor appetite for risk.
- Despite the appearance of cryptocurrency ETFs in the US, Bitcoin’s correlation with stocks waned over the 12 months. In January 2021 it stood at 0.3 with the Dow and 0.32 with the S&P 500.


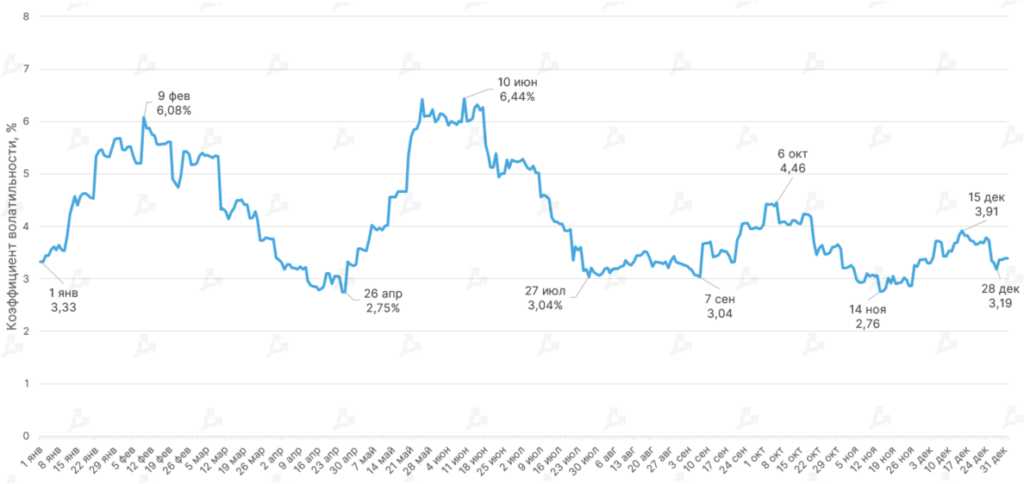


- Bitcoin’s average historical volatility index in 2021 stood at 4.12%, down from 5.17% the year before. Lower volatility signals market maturation.
- The Sharpe ratio (risk-adjusted return using U.S. 2-year treasuries as the risk-free asset) suggests relatively high risk taking in Bitcoin investments. In November gold exceeded Bitcoin’s metric. The stock market lagged the crypto last year, but Bitcoin’s high returns offset the risk.


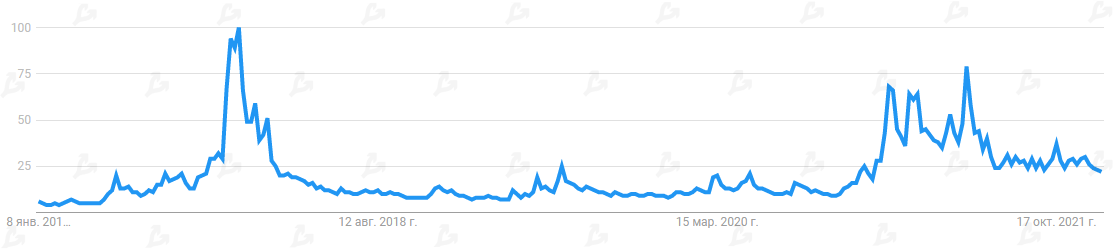
- Until the May market collapse, user interest in Bitcoin stayed elevated, peaking after the price drop.
- Thereafter, interest faded. A similar pattern preceded the 2018 crypto winter, suggesting a potential bear market signal.
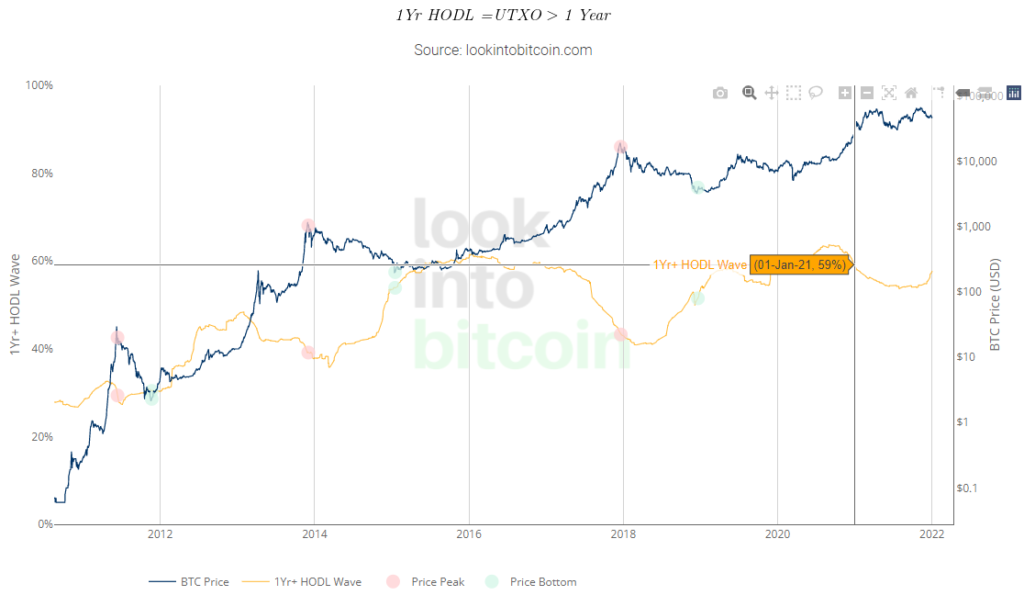
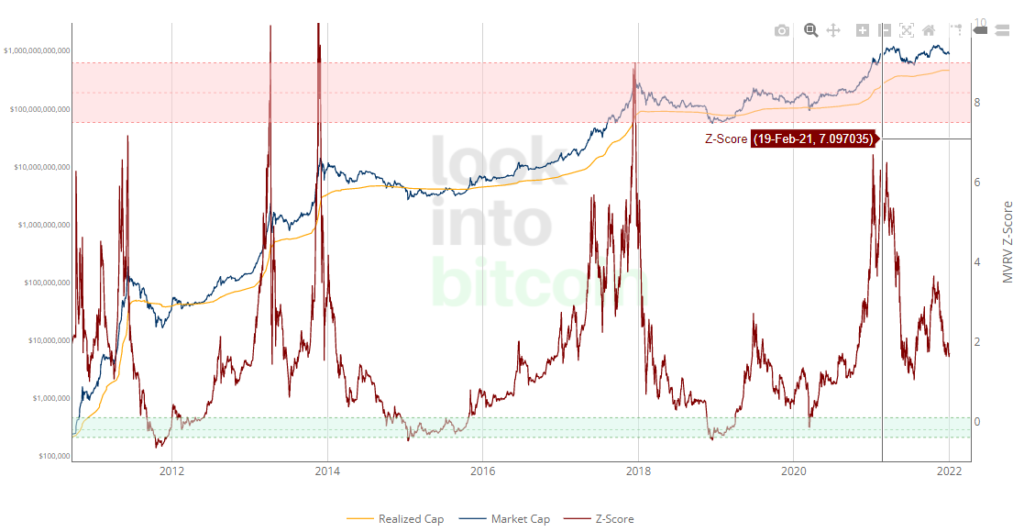
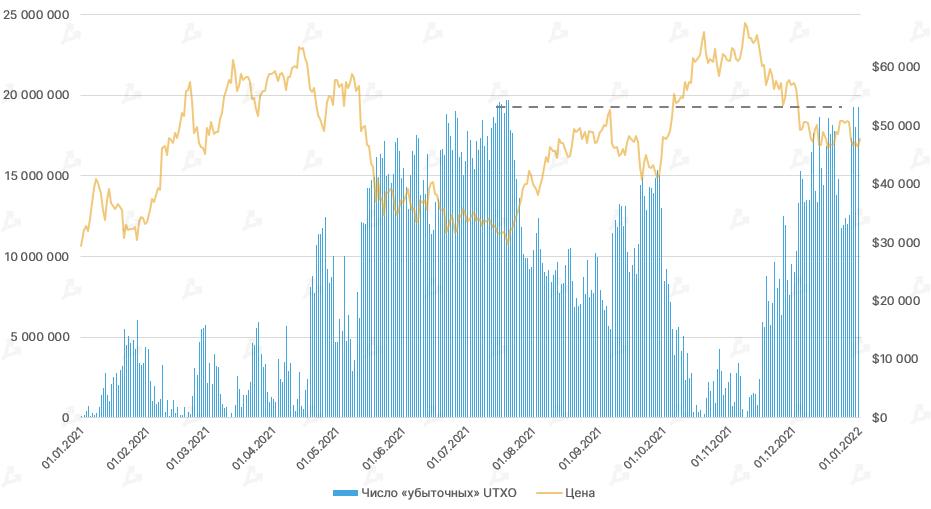
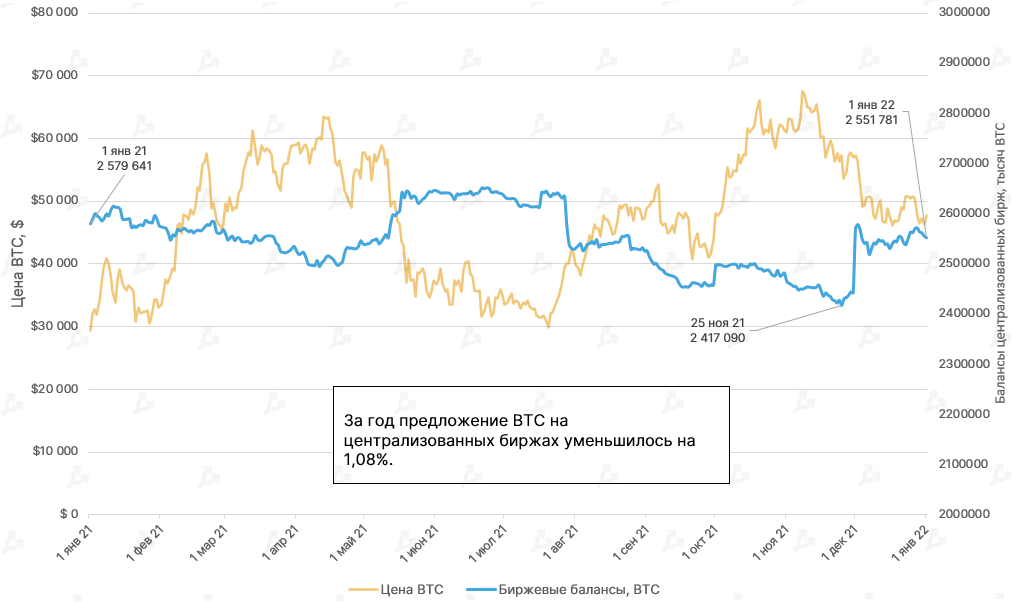
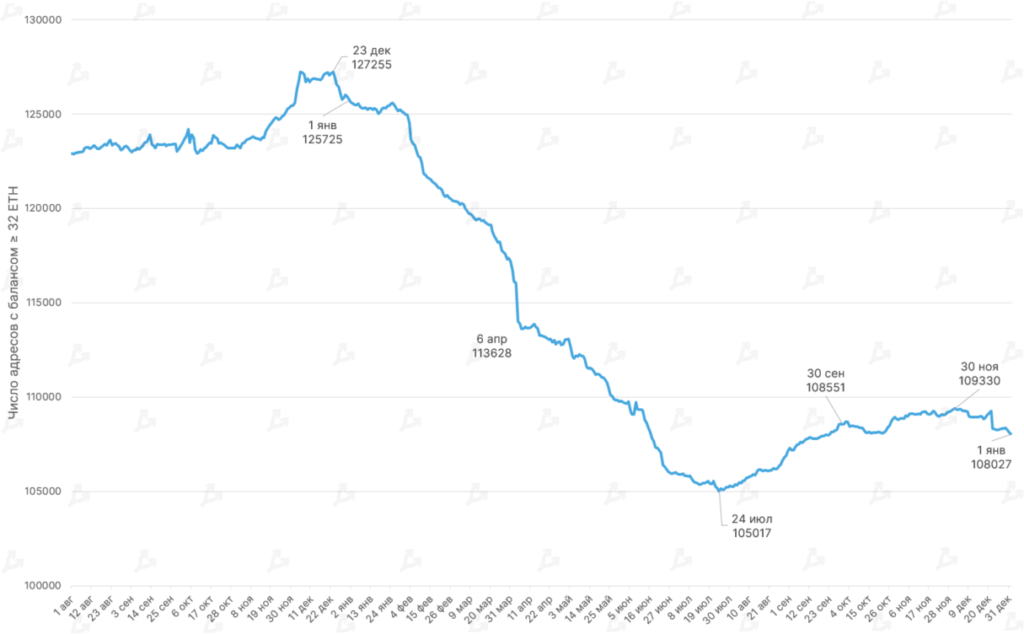
On-chain data
Bitcoin