


Capitulation Phase: When Will Bitcoin’s Price Resume Its Rise
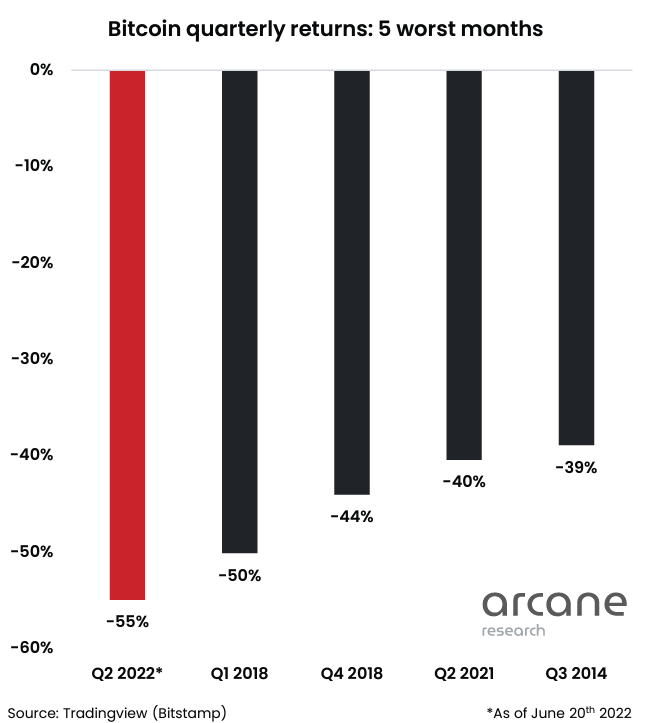
The first half of 2022 was not the best for Bitcoin investors. The price fell 69.2% from the November high. And the second quarter was the worst in the history of digital gold.
The market backdrop hit not only optimistic assets, many of which ждали биткоин по $100 000, but also miners’ revenues. At the current price, legendary Antminer S9s are operating at a loss, and mining cash flow сократился на 80%.
Now miners are selling a large portion of the mined cryptocurrency, exerting additional pressure on the price. Many analysts убеждены, что капитуляция добытчиков биткоина — хороший индикатор дна рынка.
ForkLog проанализировал наиболее актуальные ончейн-метрики и выяснил, чего ждать от цены первой криптовалюты в кратко- и среднесрочной перспективе.
- Многие индикаторы подают сигналы, указывающие на вероятное восстановление биткоина. Но потенциал снижения остается до $10 300.
- Всплеск притока средств на биржи на фоне падения цены — признак капитуляции майнеров.
- Анализ исторических данных показывает, что дно цикла еще может быть впереди.
Капитуляция майнеров
18 июня биткоин хешпрайс провалил уровень $20 000. Это событие переполошило многих сторонников теханализа — ведь никогда прежде котировки не падали ниже дна предыдущего рыночного цикла.
В сообществе задались вопросом, где искать следующий уровень поддержки. Исследователи Arcane Research сопоставили просадки первой криптовалюты в прошлых рыночных циклах и пришли к выводу, что потенциал снижения сохраняется до отметки $10 350.
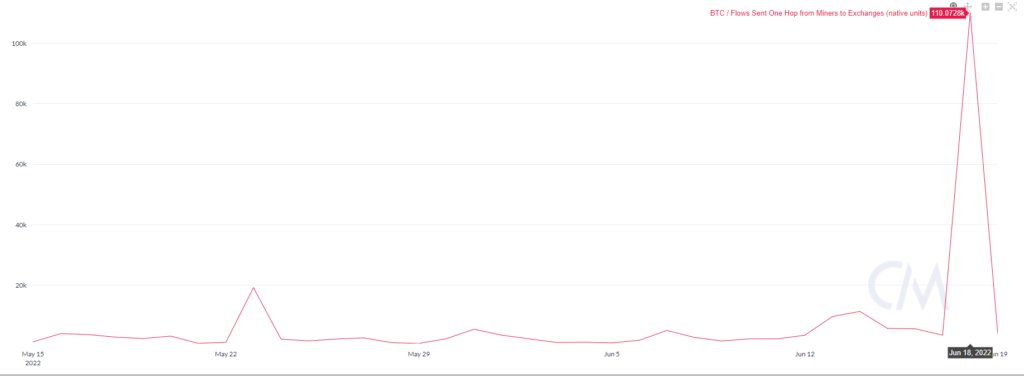
Многие аналитики обратили внимание на массированные продажи майнеров накануне обвала. Об этом свидетельствует всплеск объема криптовалюты, отправленной на биржи с кошельков майнеров.
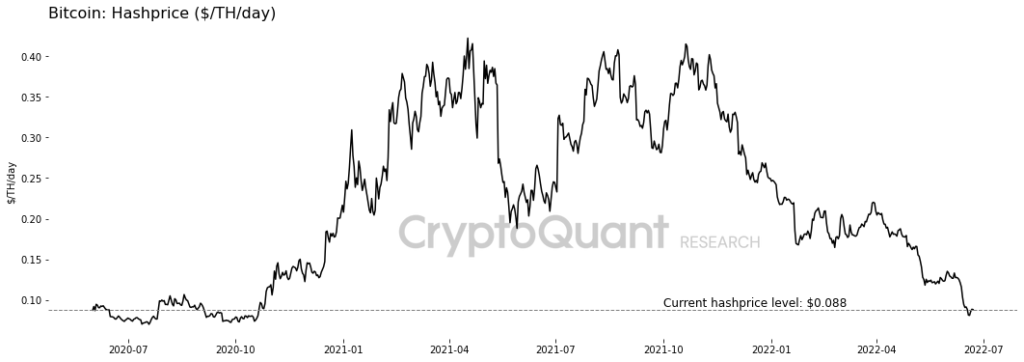
Старший ончейн-аналитик CryptoQuant Хулио Морено объясняет такую динамику резким падением доходности добычи биткоина. По его наблюдениям, показатель хешпрайс снизился до $0,09, что соответствует показателям октября 2020 года.
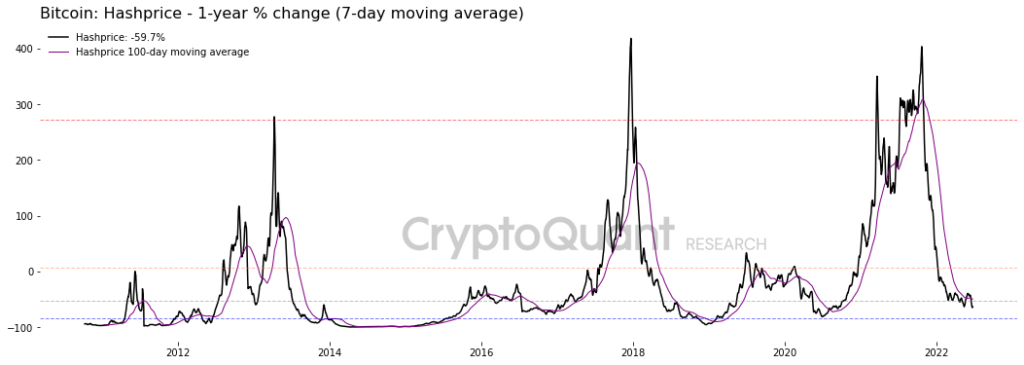
В годовом исчислении показатель упал на 60%. Это, по словам Морено, самый быстрый темп снижения со времен «коронавирусного» обвала марта 2020 года.
Рост сложности добычи биткоина усугубил положение майнеров, увеличив их затраты.
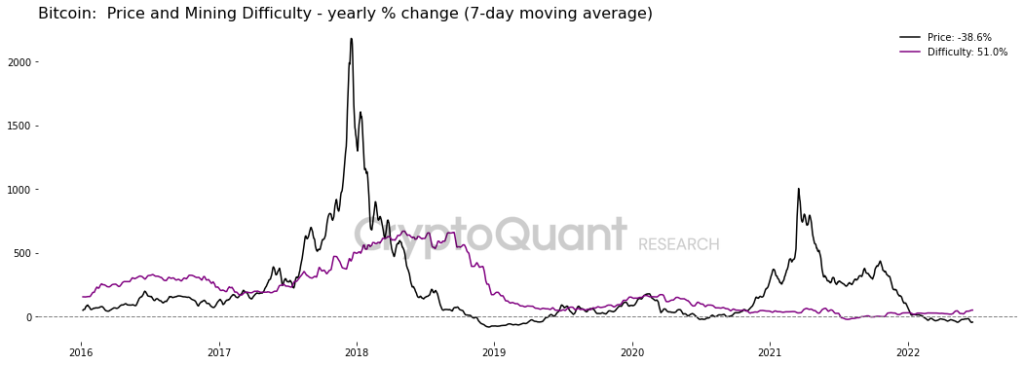
С начала года сложность выросла более чем на 50%. За этот же период первая криптовалюта подешевела примерно в два раза.
“Against the backdrop of declining revenue and profits, miners have turned into Bitcoin sellers,” the researcher emphasized.
По мнению Морено, растущий объем биткоинов, отправляемый майнерами на биржи, оказывает давление на рынок.
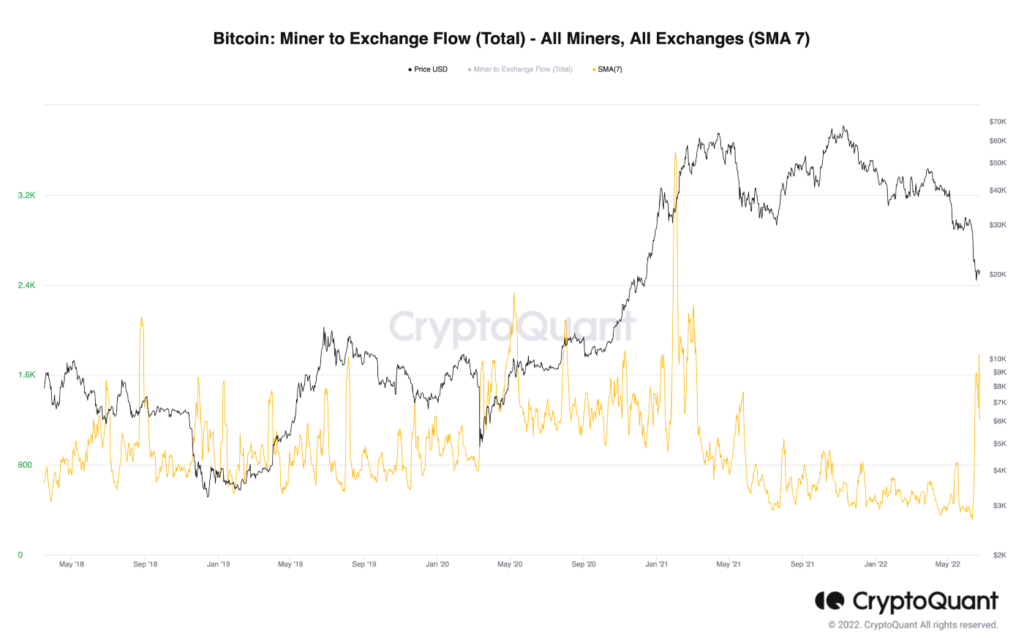
Only in June miners sent 23,000 BTC to trading平台s, the highest monthly figure since May 2021.
“In a single day some Poolin pool members shipped 5,000 BTC or about $110 million to Binance. This move can indicate that some miners’ revenues are below the profitability threshold. As a result, they have to sell coins to cover costs and service loans,” Moreno wrote.
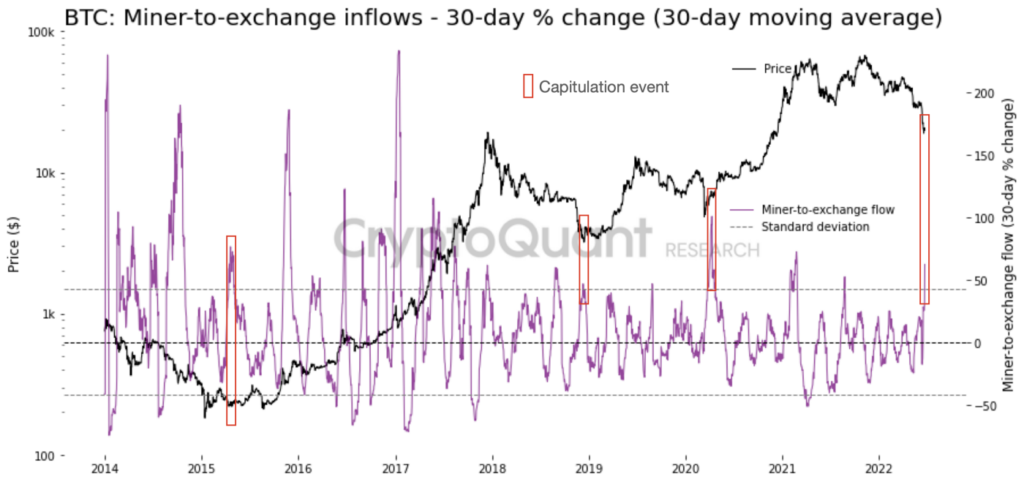
According to the expert, the sharp uptick in exchange inflows amid falling prices is a sign of miner capitulation, typically preceding a market bottom.
Что будет с ценой?
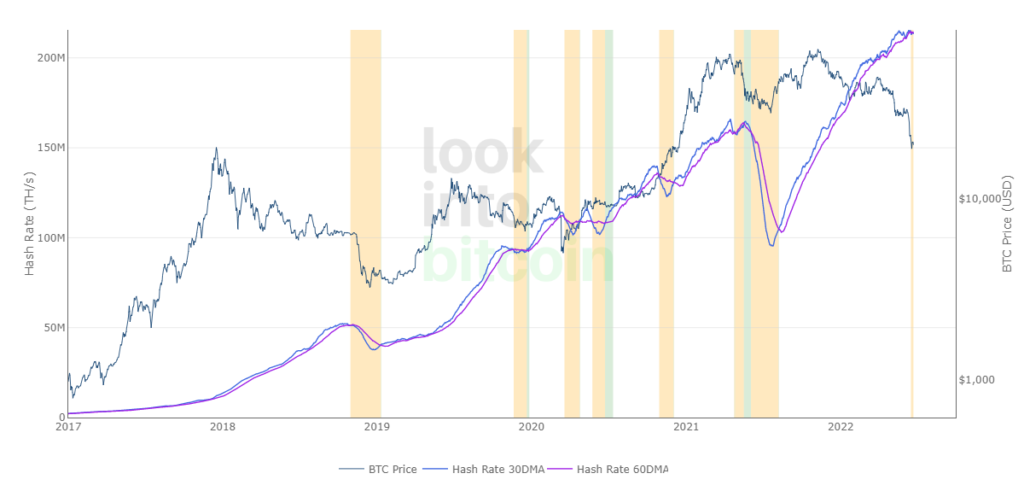
The Difficulty Ribbon Compression indicator, based on the Difficulty Ribbon metric, has signaled a favorable buying period for Bitcoin since the end of March.
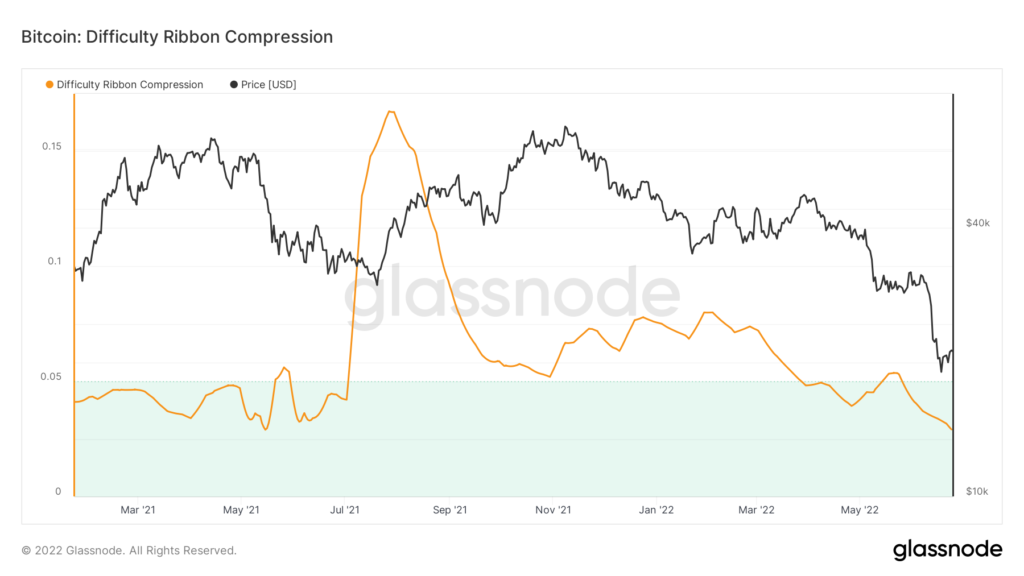
“Green zone” — a sign of ribbon compression, indicating capitulation by part of miners. The market remains, for the most part, occupied by the most efficient equipment. They sell less, opening room for price growth.
Another tool — Hash Ribbons Indicator — recently signaled the start of capitulation (vertical yellow stripe).
Dynamic of HODL waves shows a decline in speculative activity among short-term investors.
The indicator The Puell Multiple in early June reached the green zone, signaling Bitcoin is oversold.
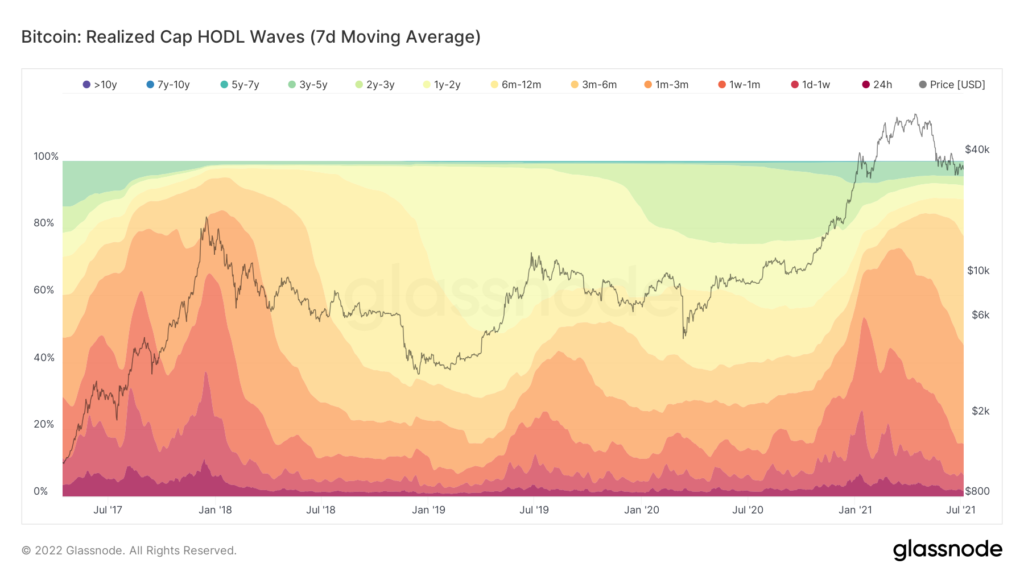
On the chart above, red bands show the percentage of coins that have been in motion recently — from 1 day to 90-180 days. Since Q1, there has been a decline in the supply from short-term investors.
The indicator The Puell Multiple values in early June reached the green zone, indicating Bitcoin is oversold.
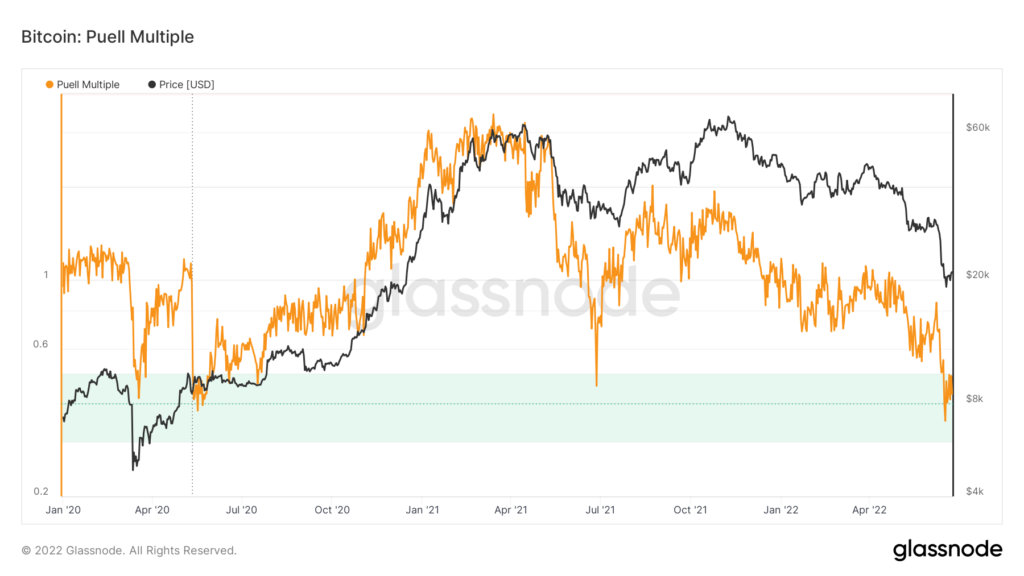
This “cycle barometer” is the ratio of the daily on-chain Bitcoin issuance in dollars to the same metric smoothed with a 365-day moving average.
The same signal is shown by the MVRV Z-Score indicator, which is based on the ratio of market capitalization to realized capitalization.
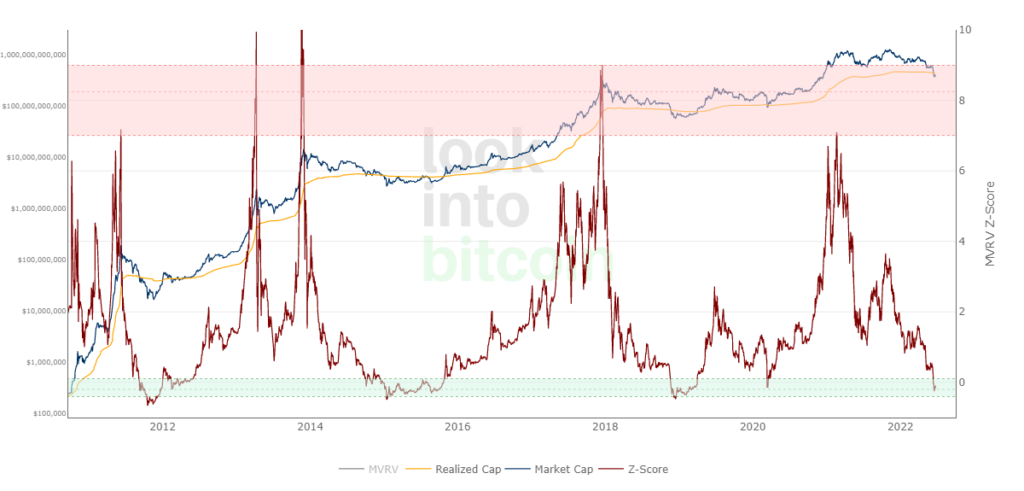
In the last run, this on-chain tool signaled oversold (and thus a favorable period for long-term purchases) as recently as March 2020. At that time Bitcoin traded below $5,000.
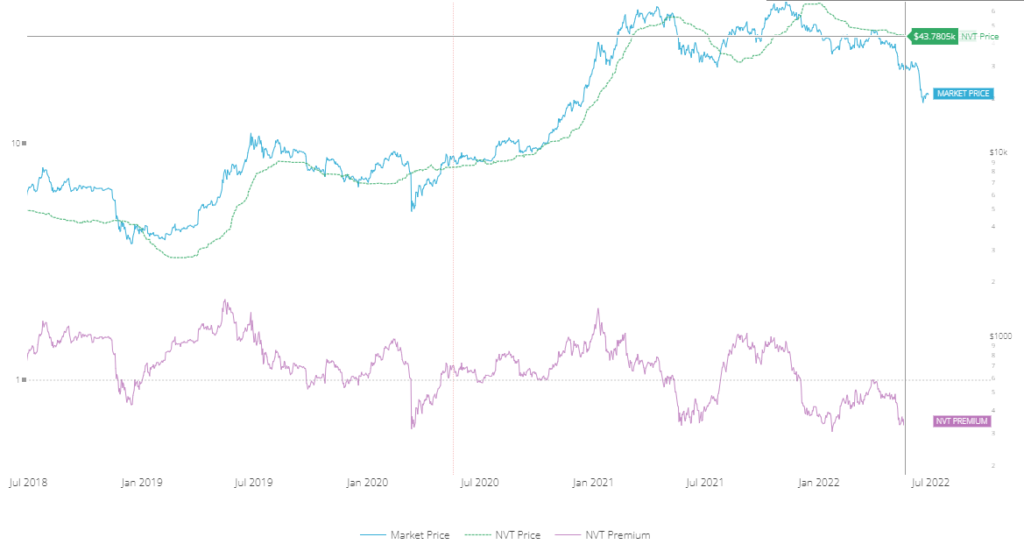
According to data from the indicator NVT Price, the fundamentally justified price of digital gold sits around $44,000. In other words, Bitcoin is significantly undervalued.
What does the technical analysis say?
This material is published solely for informational purposes and does not constitute investment advice. ForkLog bears no responsibility for readers’ investment decisions.
On the chart below, it is visible that the price is trying to hold above the $20,000 level and above the 200-week moving average. The RSI indicator has never reached such a deep oversold level.
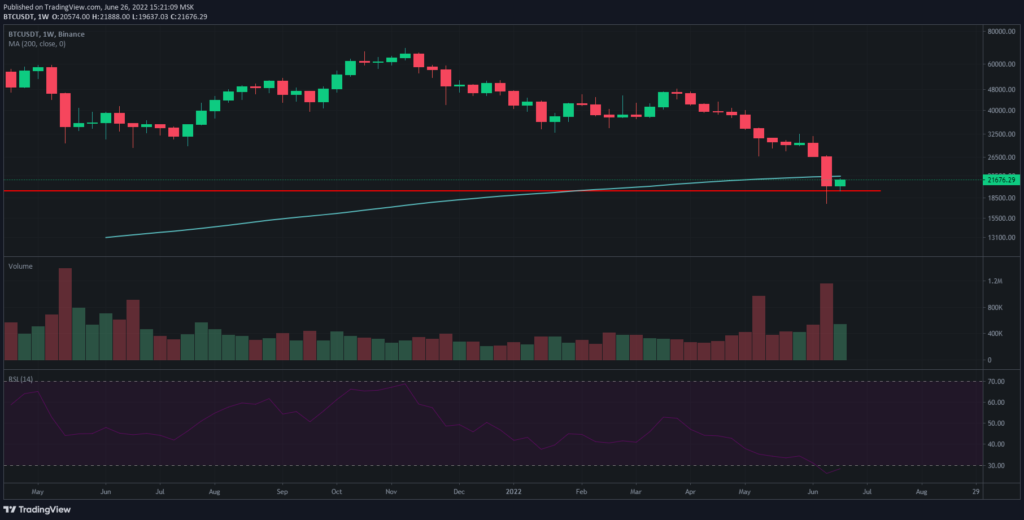
The situation for Ethereum is broadly similar. Thus the entire market seems in a suspended state. Support appears fragile, but a high probability of a bullish correction or even a full trend reversal remains.
Bitcoin price is well below the 200-day moving average (MA 200) — a kind of boundary between bullish and bearish markets.
The Mayer Multiple indicator, based on MA 200, sits at 0.56, a level above which it has spent 97% of the time.
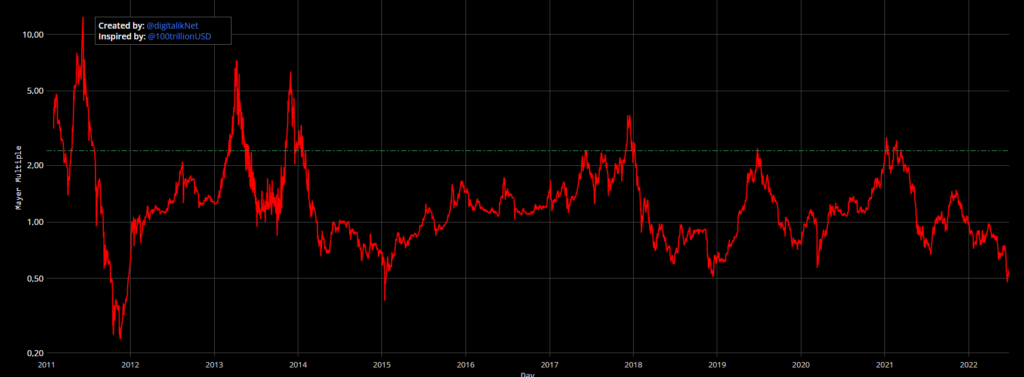
The average value of the metric since Bitcoin’s appearance is 1.4.
Buying is favorable when the indicator reads below 2.4.
Analyst Matt Roy sopostavил the Mayer Multiple dynamics with historical Bitcoin investment returns. He concluded that buying the cryptocurrency from current levels may yield “x” returns for patient investors.
According to Roy, if you buy Bitcoin for $1000 from the current metric levels and hold the asset for 60 days, the exit amount would range from $1000 (breakeven) to $2300.
All else equal, holding the asset for 180 days historically yields 1.9x–50x. That is, a $1000 investment would be worth between $1800 and $50,000.
An equivalent investment after a year, according to Roy, would turn into $50,000 to $250,000.
The researcher stressed that these calculations are entirely based on historical returns and do not guarantee similarly impressive results in the future.
“The macroeconomic recession has begun; this time everything could be different,” Matt Roy noted.
Conclusions
The current situation is not easy. Unlike previous market cycles, Bitcoin reacts much more sensitively to macroeconomic factors: changes in the Fed’s rate, the state of the stock market, and geopolitical tensions.
An important element of the picture is large centralized players like Celsius and Three Arrows Capital (3AC), whose serious problems began with Terra collapse. Troubles also hit broker Voyager Digital (3AC). The problems of these firms exert pressure on the market. And the pace of recovery largely dictates the stabilization of their finances.
On-chain metrics point to oversold conditions and forecast a price reversal for Bitcoin and many correlated crypto assets. Technical indicators also offer moderately optimistic signals. There is no doubt that miner capitulation is in its early stages, usually preceding consolidation and a trend reversal.
However, market participants should view the situation holistically, accounting for various factors. Investors should be cautious, for example using the time-tested dollar-cost averaging method . This will help reduce volatility risk, especially if, contrary to the indicators, Bitcoin price runs to seek another bottom.
Read ForkLog Bitcoin news in our Telegram — crypto news, rates, and analysis.
Рассылки ForkLog: держите руку на пульсе биткоин-индустрии!