


The available supply of digital gold has fallen to all-time lows, and the pace at which coins are moved into long-term storage is about 2.48 times the pace of issuance, according to Glassnode analysts.
The 2024 #Bitcoin halving is coming, estimated to be in April next year.
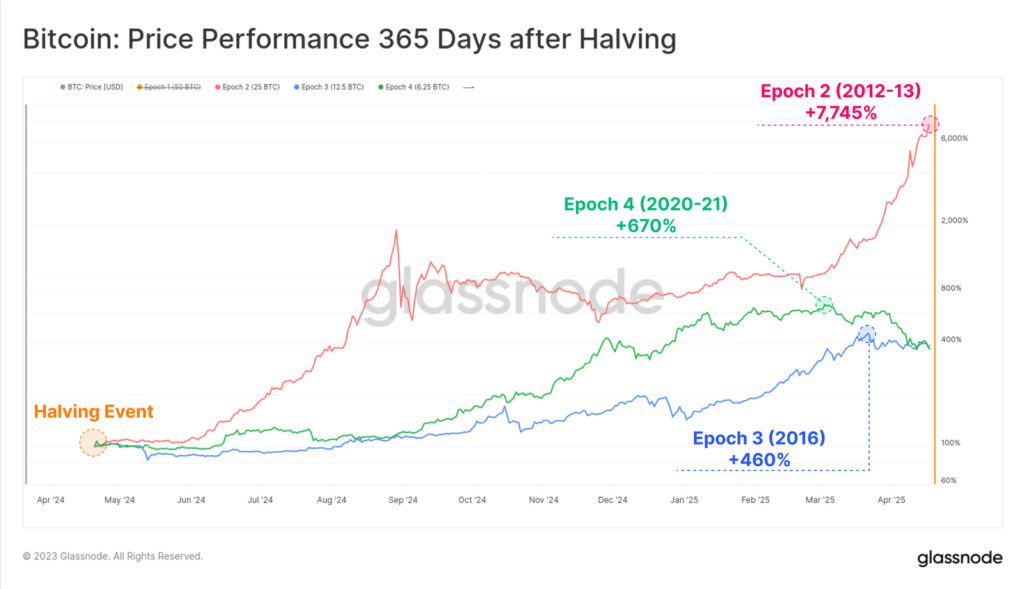
Past cycles have also seen an impressive 1yr return profile of 400%+ following the event.
In this edition, we study the supply dynamics and investor behaviour that underpins this.https://t.co/Obo9lIwoQl
— _Checkɱate ?⚡?☢️?️ (@_Checkmatey_) November 13, 2023
Experts timed the study to the halving slated for April.
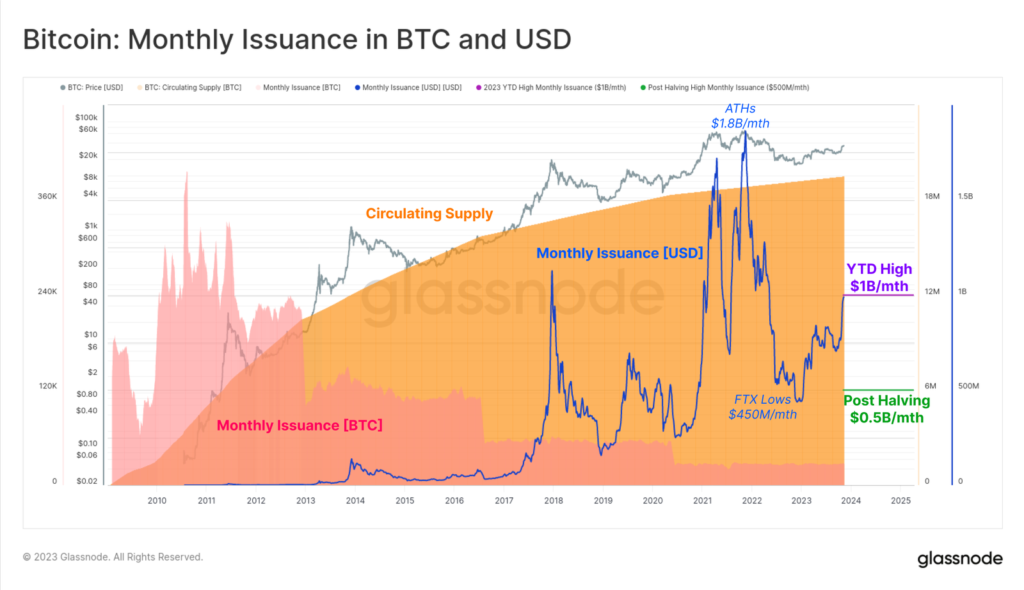
According to their estimates, after the reward to miners is halved, their sales to cover operating and capital expenditures would fall from around $1 billion to around $500 million.
The magnitude is comparable to the selling pressure after the FTX crash, which ran at a monthly pace of $450 million.


Analysts note that all prior halvings were followed by a bullish market within the next 365 days. They decided to analyse this phenomenon from the perspective of on-chain analysis.


Assessment of the available supply
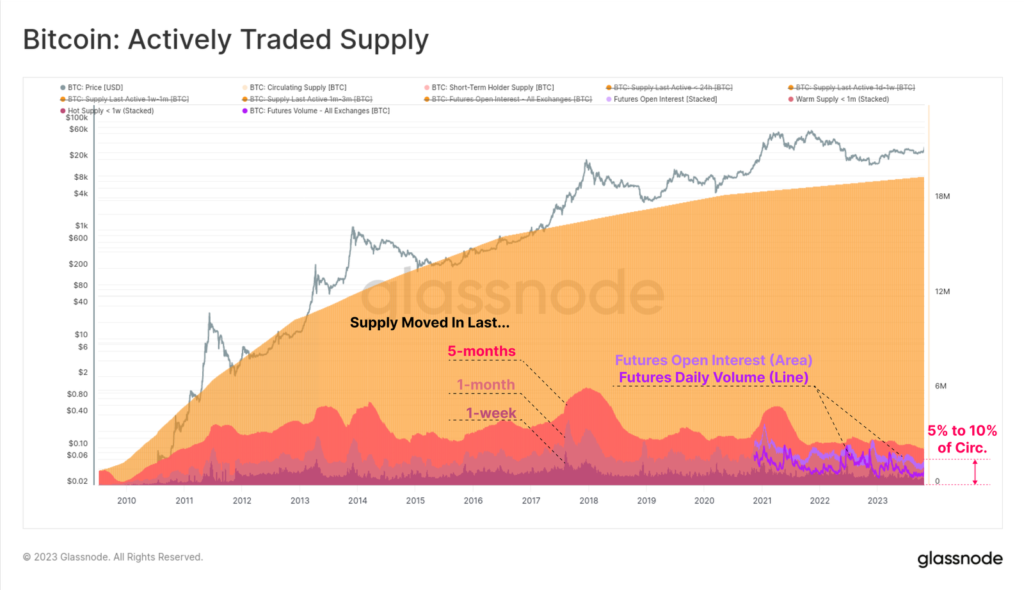
According to experts’ estimates, the number of coins aged less than 155 days is currently about 2.33 million BTC (a multiyear low). The statistics suggest they are most likely to be spent, they explained.
Another hot category of liquid supply can be measured as bitcoins with the most recent activity under a month (1.39 million BTC). Experts also proposed including here the open interest in futures (0.41 million BTC).
Taken together, the amount of coins investors can reasonably count on in the near future is equivalent to between 5% and 10% of all issued Bitcoin.
For obvious reasons, there is a significant overlap between liquid and highly liquid supply and exchange balances. A multi-year trend of decline in the latter indicator points to coins moving to wallets with short spend histories, the analysts noted.
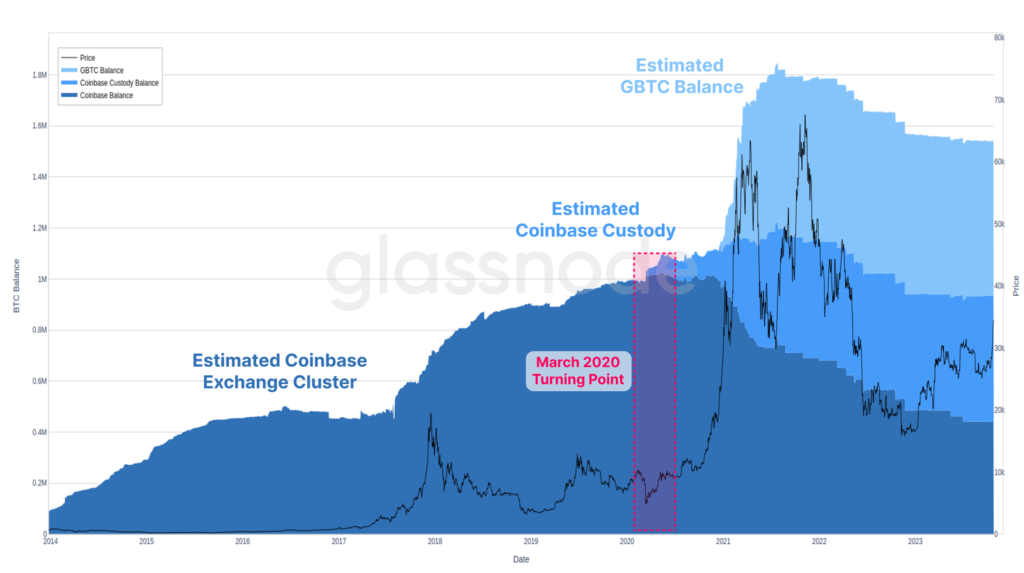
In this respect, analysts urged considering the role of cryptocurrency custody services, which serve the interests of exchange-traded funds ETF and products such as GBTC. On the graph below, the analysts showed estimates of combined exchange- and custodian-related volumes, as well as Grayscale’s Bitcoin Trust. The tendency to accumulate coins by these entities intensified in March 2020.


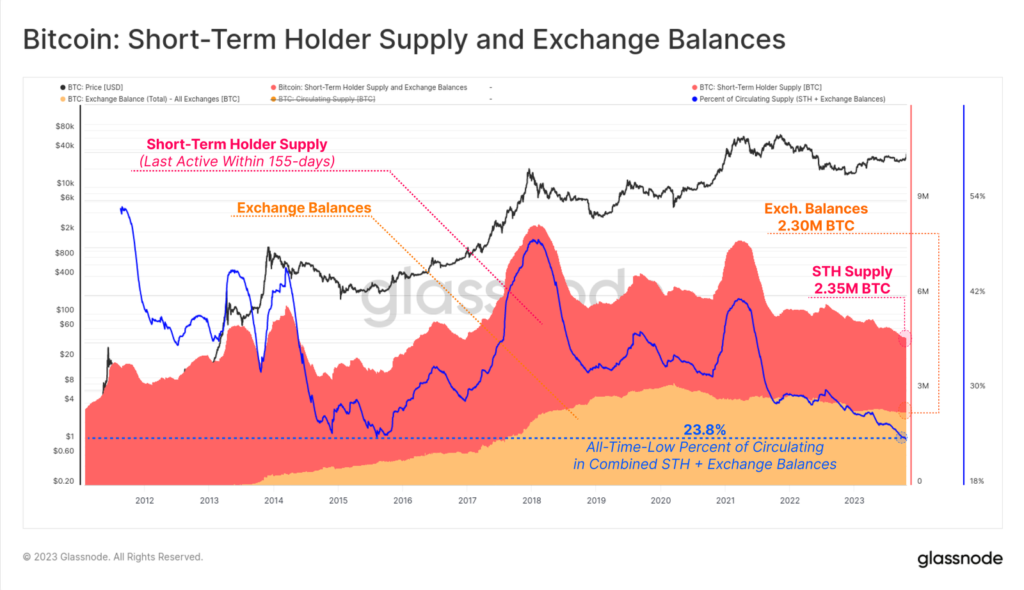
Analysts compared the volume of bitcoins held by speculators with exchange balances and found these measures to be of similar scale (2.39 million BTC and 2.3 million BTC respectively). Collectively, these two indicators of “available supply” amount to about 23.8% of issued coins — a record low.
Assessment of the pace of increasing Bitcoin supply for long-term storage
The trend toward shrinking various metrics of “available supply” has been underway for several years. The acceleration was prompted by the June 2022 events — Terra collapse and hedge fund Three Arrows Capital, the analysts stressed.
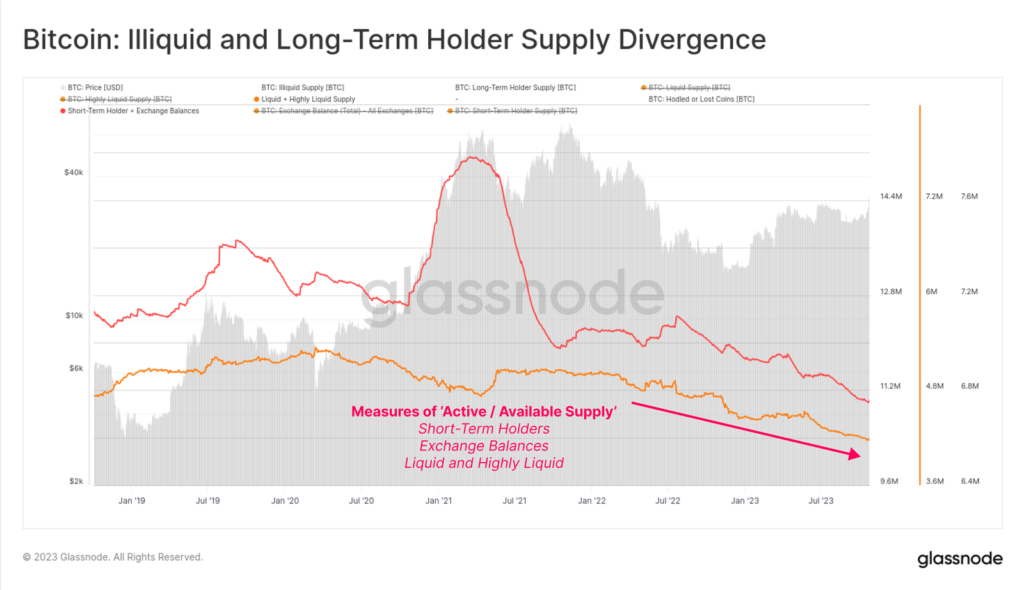
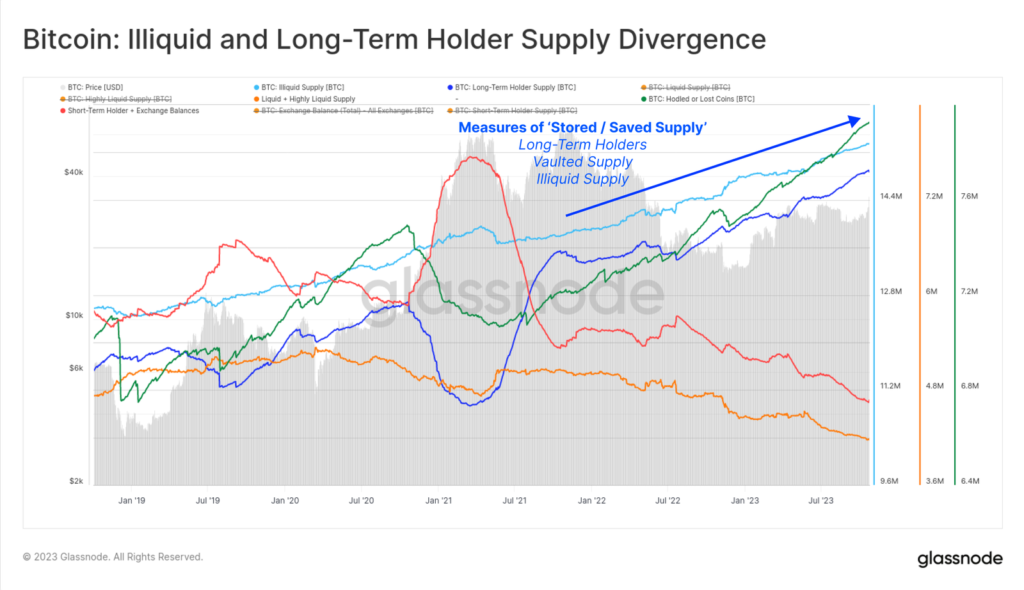
Subsequently, the analysts looked at the metrics of coins sent to storage. They included:
- Bitcoin held by hodlers aged more than 155 days (highlighted in dark blue);
- illiquid stocks — wallets with a limited spend history (in blue);
- coins moved to custody — actions by committed hodlers and lost Bitcoins, based on Cointime methodology (in green).
The chart below illustrates the migration of Bitcoin away from exchange balances, from speculators and active trading toward cold storage, custodians, and long-term-investor wallets.
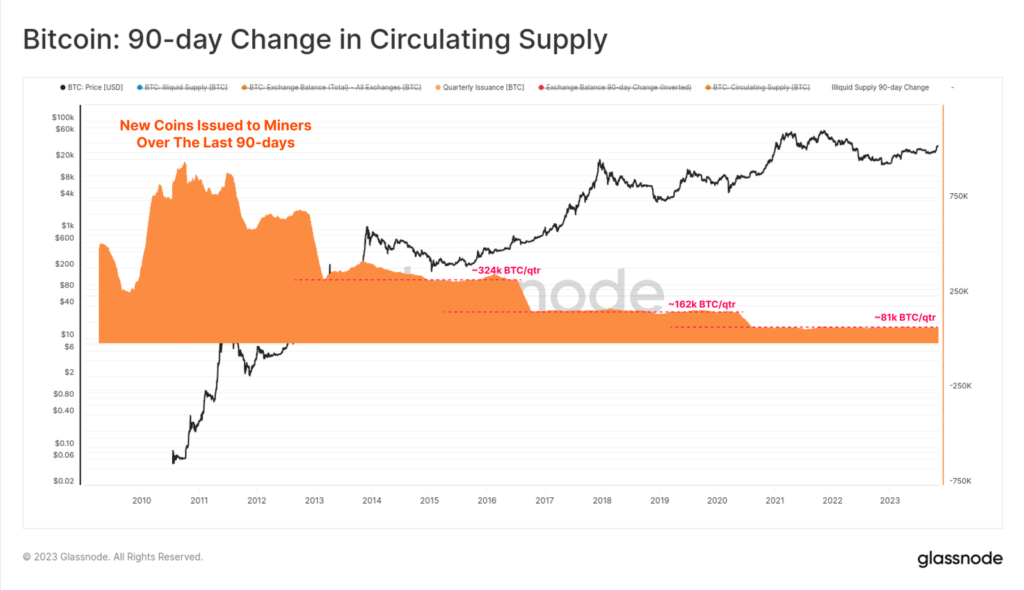
To gauge the scale of the above-mentioned trend, analysts proposed evaluating these movements against the illiquid state of coins from issuance. Quarterly issuance currently stands at 81,000 BTC; after the halving, it will halve to about 40,500 BTC.
In conclusion, the analysts presented a chart that captures the change in the “sent to storage” metrics since January 1, 2022. It shows that investors have been accumulating coins at rates of roughly 1.1 to about 2.48 times higher than the current rate of mining.
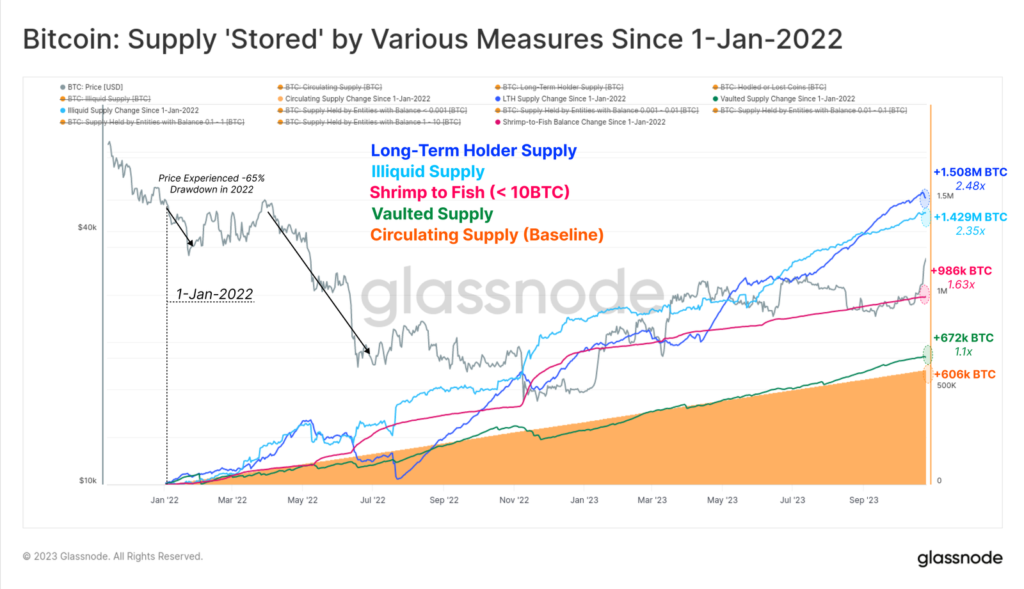
Glassnode notes that, in anticipation of the halving and the ETF, long-term investors have accumulated a record number of coins.
Earlier, based on evaluating capital movements between hodlers and speculators, analysts concluded that the current market structure of the digital-gold space bears similarities to the recovery phase after bear dominance in 2016 and 2019.