


Analysts record a pullback among Bitcoin whales
Since May 30, the aggregate balance of whale-held Bitcoin (addresses with 1,000 BTC or more), excluding exchange wallets, has declined by 255,000 BTC. That assessment comes from Glassnode.
The monthly pace of the metric’s decline, at 148,000 BTC, was a record.
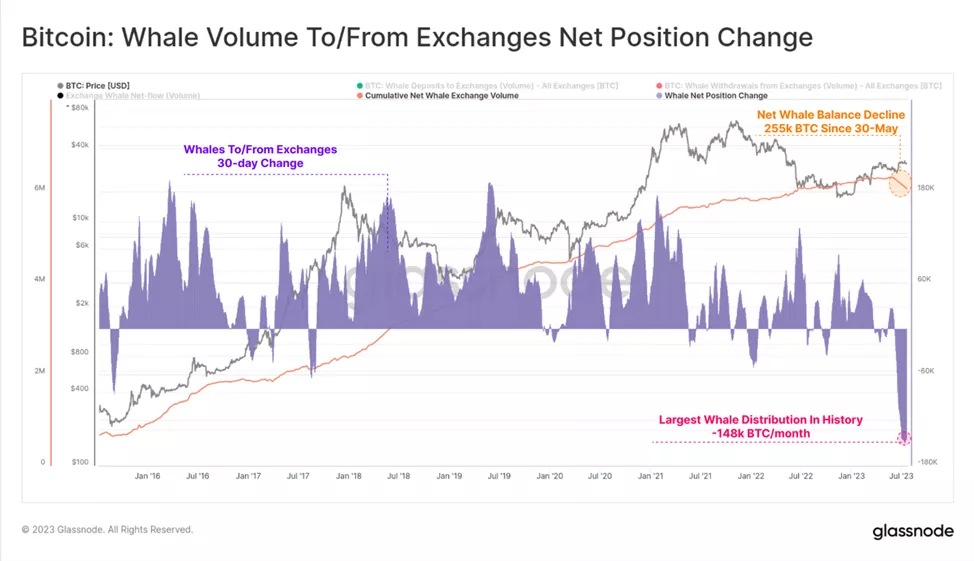
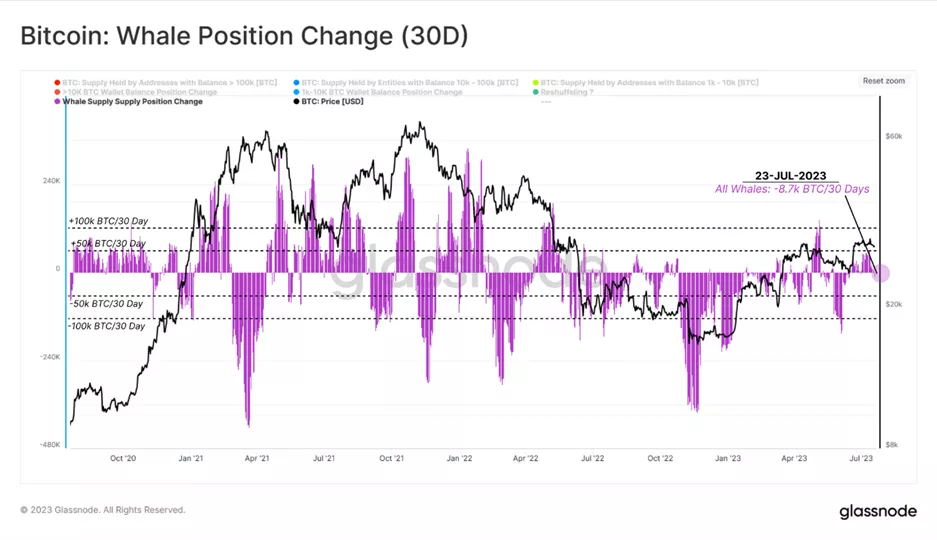
The situation looks less dramatic when exchange-related transactions are included in the sample. Over the last 30 days, whales transferred 255,000 BTC to exchange addresses. As a result, the net reduction by large market participants amounted to only 8,700 BTC.
Taking into account changes in balances within different whale segments, analysts described it as a “coin shuffle”.
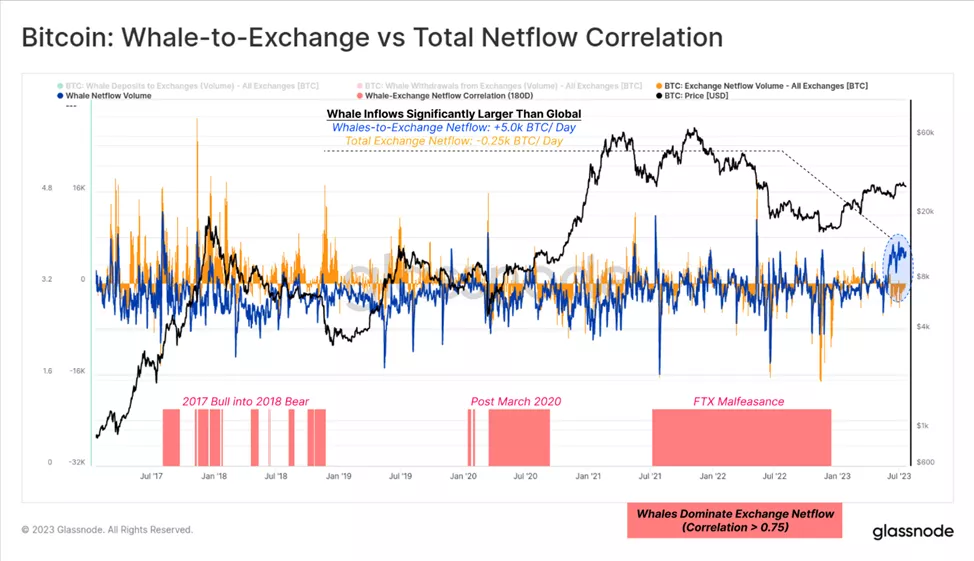
The chart below shows a jump in inflows of bitcoins from whales to centralised platforms (16 300 BTC per day) during the recent rally. Their share of the total deposits on exchanges reached 41%, exceeding the levels seen during Terra collapse (39%) and FTX crash (33%).
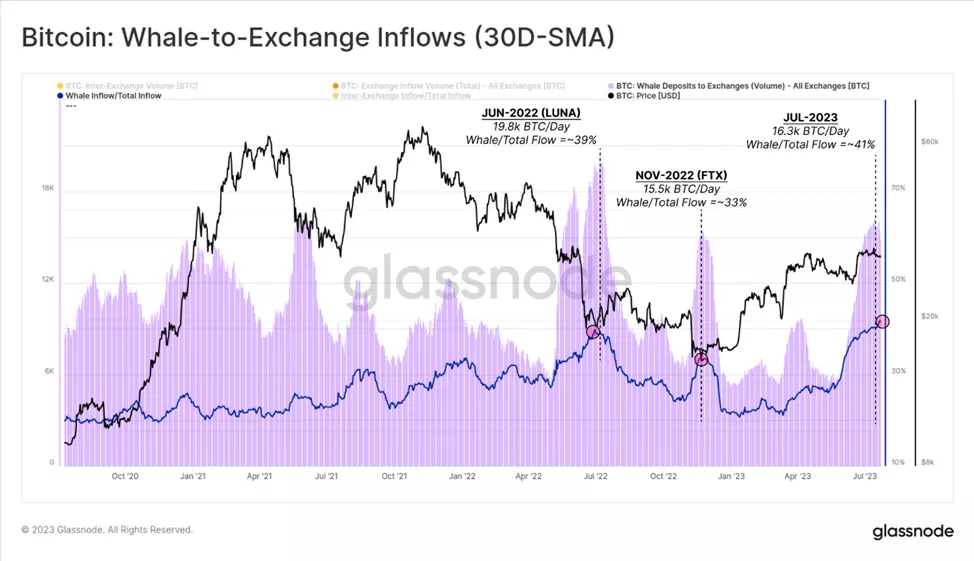
Similar activity is well illustrated by the dynamics of net inflows to exchanges. The metric for whales jumped to 5,000 BTC per day, while the aggregated metric for all participants slid into negative territory (−250 BTC per day).
Within whale deposits on CEX centralised platforms, Binance dominates (82%). Coinbase accounts for 6.8% of the coins, and the remaining platforms — 11.2%. In other words, during the July rally, more than a third of inflows by large players went to Binance. The dominance trend of the latter has strengthened over the last 12 months.
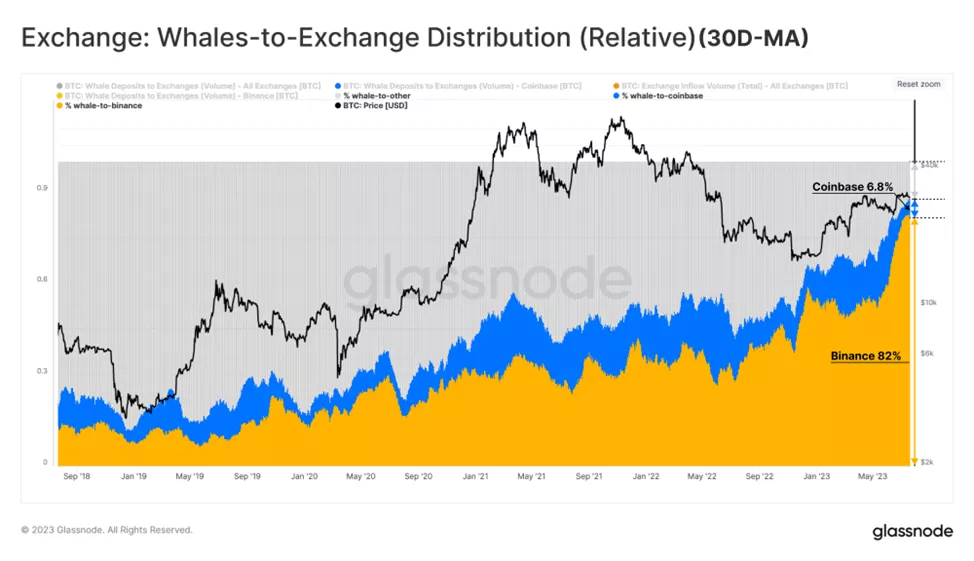
The share of speculators in inflows to platforms jumped to 82%, exceeding the long-term range over the last five years (typically 55% to 65%). Analysts noted that since the start of summer a large portion of trading activity has been linked to the whales that carried out trades in 2023.

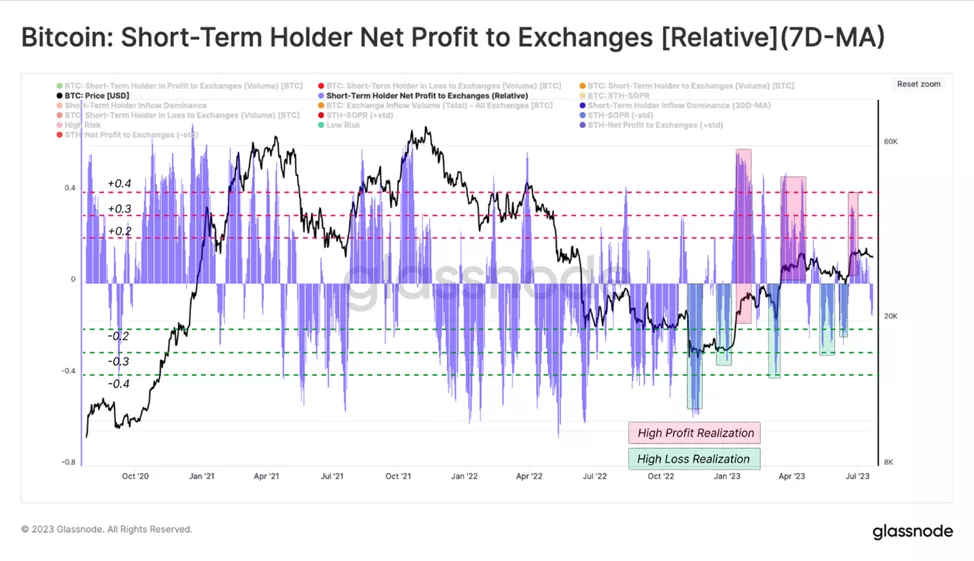
The next chart shows that short-term whales often lock in profits or losses when their “paper” profits or losses reach +/- 30%. Their actions drive the formation of local price extremes.
In July 22, a dormant wallet that had been inactive for over 11 years moved all its 1 037 BTC worth about $31 million.
Earlier, Glassnode analysts calculated that the share of bitcoins that had not moved in the last two years reached a historical high at 53%.
Рассылки ForkLog: держите руку на пульсе биткоин-индустрии!