



Bitcoin holds above $77,000 as oil slumps
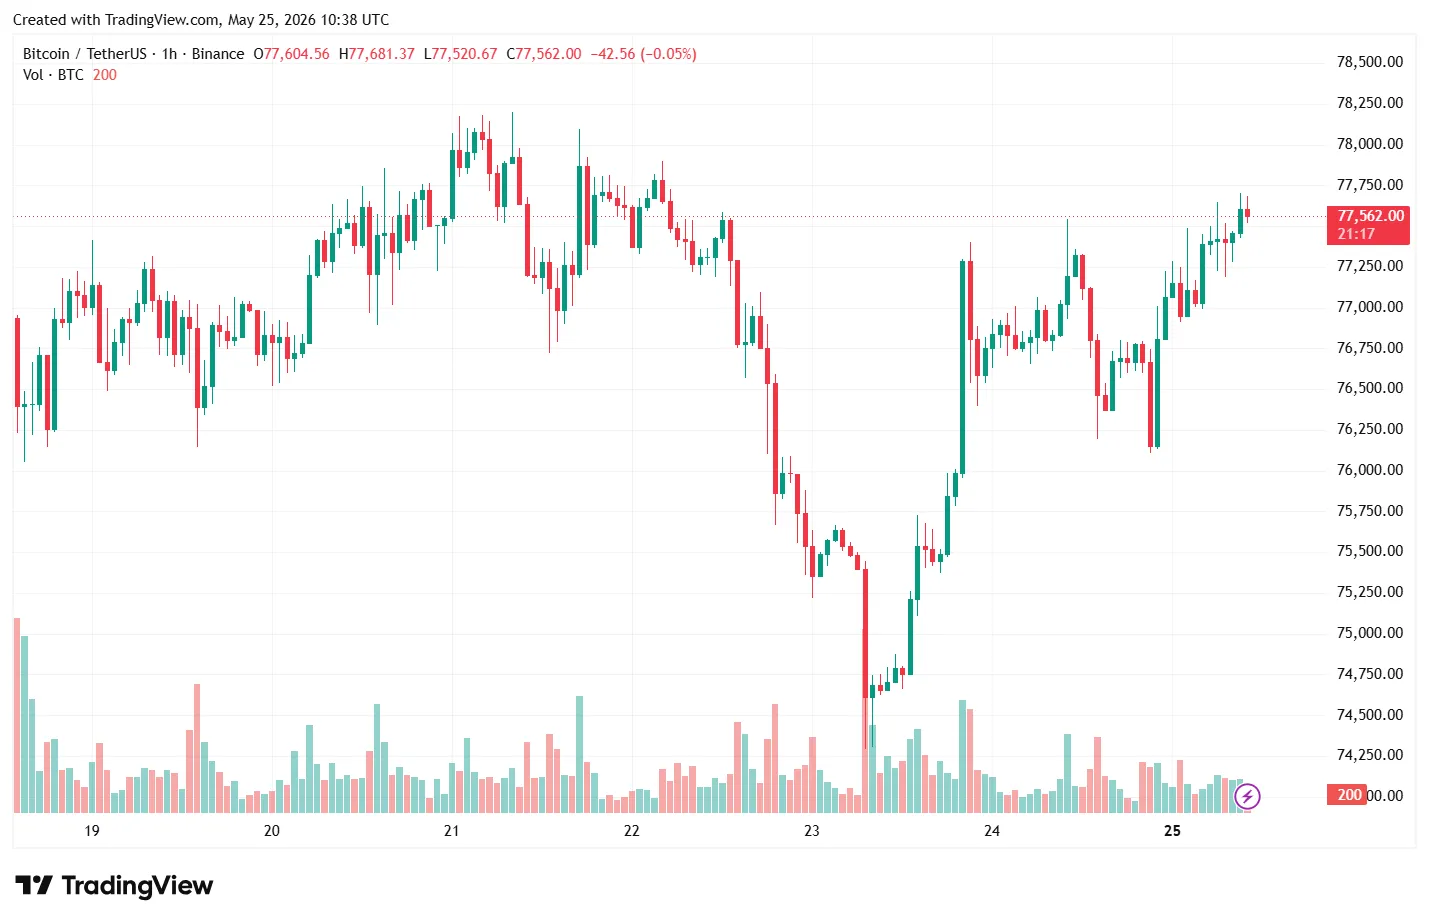
Bitcoin tops $77,000, up 0.5%, holding above the 50-day moving average at $76,940.
On May 25, the price of the leading cryptocurrency rose above $77,000. Over 24 hours the asset gained 0.5%, holding above the 50-day moving average at $76,940.
The crypto market’s advance came amid a commodities sell-off: WTI crude futures fell more than 5% to $91 a barrel. That lifted Asian equity indices: Japan’s Nikkei 225 added nearly 3%, and India’s Nifty 50 more than 1%.
The positive tone followed news of progress in talks between the US and Iran. The sides are close to a deal that would fully restore shipping through the Strait of Hormuz. US Secretary of State Marco Rubio confirmed the agreement could be signed on May 25.
Altcoins posted modest gains: XRP and Solana rose 0.6%, and Ethereum 0.4%. Unlike bitcoin, however, these assets still trade below their 50-day moving averages.
Analysts remain cautious owing to outflows from spot bitcoin ETF — more than $2bn has left over the past two weeks. BRN noted that for the rally to continue, the market needs a slowdown in fund selling and steady liquidity in stablecoins.
Bitcoin demand hits a low
Visible demand for digital gold fell to its lowest level since the start of the year, according to an analyst using the pseudonym Darkfost.
Bitcoin Demand has Fallen to Its Most Bearish Level of the Year
“Even if this situation appears relatively bearish in the short term, these types of environments have historically also created interesting opportunities for long-term investors” – By @Darkfost_Coc pic.twitter.com/q5pesCl70H
— CryptoQuant.com (@cryptoquant_com) May 25, 2026
The gauge fell to -147,000 BTC, a level last seen in December 2023.
Visible demand is calculated as the difference between the issuance of new coins and supply that has remained inactive for more than a year. The metric shows whether the pace of accumulation is sufficient to absorb new bitcoins on the network.
The expert said demand continues to shrink. He stressed that without a revival in the spot market, it will be difficult for the leading cryptocurrency to sustain gains on futures alone.
“Derivatives amplify price moves, but a sustainable bull trend requires real demand for the asset. Derivatives do not create a stable foundation,” Darkfost noted.
He added that periods of sharp demand drops and pessimism have historically created opportunities for long-term investors.
Market bottom
Joao Wedson, founder of the Alphractal platform, noted differing readings of investment efficiency (Sharpe ratio) for the two largest cryptocurrencies.
Bitcoin and Ethereum’s Sharpe Ratios are behaving differently.
But both are showing the current market sentiment very clearly.
While Bitcoin’s annualized Sharpe Ratio is negative, indicating lower return efficiency relative to risk in the short term, Ethereum’s is sitting right… pic.twitter.com/oulOsDmiut
— Joao Wedson (@joao_wedson) May 22, 2026
Bitcoin’s annualised Sharpe ratio has turned negative. This indicates that returns do not justify the risks in the short term. Ethereum’s reading is neutral—around zero.
According to the expert, the current values point to strong selling pressure and a lack of risk premium. Historically, however, a prolonged period with the ratio below zero has signalled the formation of a market bottom.
Wedson stressed that the current setup does not guarantee an immediate price reversal. Even so, the market is already in a zone of extreme pessimism and high stress.
He advised monitoring risk behaviour daily, as important signals often appear in metrics before they do on the price chart.
Meanwhile, an analyst known as maartunn recorded heavy selling on Coinbase. According to him, the exchange faced its strongest selling pressure since February.
🚨 Coinbase is seeing its STRONGEST SELLING PRESSURE since February. pic.twitter.com/AQbZ4FVmGF
— Maartunn (@JA_Maartun) May 22, 2026
Bitcoin reversal signal
On-chain analyst MorenoDV recorded a drop in bitcoin’s fund flow ratio on Binance. The reading fell to 0.010–0.012.
Bitcoin’s Fund Flow Ratio Returns to the Zone That’s Marked Every Major Turn
“Bitcoin is approaching a decision zone: either demand remains weak, and the compression reflects apathy, or sell-side exhaustion becomes the foundation for the next recovery phase.” – By @MorenoDV_ pic.twitter.com/mox08h9etV
— CryptoQuant.com (@cryptoquant_com) May 22, 2026
This indicator measures the ratio of the leading cryptocurrency’s volume on the exchange to the total number of transfers on the bitcoin network. It shows what share of market activity comes from exchange operations.
Since 2018 the metric has returned to this range five times. Historically, such periods have preceded major trend changes.
A low reading means investors are using exchanges less for trading. That reduces selling pressure and often points to the formation of a price floor. Analysts observed a similar setup in early 2019 and in 2020 before the market’s strong advance.
In MorenoDV’s view, the current backdrop signals a phase of uncertainty. Either buyer interest remains absent, or seller exhaustion becomes the base for a new rally.
Ethereum’s rise
Trader Michaël van de Poppe said current Ethereum prices are suitable for accumulating long-term positions. In his view, the asset remains a crucial infrastructure layer for the entire on-chain ecosystem despite lagging the market in recent years.
This is the area to accumulate #Ethereum.
It’s been lagging behind for years, but it’s the infrastructure layer that is required for almost everything within the on-chain ecosystem.
The past months, the price of Ethereum has gone down primarily due to macroeconomic reasons.… pic.twitter.com/o3yUKvycPP
— Michaël van de Poppe (@CryptoMichNL) May 25, 2026
He linked the recent decline in the price of the second-largest cryptocurrency to macroeconomic factors. He noted an inverse correlation between the decentralised-finance sector and government bond yields.
When the latter rise, investor interest in DeFi wanes. That weighs on Ethereum, the network’s base asset. Van de Poppe, however, expects this trend to change.
From a technical perspective, the price is approaching a strong support level on higher timeframes. He earlier predicted a correction after the price was rejected at 0.0325 BTC. He now views the current price range as a favourable entry point.
On May 23, the leading cryptocurrency fell below $75,000. The decline comes as traditional markets test their highs.
Рассылки ForkLog: держите руку на пульсе биткоин-индустрии!