


Crypto price analysis: Emerging patterns point to uncertainty
The leading RoboForex analyst Dmitry Gurkovsky discusses the possible scenarios for Bitcoin price movements and for several popular altcoins.
Cryptocurrencies are correcting again, and on the charts of many assets triangles are forming. The emergence of such patterns on the market points to uncertainty about the next move.
For a rally, it is important to see a breakout of the pattern’s upper boundary, but if bearish pressure grows and they manage a confident decline with a breakout of the lower boundaries of the patterns, one could consider the continuation of the downward correction. For BTC/USD, a drop to $8,000 is possible, which would indicate the completion of the formation of the bullish pattern.
Bitcoin
On the daily chart, Bitcoin quotes continue to correct between the levels of $11,200 and $10,100. In general, buyers have managed to defend an important support area, and until the price falls below $10,000 there is no reason to anticipate further downside movement.
On the other hand, buyers must show a breakout of the level $11,200, confirming the overcoming of the upper boundary of the Bollinger Bands and the resumption of the bullish impulse. In this case, one could anticipate reaching the level $12,495, the breakout of which would indicate growth toward the level $14,230.
If buyers fail to hold the $10,000 line, its crossing will indicate the potential drop to $7,865. Near this level one should expect the completion of the bullish pattern “5-0”.
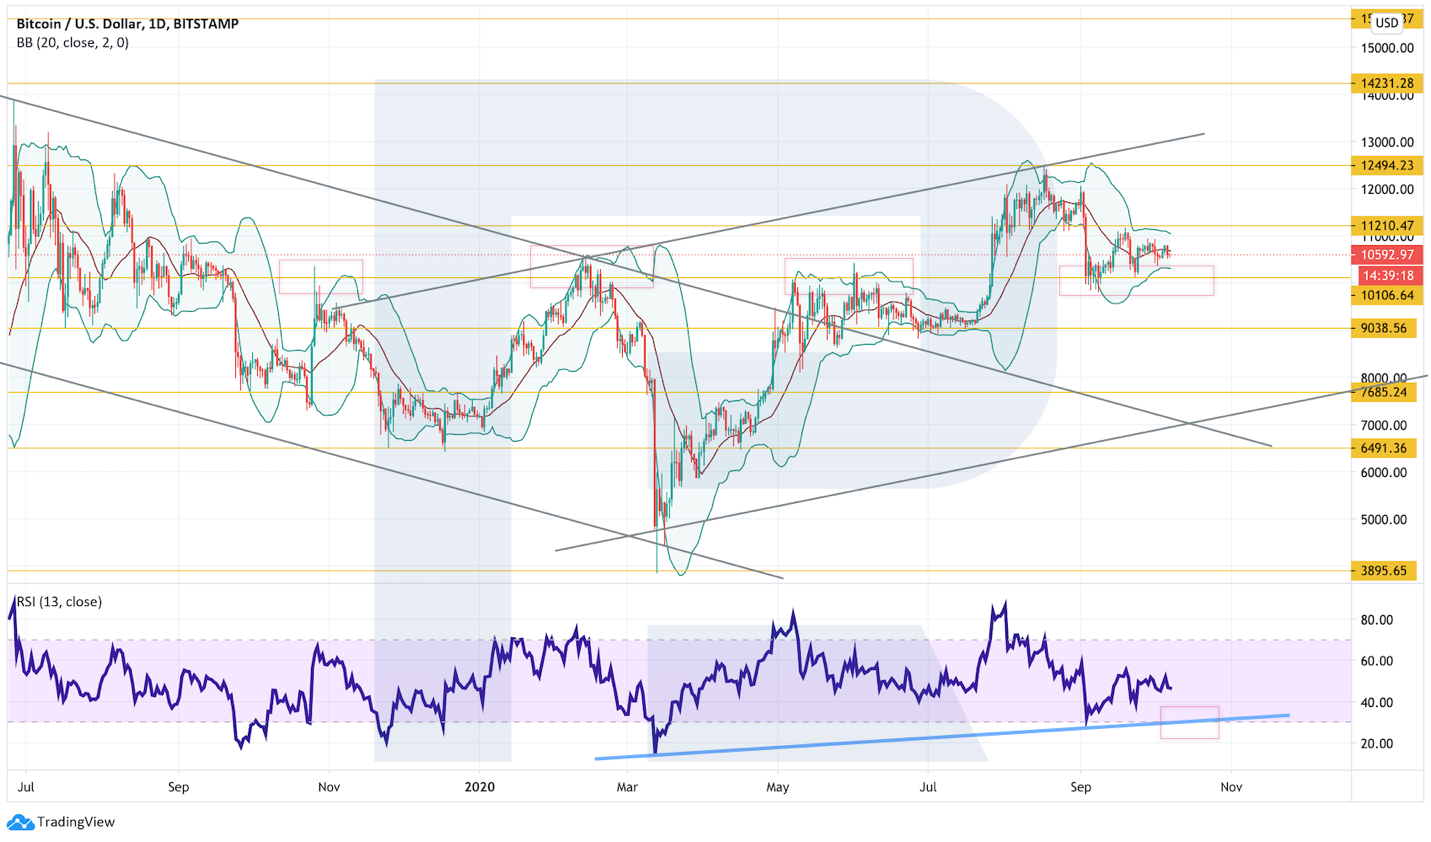
Daily BTC/USD chart from TradingView.
On the 4-hour chart, BTC/USD quotes are confined within the “Triangle” pattern, indicating persistent uncertainty. In the near term, expect increased volatility and a move outside its bounds. With a breakout of the pattern’s upper boundary and the price above $10,970, one can expect the halt of the decline and the start of growth within the “Triangle” pattern. The target is $12,070. An additional bullish signal would be a rebound from the RSI support line.
A bullish scenario could be negated by a break of the lower boundary of the pattern with the price settling below $10,100, in which case one could talk about a drop to $9,040 as the pattern plays out.
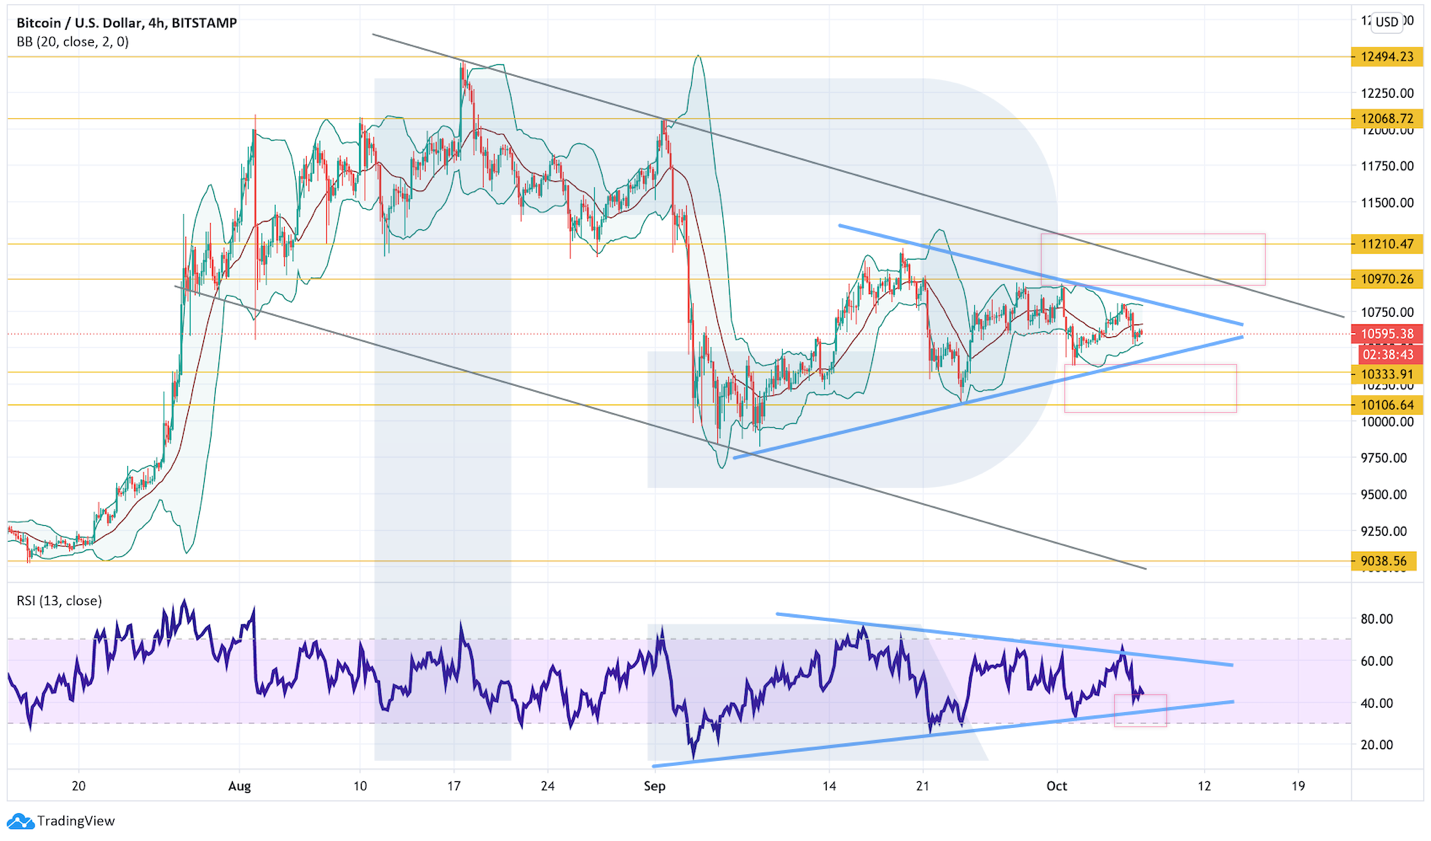
4-hour BTC/USD chart from TradingView.
Ethereum
ETHUSD on the daily chart continues to rebound from the middle line of the Bollinger Bands, showing selling pressure. However, do not rule out one more attempt by sellers to push the price down to $306. Only after that can a rebound and a start of growth toward the potential target at $490 be considered. A bounce from the RSI support line would support this scenario, where the previous test led to a price rebound upward.
An alternative to this scenario could be a break below the lower boundary of the ascending channel with the price staying below $300, in which case one should consider stopping the bullish “5-0” pattern and further falling to the $208 level.
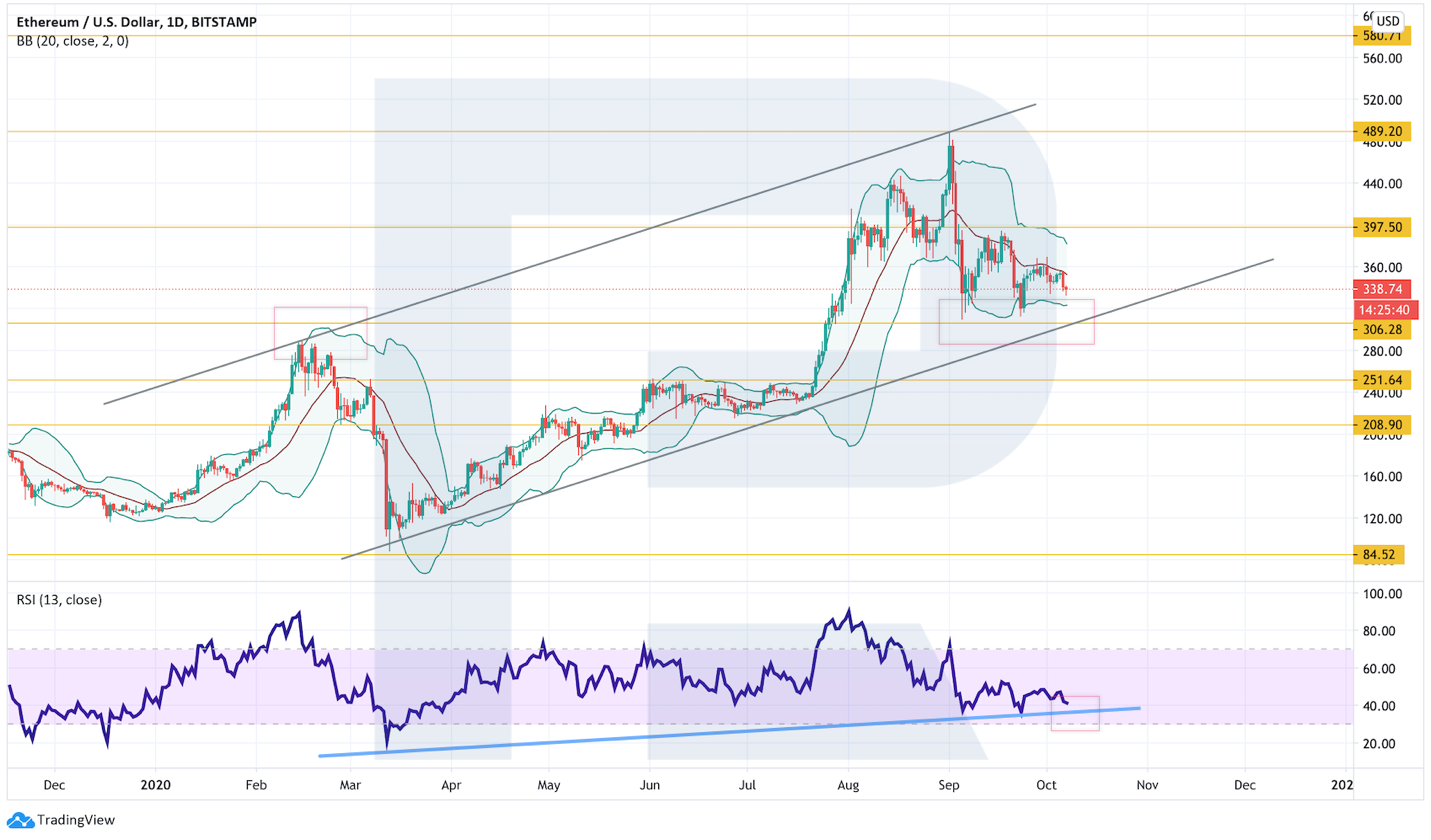
Daily ETH/USD chart from TradingView.
On smaller timeframes, buyers have failed to push the price to complete a reversal pattern “Double Bottom”. Currently, prices are moving within the “Triangle” pattern. There was a rebound from the RSI support line, so don’t rule out attempts to move higher with a breakout of the upper boundary of the “Triangle”. Once buyers push the price above $397, a continuation toward $490 within the “Triangle” pattern could be expected.
An negation of the bulls’ positive variant would be a break of the lower boundary of the pattern, in which case a continuation of the decline toward $250 could be anticipated.
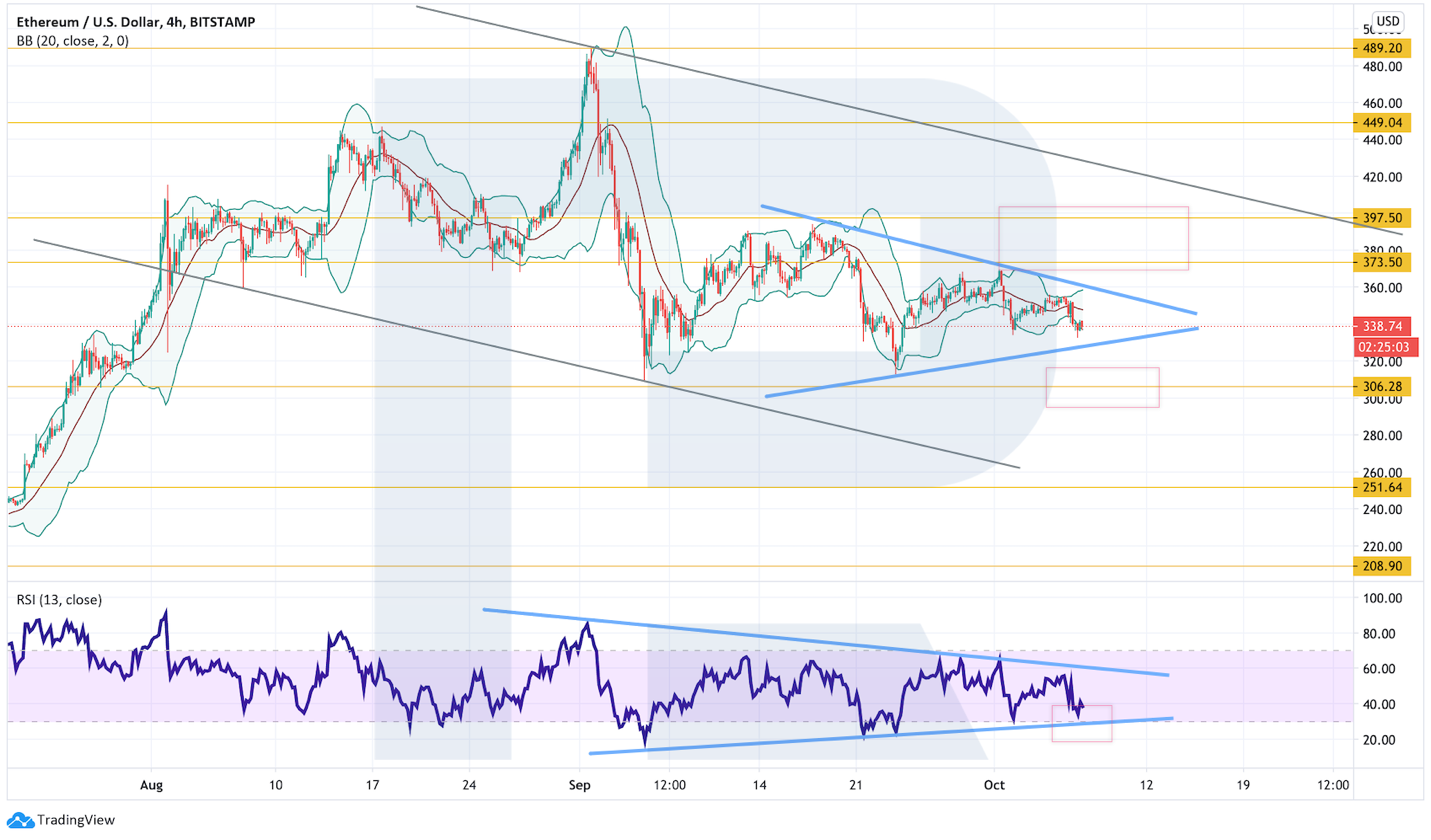
4-hour ETH/USD chart from TradingView.
Litecoin
The Litecoin on the daily chart continues to move within the formation of the reversal pattern “Head and Shoulders”. From current levels, an upside rebound toward the range of $52-$55 is expected, where the right shoulder of the pattern is anticipated to complete. A rebound from the RSI support line would support this scenario.
However, to invalidate this pattern, a break of $69 is needed, after which growth toward $85 could be discussed. An opposite scenario would be negated by breaking the support region with the price settling below $38.50, which would indicate further fall toward $24.80.

Daily LTC/USD chart from TradingView.
On the 4-hour chart LTC quotes rebound from the upper boundary of the descending channel. There is a risk of a move down to $42.00, the breakout of which would indicate further decline toward $38.50.
Supportive of this scenario is another rebound from the RSI line. As soon as buyers push the price up and manage to hold above $49.00, growth to $52.00 could be considered, and a breakout of that level would indicate a move above the downtrend channel.

4-hour LTC/USD chart from TradingView.
XRP
The XRP quotes are attempting to breach the upper boundary of the Bollinger Bands. A breakout would signal the end of the downward correction and further growth toward the first target at $0.3020. A strong signal in favor of this scenario is a rebound from RSI support. Confirmation would be a breakout above the upper boundary of the downward channel with the price above $0.2605.
A breakout below the level of $0.2180 could negate this scenario, indicating a crossing of the lower boundary of the ascending channel and further decline toward $0.1675.
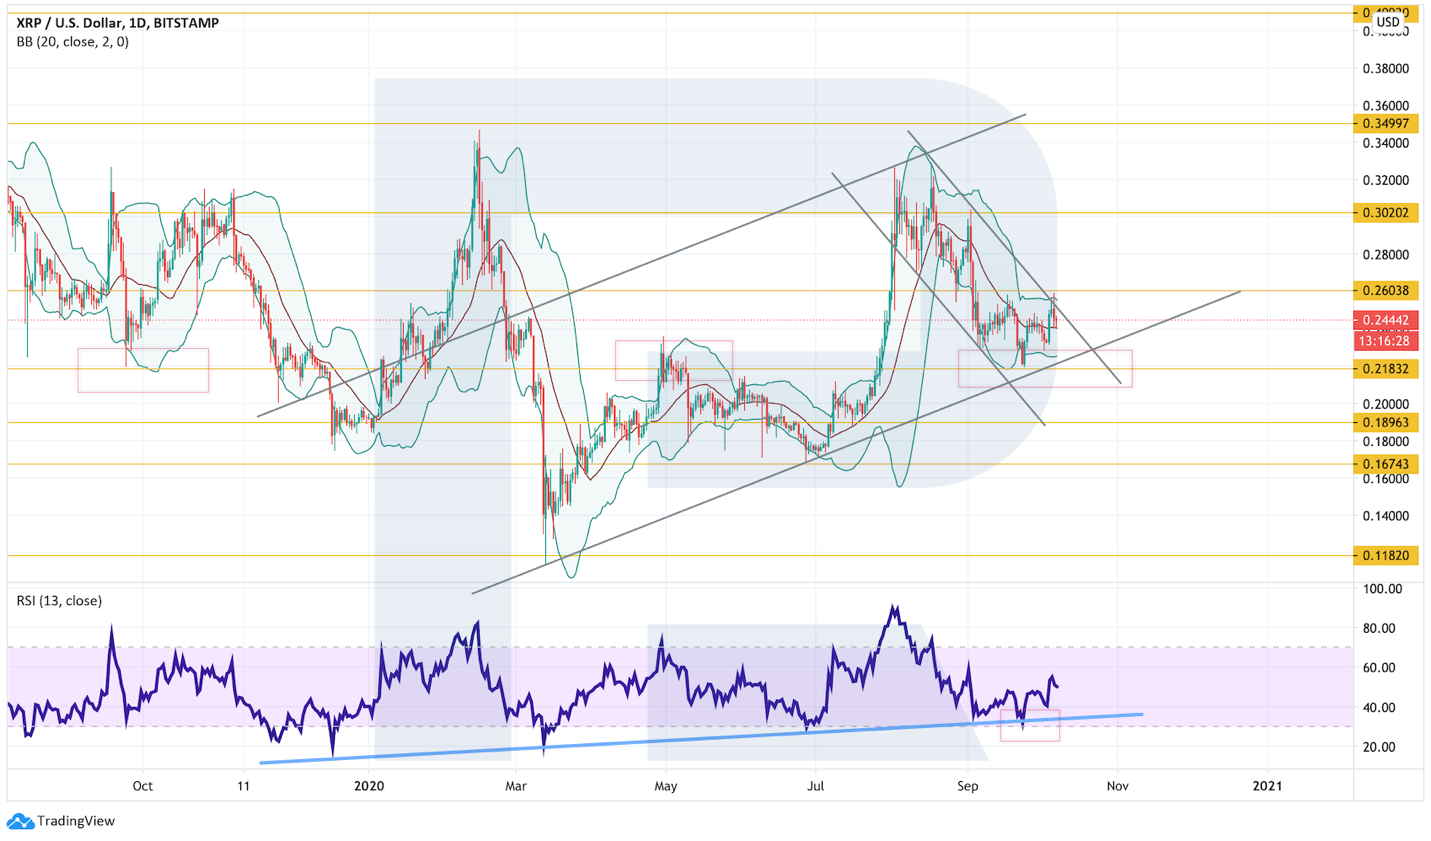
Daily XRP/USD chart from TradingView.
On smaller timeframes, the asset’s quotes are attempting to climb within a distorted Head-and-Shoulders pattern in inverted form. The price is testing the breached neckline, and there are every chances to see its rise from current levels. A rebound from the RSI support would support this scenario. Its negation would be a break of the $0.2185 level, in which case a further drop toward $0.1895 could be expected.
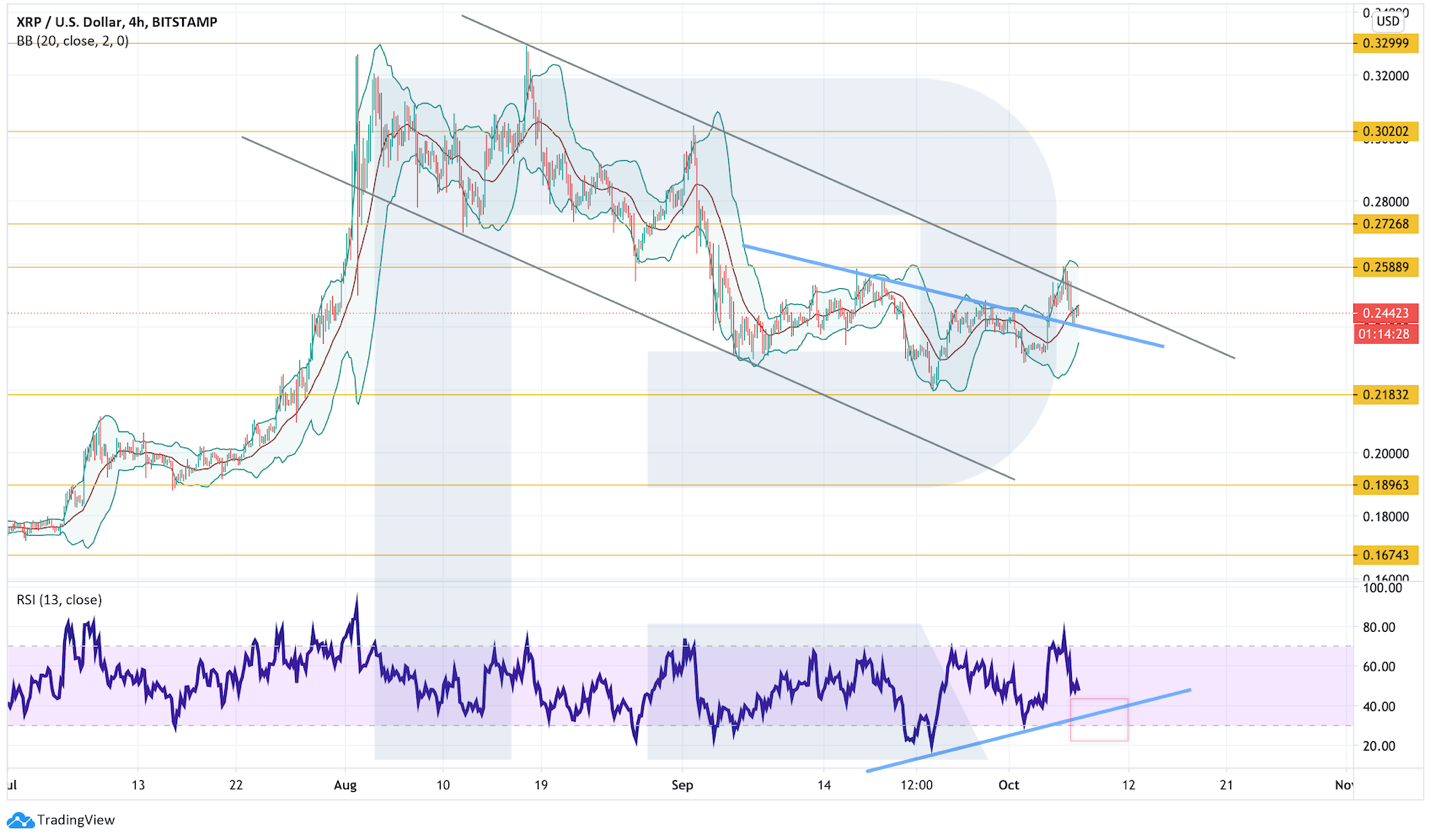
4-hour XRP/USD chart from TradingView.
EOS
The EOS on the daily chart is rebounding from the support area and the lower boundary of the ascending channel. A strong signal in favour of growth toward the potential target at $3.95 is a breakout of the downward-trending line on the RSI indicator, which would indicate the potential to overcome the upper boundary of the descending channel. An opposite scenario would be a break of the support region with the price holding below $2.21, which would justify continuing decline toward the target at $1.40.
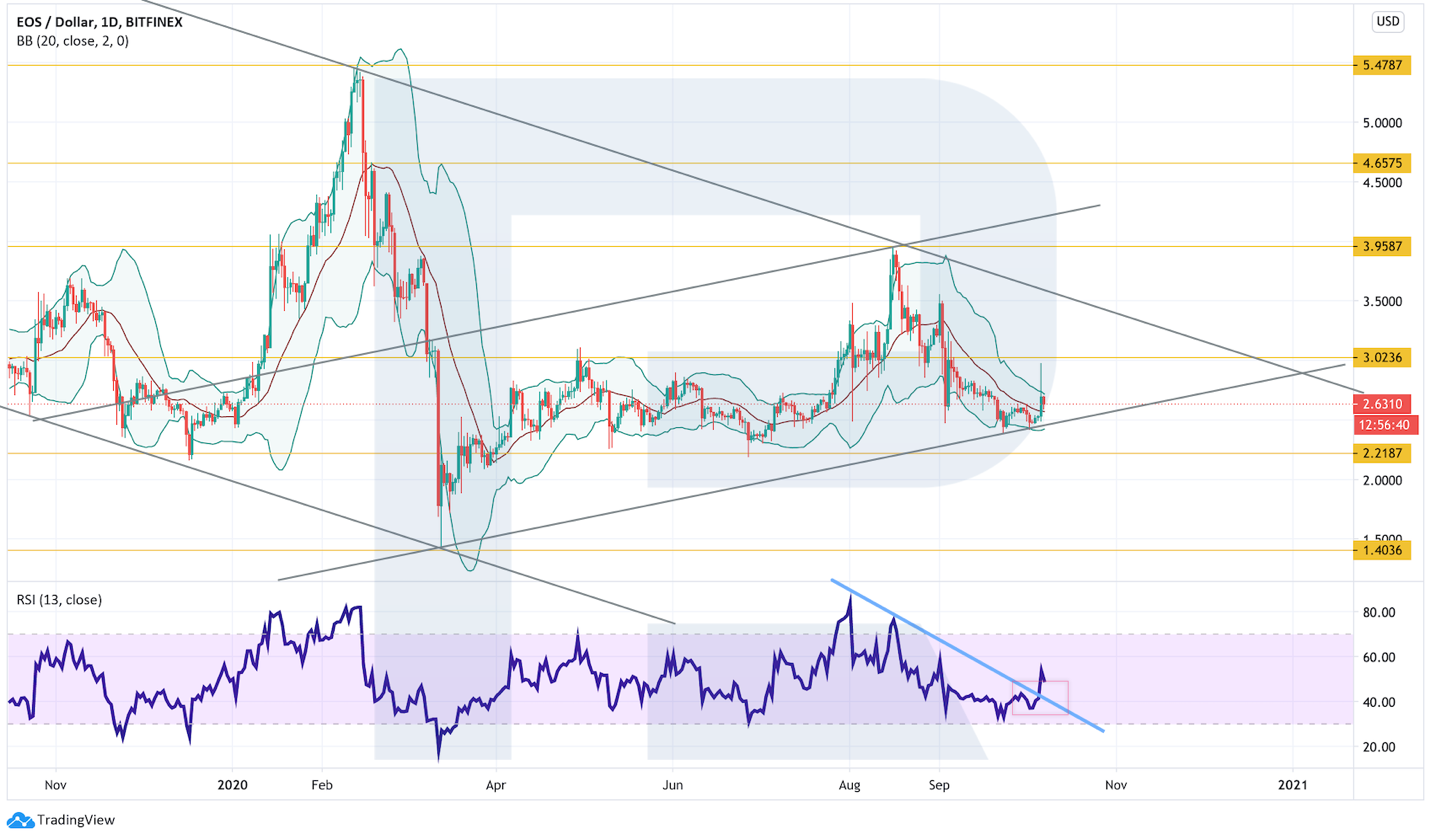
Daily EOS/USD chart from TradingView.
On the 4-hour chart, the price left the bounds of the reversal pattern “Wedge”. A test of the broken boundary and continued rise toward the target at $3.95 is expected. A strong signal in favor of this scenario is a breakout of the RSI trend line. The bullish case could be negated by a drop and a break below $2.38, after which a drop toward $2.21 could be expected.
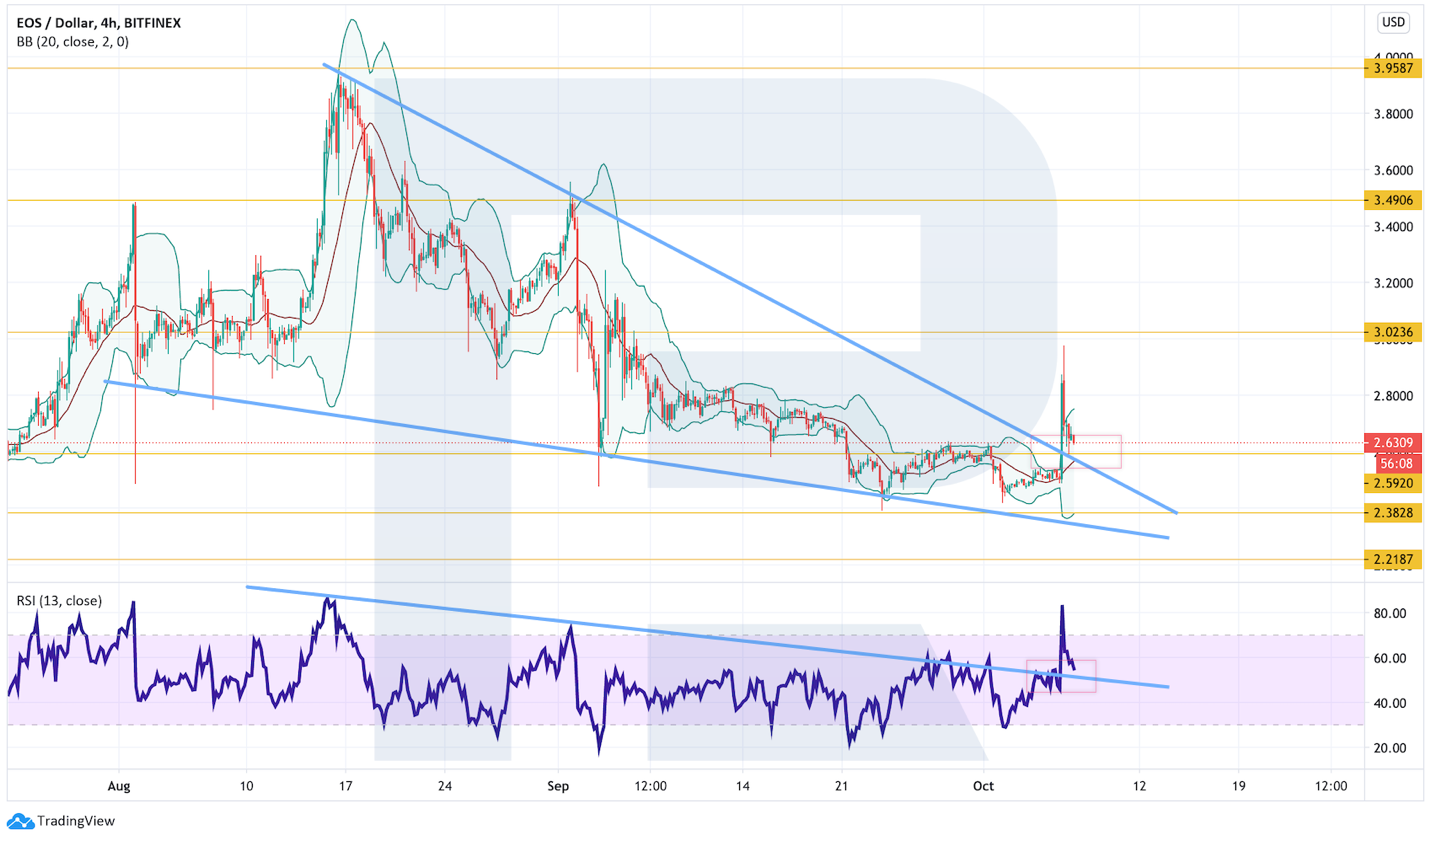
4-hour EOS/USD chart from TradingView.
Subscribe to ForkLog news on Telegram: ForkLog FEED — the full feed of news, ForkLog — the most important news and polls.
Рассылки ForkLog: держите руку на пульсе биткоин-индустрии!