


Based on indicators derived from analysis of the collapse of FTX, experts from Glassnode judged some caution warranted regarding Huobi’s status and its standing relative to Coinbase and Binance.
Analysts explained that attention to these platforms reflects active discussions in the community.
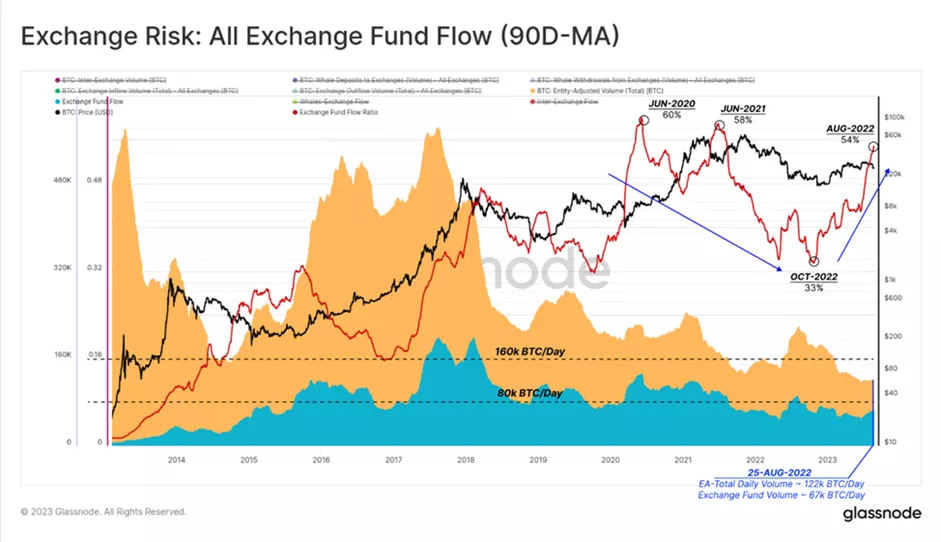
At the outset of the briefing, experts offered their view on the dominance of CEX in the Bitcoin ecosystem.
According to calculations, deposits and withdrawals from crypto exchanges account for about 54% of the on-chain value transferred into digital gold (67,300 BTC out of 122,000 BTC). The indicator has been rising since October 2022, signalling a market recovery after the collapse of FTX.


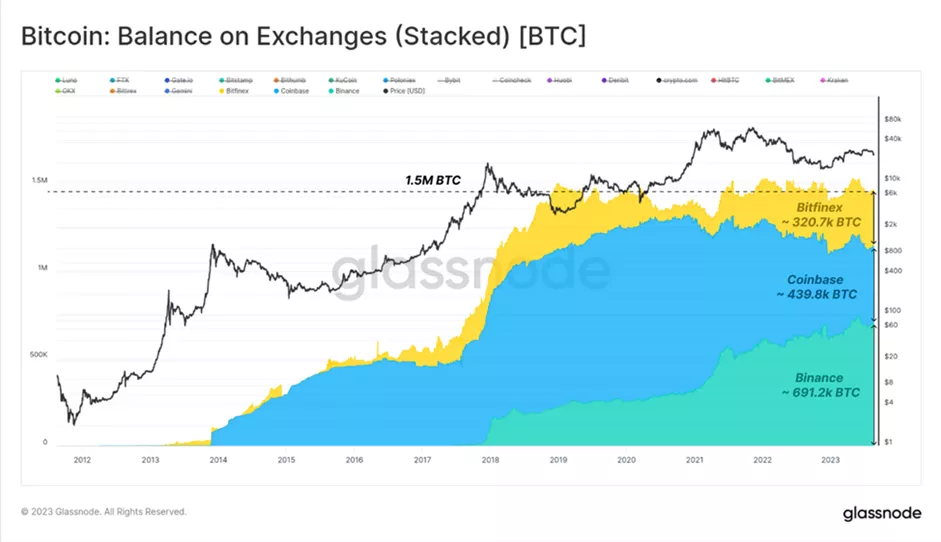
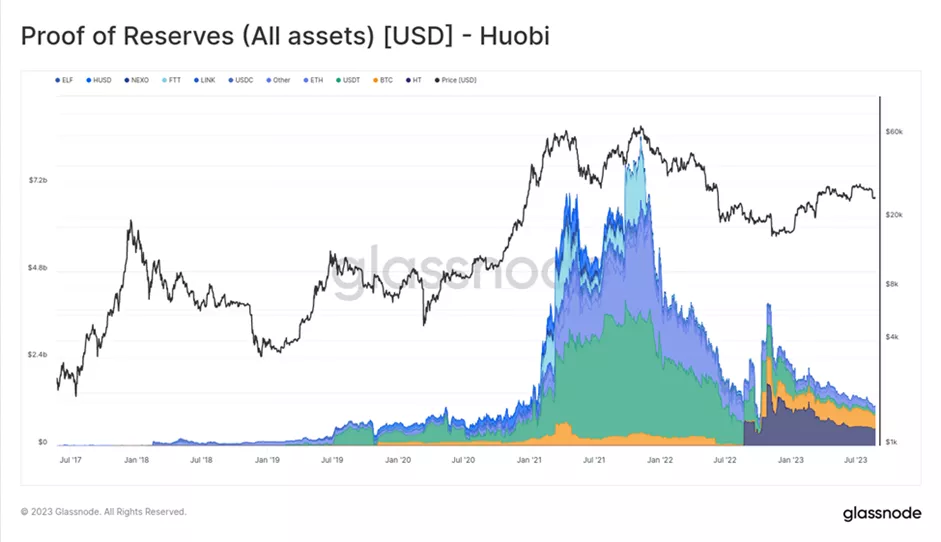
A similar situation is observed against the backdrop of exchanges’ balances falling to a five-year low of 2.256 million BTC.
Since the beginning of 2019, the dominance in this regard has been held by three players — Binance, Coinbase and Bitfinex.
Their current balances are as follows:
- Binance — 691,200 BTC;
- Coinbase — 439,800 BTC;
- Bitfinex — 320,700 BTC.
Analysts developed three indicators to help identify periods when potential problems may be forming at centralized platforms:
- Reshuffling Ratio — the share of the exchange’s balance that is processed within it over a given period;
- Reliance Ratio — the degree to which the platform’s balance moves to other venues/from them (inter-exchange transfers);
- Whale Withdrawal Ratio — the measure of Bitcoin withdrawals by whales from CEXs.
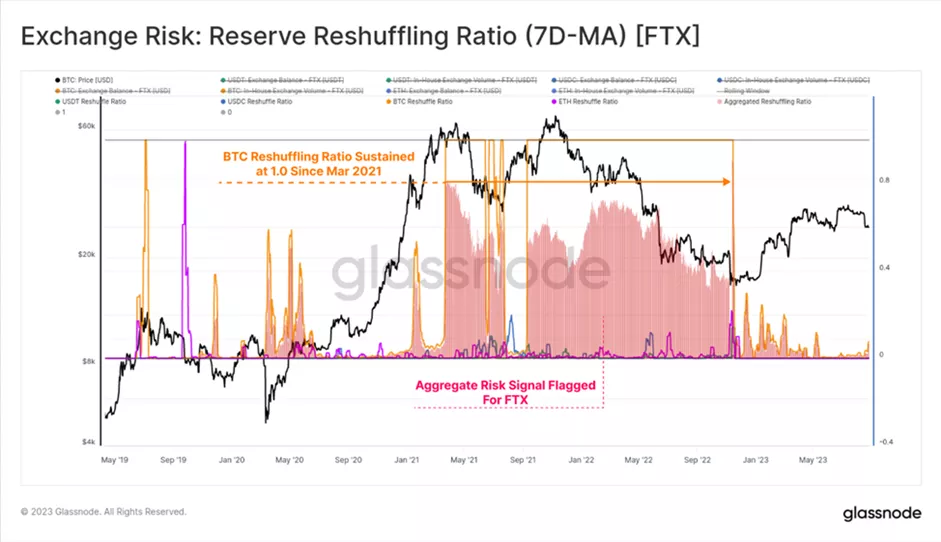
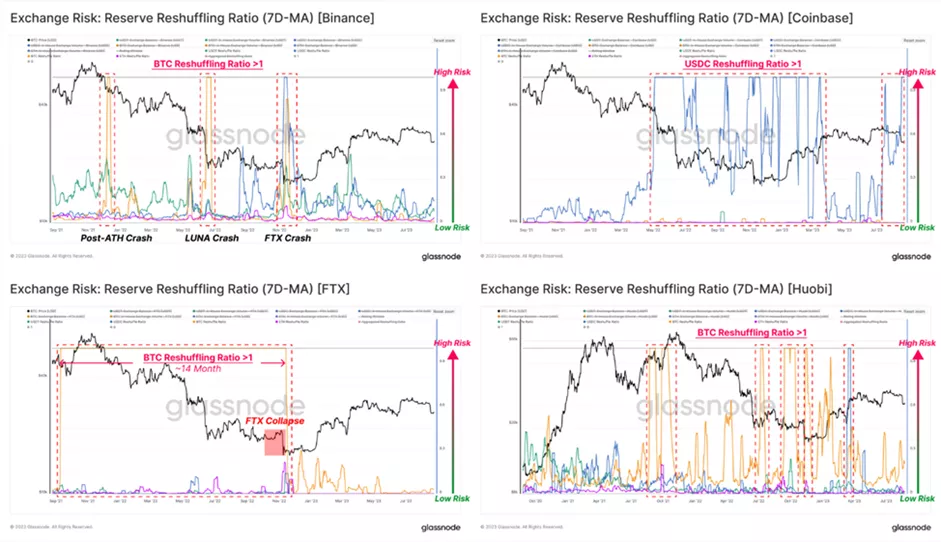
The idea of the Reshuffling Ratio is to identify situations where more than 100% of the exchange’s balance moves to other addresses within the cluster over a seven-day period. If such a pattern persists for a long time and/or across several asset types, it may be a warning sign of mismanagement of funds, according to the specialists.
In the case of FTX, this metric reached the threshold from March 2021 until the collapse in November 2022.
The Reshuffling Ratio for Binance (shown in the illustration below, top left) exhibits sharp spikes across all assets, with a quick return to normal during periods of heightened volatility. Glassnode interprets such behaviour as reflecting a wave of new deposits and withdrawals. For Huobi (bottom right), a similar pattern is evident.
The metric for Coinbase (top right) attracts attention only with respect to USDC, which is linked to the exchange’s role as a gateway for the stablecoin.
The graphic below compares the aggregate Reshuffling Ratio coefficients for four exchanges (including FTX) across four assets. A threshold value of 5% of the balance is used to mark potentially high-risk events.
From this perspective, Binance and Coinbase show only minimal internal outflows of their balances. FTX, by contrast, stands out for obvious reasons.
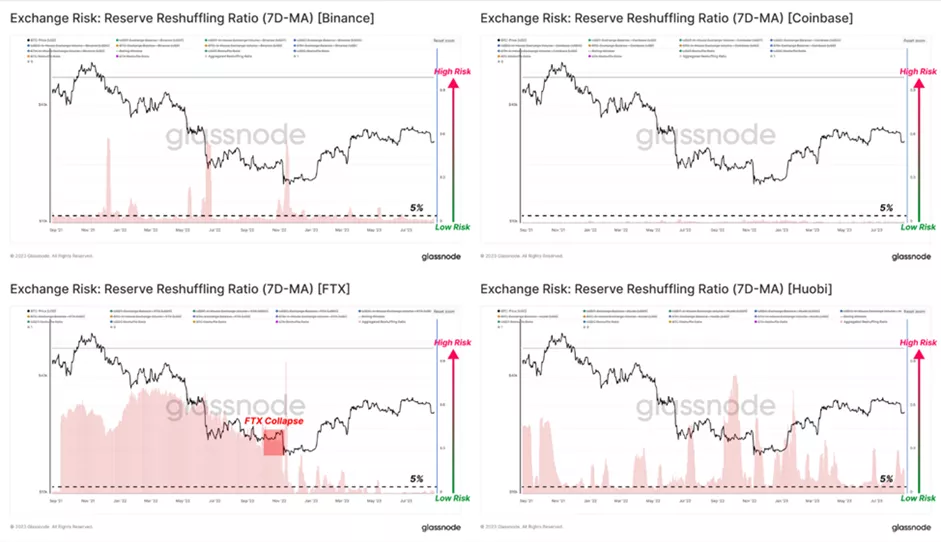
According to the analysts, Huobi can be assessed somewhere between FTX and Coinbase and Binance. They pointed to the potential for the metric to grow, given the gradually declining balance of assets on the exchange.
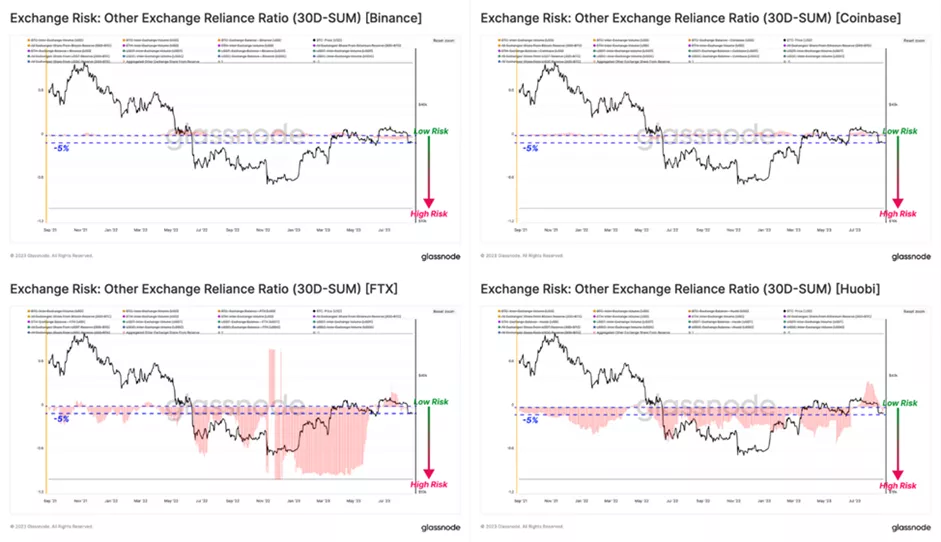
Another potential risk indicator for a CEX could be the situation of regular transfers of a substantial portion of the balance to another exchange or from it. It is characterised by the Reliance Ratio indicator. Such a phenomenon may indicate a high degree of trust or interdependence of liquidity between venues, analysts explained.
Large negative values of the metric indicate a rapid outflow of funds from the exchange to a counterparty, which can raise concerns if the trend persists for a prolonged period.
Binance (top left). All assets show a neutral and near-zero Reliance Ratio. This suggests that funds moving to or from other exchanges are small relative to the balance on Binance. The USDC figure stands out, explained by competition with Coinbase.
Coinbase (top right). As with Binance, all assets demonstrate a neutral Reliance Ratio. Unsurprisingly, the USDC values are higher for the aforementioned reasons.
FTX (bottom left). The Reliance Ratio is deeply negative for all four assets well before the collapse. This confirms withdrawals by investors and Alameda of assets to other platforms.
Huobi (bottom right). Analysts noted a relatively large negative Reliance Ratio across all assets, implying net transfers from Huobi to external exchanges.
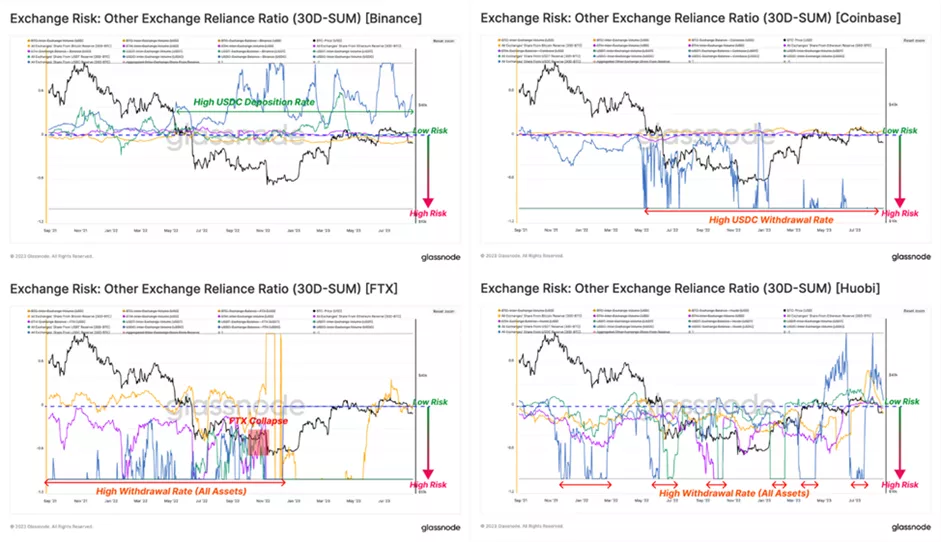
The aggregated Reliance Ratio indicates that Binance and Coinbase are largely independent of other exchanges. This contrasts with the situation at FTX and Huobi, where these values are deeply negative.
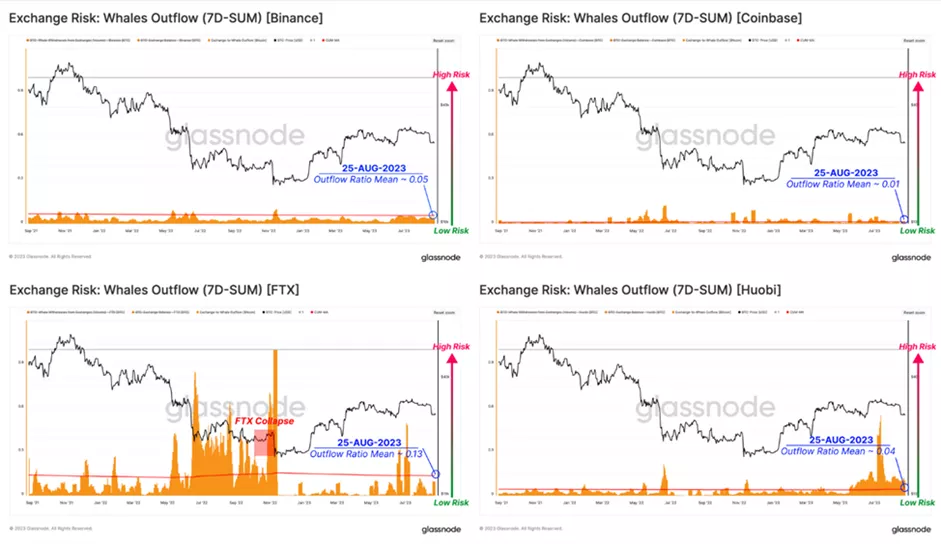
Whale Withdrawal Ratio demonstrates the influence of whales on the pace of withdrawals from platforms. The metric is calculated as the ratio of total weekly outflows by large players to the exchange’s Bitcoin balance. In other words — the percentage of reserves withdrawn by whales over the last seven days.
Analysts also consider the all-time average Whale Withdrawal Ratio as a long-term guide.
Both Coinbase and Binance show an extremely low Whale Withdrawal Ratio over the past two years, and the long-term average remains below 5%.
For FTX the spike in the metric began with the collapse of Terra and Three Arrows Capital, staying high up to the collapse of the exchange itself.
For Huobi, analysts observe a model with relatively low risk up until June 2023. In recent months there has been a sustained surge in the Whale Withdrawal Ratio. Analysts emphasised that partly the dynamics are explained by the platform balance drawdown, which “in itself is an indicator of heightened awareness among whales”.

In November 2022, Binance was among the first to introduce a Proof-of-Reserves function designed to ensure transparency of user funds storage. The team used Merkle Tree to verify on-chain data.
In December, a representative SEC Paul Manter urged investors to be “very cautious” about audits of reserves at crypto platforms. In his view, such checks do not always reveal the company’s true financial state.
In February, the Binance team implemented in the system a ZK-SNARK tool to enhance security and privacy. Two months later, OKX followed suit.