The debut launch of spot bitcoin ETFs in the United States was a landmark for the crypto industry and TradFi. Contrary to sceptics, the new vehicles quickly gained popularity, as reflected in aggregate trading volumes, cumulative inflows and the multi-billion AUM of exchange-traded funds.
The scale of institutional interest in ETFs points to their significant impact on price action and other key parameters of the digital-asset market. For instance, Bitwise CIO Matt Hougan is convinced that large players create “counter-cyclical flows” that help reduce volatility.
ForkLog examines how a maturing market is shaping its cycles, and whether price forecasts for bitcoin based on historical data are still worth relying on.
Are cycles fading?
Bitcoin’s market structure is changing, and the familiar four-year cycles may no longer be as relevant.
Mitchell Askew, an analyst at Bitcoin Magazine Pro and Blockware Solutions, argues that with the arrival of institutional investors, the “parabolic bitcoin growth model” followed by deep pullbacks is shifting. Meanwhile, the mining industry is becoming more efficient and stable, which also affects supply and price trends.
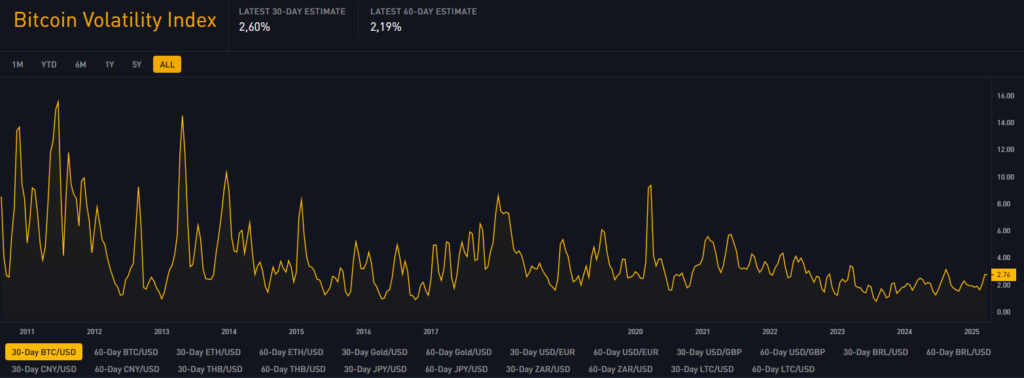
The chart below shows how the first cryptocurrency’s volatility has gradually ebbed over time:
Halvings reduce miners’ rewards, creating a supply shortfall. They once also triggered sharp price surges, often followed by 70%+ corrections. That factor now matters less, but institutional investors are multiplying. They make the market more stable, while increasing its sensitivity to macroeconomic forces.
According to Askew, spot ETFs and allocations by corporations stabilise demand for bitcoin, reducing the likelihood of abrupt price swings. Unlike retail traders, who often buy at the peak of euphoria and sell in panic during corrections, institutions typically “distribute” into rallies and accumulate on dips.
He also notes that since the debut of bitcoin ETFs more than a year ago, price action has been more restrained: longer periods of consolidation now precede renewed advances. This suggests bitcoin increasingly behaves like a traditional financial asset, shedding traits of a highly volatile speculative instrument.
What role do miners play?
Many are used to reading rising hashrate as a bullish signal, yet “the reality is far more nuanced,” Askew stresses.
“In the short term, an increase in the metric can be a bearish factor because it leads to heightened competition among miners and the sale of more bitcoins to cover electricity costs. However, in the long term, higher hashrate reflects increased investment in infrastructure and improved network security,” the expert explained.
Another important observation: increases in hashrate lag price growth by 3–12 months. A sharp rise in bitcoin’s price boosts mining profitability, drawing capital into infrastructure. But deploying new rigs and fitting out facilities takes time, so hashrate growth arrives with a delay.
Askew also noted that hardware efficiency has plateaued, which could materially affect the mining sector and bitcoin’s supply structure.
If you’re thinking about Bitcoin mining, you MUST watch this clip.
There’s a trend developing in mining hardware that will bode extremely well for miners:
— Longer machine lifespans — Slowing hashrate growth — Increased lag between price growth and hashrate growth
In bitcoin’s early years, each new generation of mining devices usually brought significant efficiency gains. That forced miners to refresh equipment every year or two to keep up.
“Today, new models are only about 10% more efficient than their predecessors, allowing machines to remain profitable for four to eight years. That reduces pressure on miners to constantly invest in new equipment,” the expert observed.
So, should we expect a rally this year?
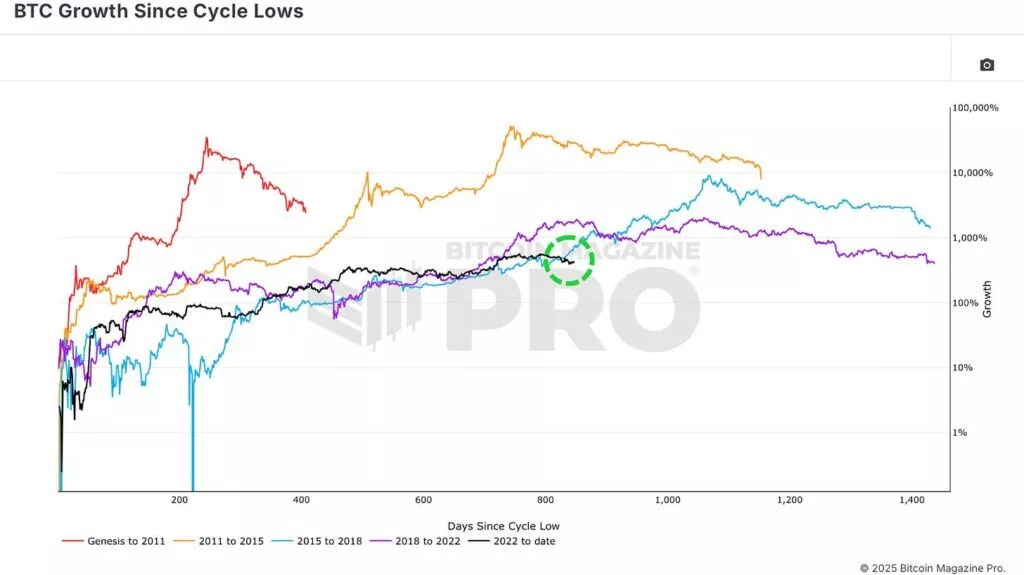
Bitcoin Magazine Pro lead analyst Matt Crosby notes that the price path in the current market phase shows “striking similarities” to the 2015–2017 cycle, when bitcoin first approached $20,000.
“However, the recent correction was the first significant deviation from the 2017 pattern. If bitcoin had continued to follow that cycle, it should have reached new all-time highs over the past month [February],” the expert noted.
Instead, Crosby observes, bitcoin moved sideways, periodically falling in price.
“This may point to a weakening correlation with past trends,” he explained.
The current bitcoin price trajectory deviating from patterns of past market cycles (highlighted in green). Data: Bitcoin Magazine Pro.
Despite the recent divergence, the historical correlation between the current bitcoin cycle and the 2017 patterns “remains remarkably high.” Throughout this year it has been around 92%, the expert observed.
“The recent price divergence reduced it slightly — to 91%, which is still an extremely high figure for financial markets,” Crosby noted.
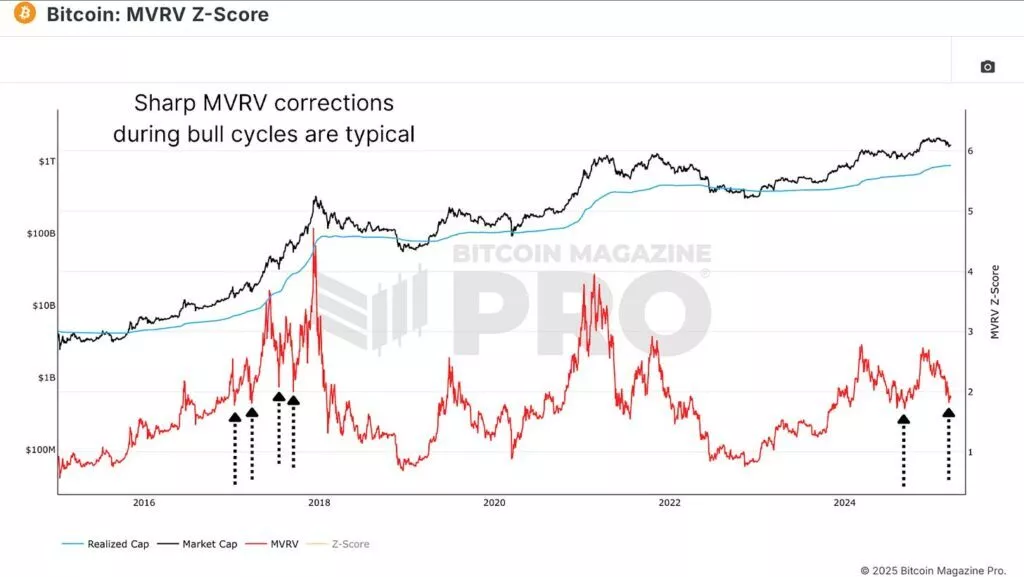
The chart below illustrates a recent decline in MVRV, also reflecting bitcoin’s correction after reaching an ATH.
“However, the metric’s values remain structurally similar to the 2017 cycle — its early bull rally. Several sharp corrections follow, and as a result the correlation remains around 80%,” the analyst explained.
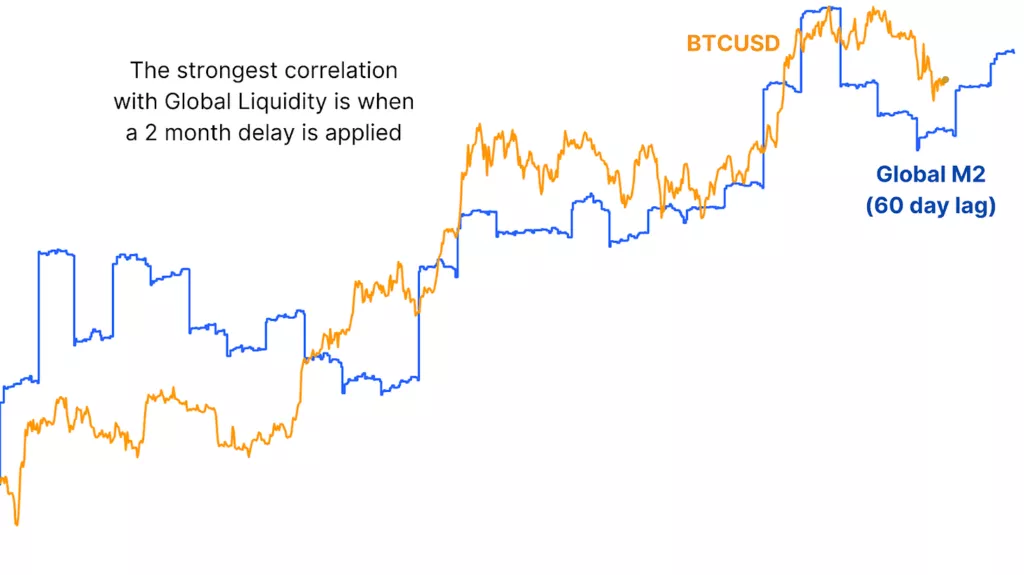
Crosby also noted that bitcoin’s price shows a close correlation with global liquidity — the broad money stock across major economies.
“However, historical analysis shows that changes in liquidity often take about two months to affect bitcoin’s price dynamics,” the expert explained.
Global M2 dynamics exert a delayed influence on bitcoin’s price. Data: Bitcoin Magazine Pro.
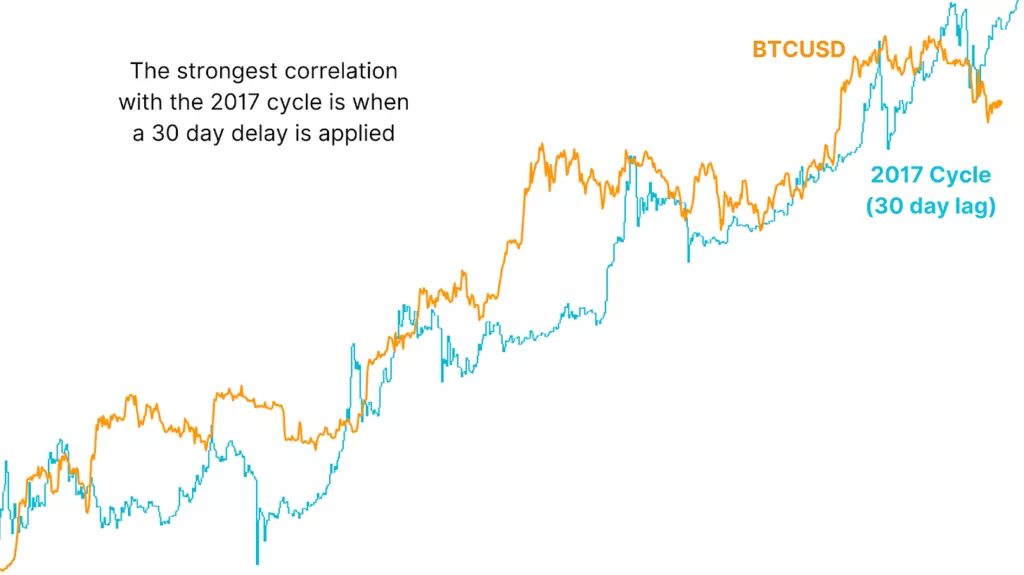
“If you apply a 30-day lag to bitcoin’s price relative to the 2017 phase, the correlation rises to 93%, which is the highest reading recorded between these two cycles,” Crosby stressed.
According to him, the “lagged model” points to the likelihood of bitcoin returning “to the 2017 trajectory.” That could mean a powerful new rally is close.
What lies on the horizon?
CryptoQuant observes that a range of on-chain metrics point to “serious turbulence” in the short and medium term.
Among the indicators the researchers considered:
IFP;
Bitcoin CQ;
MVRV;
NUPL.
However, the experts stressed that none of the above metrics indicates a “heated or cyclical” level.
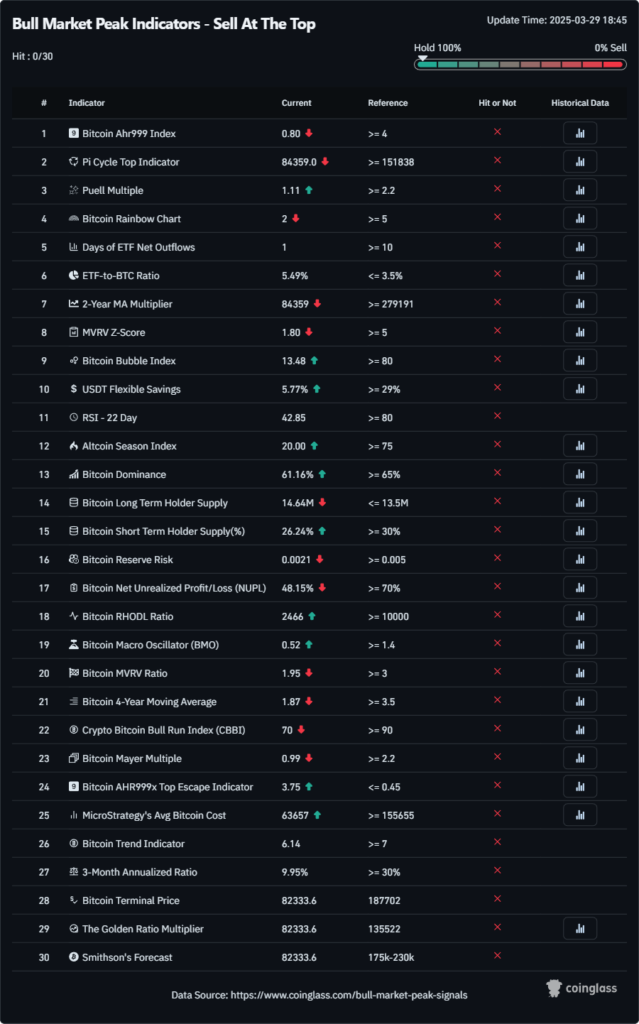
Indicators presented on CoinGlass likewise do not point to the peak of a bull phase or justify active realisation of unrealised profits (or, perhaps, losses).
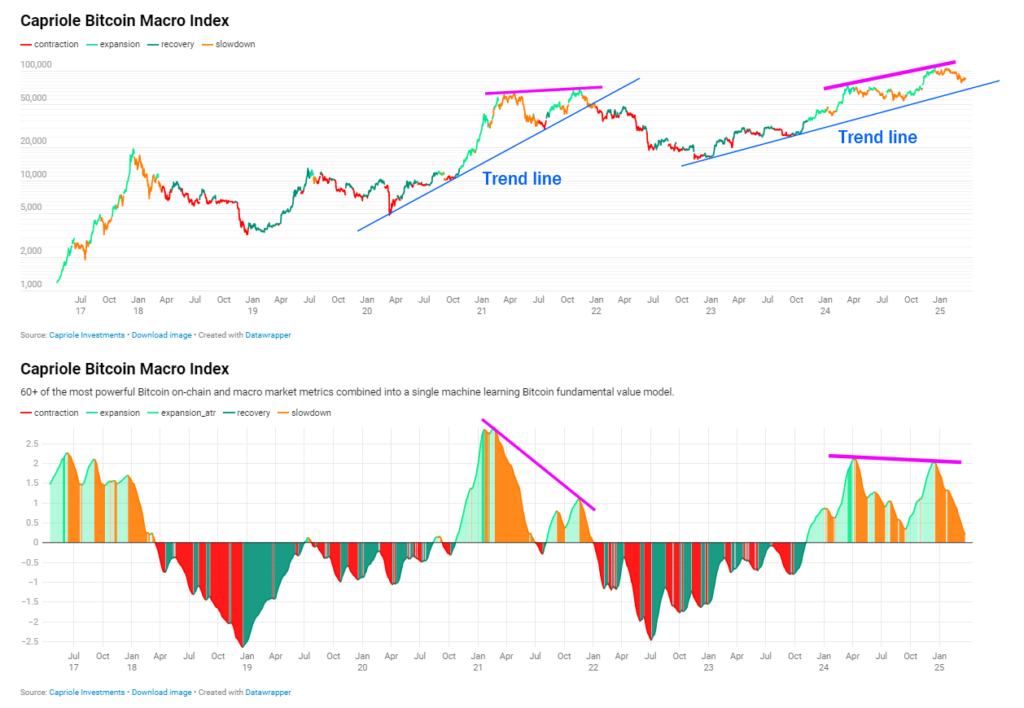
Created by Edwards in 2022, the index uses machine learning to analyse a large number of indicators. According to the description, they “provide a clear picture of bitcoin’s relative value across historical cycles.” Price data and TA are not included in the metric.
Since late 2023, the Bitcoin Macro Index has been printing lower lows, while the first cryptocurrency’s price has been setting new highs. That is historically characteristic of bull markets, but it also points to a long-term peak in BTC/USD.
CryptoQuant CEO Ki Young Ju is convinced that the uptrend in the first cryptocurrency has ended. In his view, over the next 6–12 months prices will decline or move sideways.
Every on-chain metric signals a bear market. With fresh liquidity drying up, new whales are selling Bitcoin at lower prices.@cryptoquant_com users who subscribed to my alerts received this signal a few days ago. I assume they’ve already adjusted their positions, so I’m posting… pic.twitter.com/0EIrpTCPVi
“Every on-chain metric signals a bear market. As fresh liquidity dries up, new whales are selling at lower prices,” the specialist noted.
Some market participants are more optimistic. For example, Mitchell Askew projects bitcoin at $150,000–200,000 in the base case, and above $250,000 in the event of a new bull run.
He allows that over the long term (on a ten-year horizon) the first cryptocurrency could reach $500,000–1m, and its market capitalisation exceed $20trn, surpassing gold.
Askew cited several key factors likely to influence bitcoin’s price over the next decade:
sustained institutional demand thanks to a more mature market structure;
the creation of corporate and sovereign reserves in cryptocurrency;
less abrupt and less frequent mining hardware upgrades, which will foster “industry stabilisation”;
macroeconomic factors such as interest rates, inflation and global liquidity cycles.
Conclusions
Bitcoin is becoming a more attractive asset: large investors dampen volatility, mining is growing more efficient, and the prospect of state-level adoption makes the cryptocurrency look ever more like gold.
Institutions, unlike retail, create counter-cyclical flows that stabilise price and reduce sharp swings. That is reshaping bitcoin’s former four-year cycles, long tied to halvings and speculative moves.
History does not repeat, but it often rhymes. Even if this market phase does not produce exponential growth, a reprise of 2017 could bring a swift recovery after the current correction and a subsequent upward move.
Analysts note similarities between the current cycle and 2015–2017, yet recent corrections point to a divergence from historical patterns. Some experts forecast bitcoin at $150,000–250,000 on institutional demand and macro factors; others warn of a bearish trend amid ebbing liquidity.
Despite conflicting signals, most indicators do not confirm market overheating or a cycle peak, leaving room for cautious optimism.