

How Is the Turtle Trading Strategy Used on the Cryptocurrency Market?

Who devised the Turtle strategy?
The Turtle method, the opposite of the classic “buy low, sell high”, was conceived by the American broker Richard Dennis in the 1980s. With it he taught 20 students—most of them with no trading experience—to make money on the exchange.
Richard Dennis was born in Chicago in 1949. He was among the few traders to build capital from almost nothing. While at school he worked as a runner on the CME. Earning $40 a week, Dennis blew the lot trying to trade—until he realised he had to learn how to do it.
When the future “king of futures” decided he had thought through his approach, he borrowed $1,600 from relatives. A seat on the exchange cost him $1,200; the remaining $400 he used to trade small contracts. In 1968–1969, before Dennis turned 21, his father worked the floor in his stead, with Dennis relaying orders by hand signals. For most traders the first year is a write-off; Dennis, however, was lucky. Bets on corn positions paid off until the 1970 crop failure.
By 1970 his working capital stood at $3,000; by 1973 it had reached $100,000. At 25 he had made his first million.
His Drexel Fund was long considered among the most stable and fastest-growing. A decade on, Dennis’s profits from the venture had reached about $200 million. But it was the “Turtles” that made him truly famous.
What is the Turtle method?
“Turtles” was the name Dennis gave to the students he recruited for an experimental programme.
In 1983 he made a $1 bet with a college friend, William Eckhardt. Eckhardt believed most people could not make money on the exchange even if taught, for lack of intuition. Dennis thought anyone could become a successful trader regardless of personality, provided four conditions were met:
- strict adherence to rules;
- internal discipline;
- a desire to get rich;
- a willingness to work.
At the time Dennis had invested in a turtle farm in Florida. He coined the group’s name while watching hatchlings scatter from a single pit towards the water.
Dennis offered candidates a move to Chicago and a modest salary. Selection required intelligence tests and an interview about risk tolerance. Of several thousand applicants, a third had trading experience, another third had basic knowledge and the rest knew nothing of markets. Dennis took on 23 students: the first cohort in 1983, the second in 1984.
The first group included two novice traders, a financial consultant, two card players, an accountant, an actor, a security guard, a high-school graduate, a designer, a female mathematician and an acquaintance of Dennis. Each had a $1 million trading account. Eighty-five percent of profits went to Dennis; 15% stayed with the “Turtles”. They could trade only his money and had to maintain confidentiality.
In the second group, standouts included Paul Rabar, who ranked second by income, and the eldest participant, 37-year-old Earl Kiefer. By then Kiefer had been a military pilot and even a co-founder of the London International Financial Futures Exchange. For the second intake Dennis changed the rules: starting balances varied and were not disclosed. It was said some received $50,000 while others got about ~$600,000.
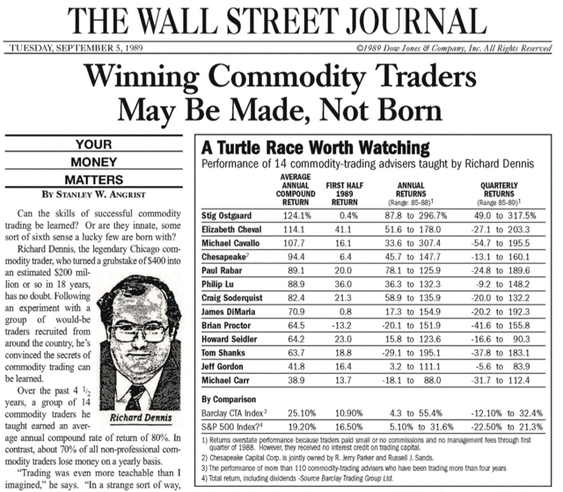
The first year of independent trading brought little. By 1985 results improved. Three participants were dismissed; the remaining 20 Turtles delivered about 100% average annual returns. The experiment lasted five years and its outcome was remarkable: $23 million invested yielded around $175 million. In 1992 the Turtle method was finally made public.
The fundamentals of the Turtle strategy
Dennis taught the Turtles to ignore news and shun the financial press, contrary to Wall Street practice. The method works with price, liquidity and trend—whatever the asset. The system is universal, and students applied it successfully across markets without regard to the underlying.
Dennis did not invent trend-following; he drew inspiration from Richard Donchian, a pioneer of technical analysis. In the 1970s Donchian first proposed the trend-following concept and created an indicator—the Donchian channel. It consists of three lines: upper, middle and lower, the latter being a 20-day moving average. The price corridor helps traders identify and visualise price breakouts, volatility and trend reversals.
Dennis’s Turtle strategy is built on long-term trends: let profits run and cut losses immediately on signal. Typically, a handful of big winners generate enough yearly profit to offset numerous small losers. The key input of the method is the current price.
Core rules of the Turtle method:
- use a deliberately simple system with minimal indicators;
- the future direction of the trend is irrelevant; the task is to make money now;
- lean on technical analysis and exclude fundamentals entirely;
- aim to capture most of the trend and avoid exiting prematurely;
- apply aggressive pyramiding: when a trade turns profitable, add to the position while the trend holds; add more slowly than capital grows and trail the stop order towards the position;
- do not stay in a position too long; exit in time, avoiding overpricing or underpricing;
- size positions with the asset’s volatility in mind;
- no bending the rules.
Entry rules under the Turtle method
Under the strategy, entries and exits follow strict rules. Entries can be short-term or long-term. In both cases, buying is triggered by a Donchian-channel breakout.
A short-term entry is signalled when price crosses the 20-day level set by the indicator. A breakout from below to above means buy; from above to below means sell.
An important nuance is to check the result implied by the previous signal. If the prior trade would have been profitable, the current signal is ignored. In that case, the entry is deferred until a breakout of the longer, 55-day channel. It does not matter whether the trader actually took the previous signal; only the potential outcome matters.
If the previous signal led to a loss, the current one must be taken. Do not deviate from this rule.
With a long-term approach, use a breakout of the 55-day price corridor. Unlike the short-term entry, it does not matter whether the prior trade was a gain or a loss: the position must be opened in any case.
The Turtles were taught to use one unit for each trade taken under the above rules. One unit corresponds to 2% of the trading account. If your account is $1,000, no more than $20 may be allocated to any single trade.
Asset category matters. If you hold positions in two assets from the same sector, your risks are inflated. This framework provided the necessary risk control and the ability to participate in many trades at once.
Exit rules and risk management under the Turtle method
A short-term exit occurs when price turns back through the shorter corridor—on a crossover of the 10-day Donchian channel. Long-term positions are closed on a breakout of the opposite boundary of the 20-day range.
Dennis required the Turtles to enter the market randomly and then manage the trades. Together with Eckhardt he worked on how students perceive money in percentage terms versus absolute amounts. They sought to minimise emotional sway and render the response to losses neutral. Under the Turtle method, losses can come one after another—say, seven trades out of ten—while the remaining three more than cover them.
A crucial element for the “king of futures” was risk management. It begins with measuring daily market volatility. This measure was given the conventional name N, i.e., ATR. The Turtles were taught to take the maximum of the following values for any market to derive N:
- the distance from today’s high to today’s low;
- the distance from yesterday’s close to today’s high;
- the distance from yesterday’s close to today’s low.
If the result was negative, it was converted to an absolute value.
For example, if a breakout occurred in corn futures at an assumed price of $250, the Turtles determined N for the stop. If N equals $7, then 2N is $14. The stop-loss is set $14 below the entry price. If buying at $250, sell at $236. No guessing—just follow the rules.
Whereas this once required manual calculation, today it is enough to add the ATR indicator to a TradingView chart. The idea is simple: the higher the readings, the greater the likelihood of a trend change.
The Turtle method in cryptocurrency trading
Despite being over 40 years old, the strategy is still used in crypto. Given high volatility and 24/7 trading, some tools need adapting. Possible adjustments include:
- Maximum position size: no more than 1–2% of current account equity; add-on orders no more than 0.25%. For small accounts this caution may feel unrewarding. However, the strategy is long-term and allows multiple positions across instruments.
- Track the behaviour of the instrument in play. Any strategy must deliver a statistical edge—profits exceeding losses over time. If a trend ends, it is more effective to seek entries in another instrument.
- Adjust for crypto’s higher volatility. One effective approach is to buy/sell only after a breakout of the 90-day price threshold. Close on a crossover of the 45-day level.
- Wider stop-losses. Start with 5N (5 ATR) instead of the standard 2N. A “big stop” reduces losses from false breakouts and helps avoid premature exits.
- Scale out profits. On reaching an 8–10 ATR target, closing half the position frees up capital for the next trade. A staggered exit can mitigate drawdowns.
- Additional signal filters. Many traders customise strategies by adding trend filters such as MACD and RSI.
- Diversification. Cryptocurrencies within a category often move together. Spreading risk across crypto-sectors means a loss in one coin may be offset by gains in another.
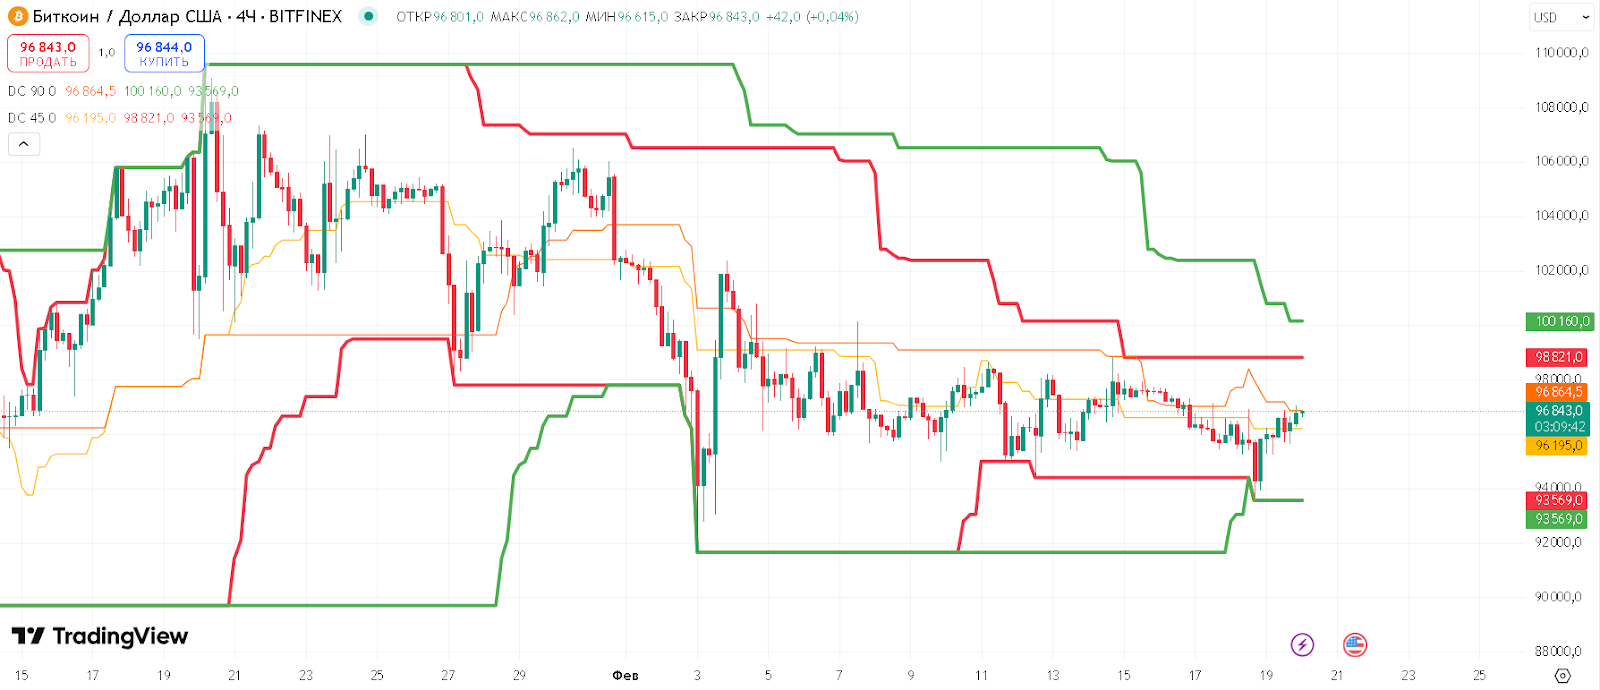
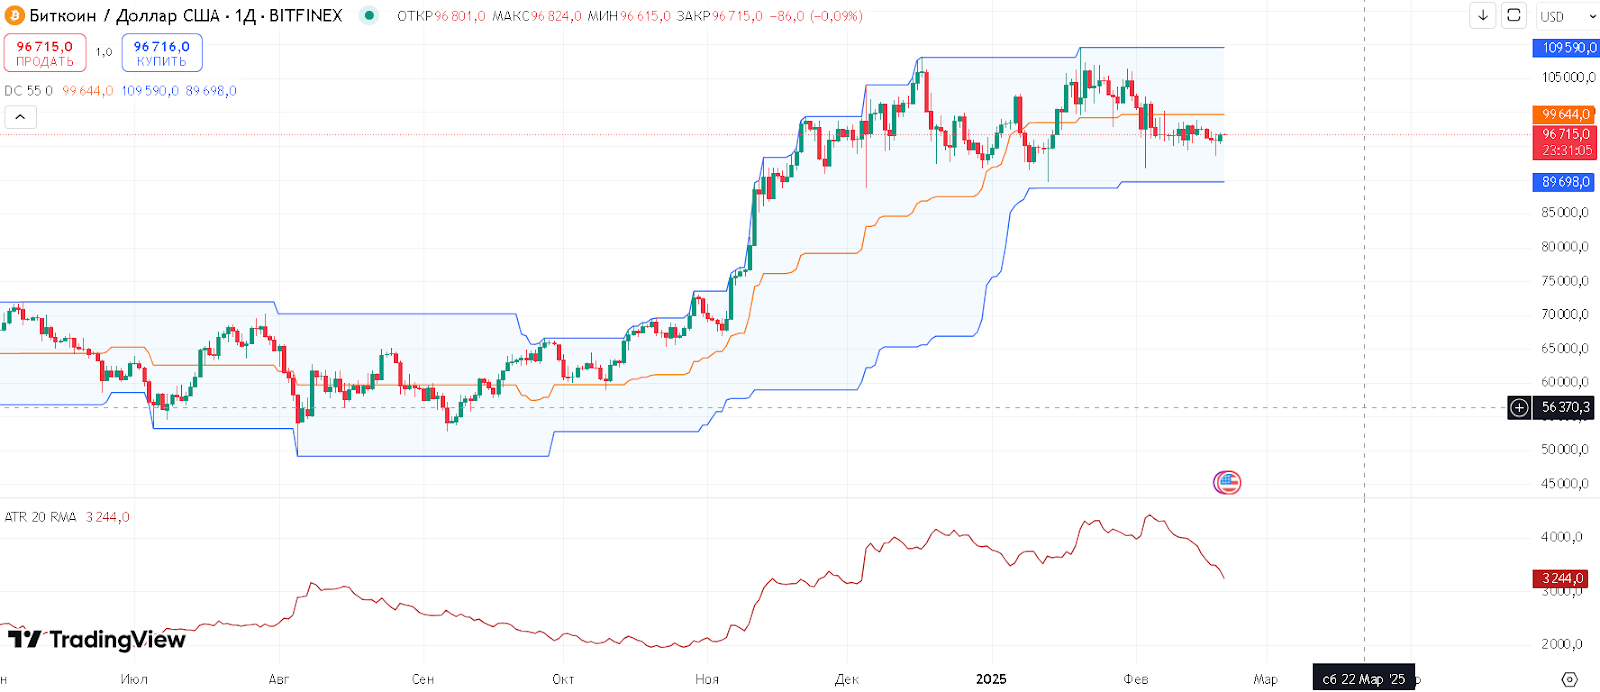
Suppose that on 17 January 2025 bitcoin’s price broke its 90-day high around ~$105,700. The entry occurs at the breakout point. The stop-loss is set per 5 ATR, $7,000 below the breakout—around ~$98,700. If the trend continues, the trader holds until a reverse signal appears—touching the lower red line of the 45-day Donchian.
The Turtle strategy suits traders willing to follow strict rules and hold positions for the long haul. In crypto it can serve as the foundation for more elaborate trading systems.
Рассылки ForkLog: держите руку на пульсе биткоин-индустрии!