

July 2021 in numbers: NFT rallies, $900m for FTX and on-chain positivity for Bitcoin
Key Takeaways
- After a correction below $30,000, Bitcoin resumed its rise, reaching $42,400 by month-end. In July, the first cryptocurrency climbed 18%. On-chain indicators point to the asset being undervalued.
- Ethereum rose by almost 11% in the run-up to the London hard fork.
- NFT platform tokens led the rally in gains.
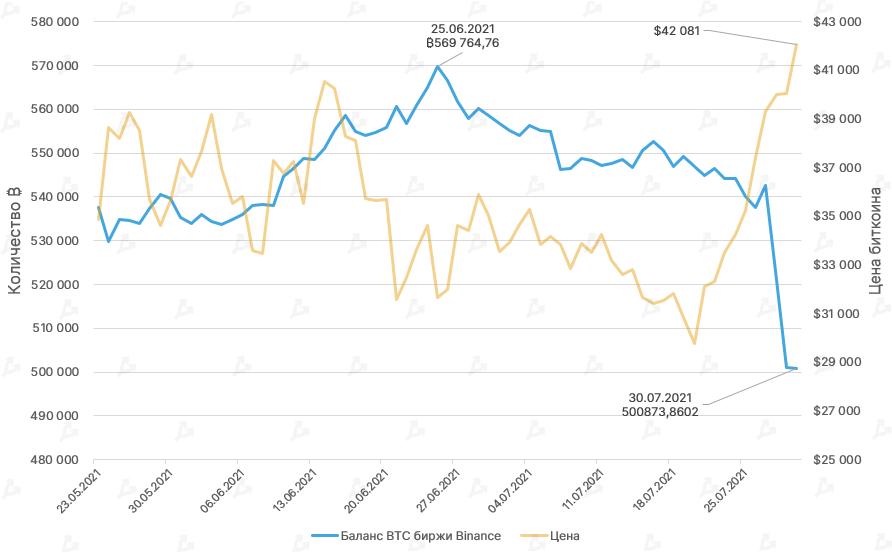
- There was a sharp outflow of Bitcoin from crypto exchanges. Binance reserves fell by 70,000 BTC.
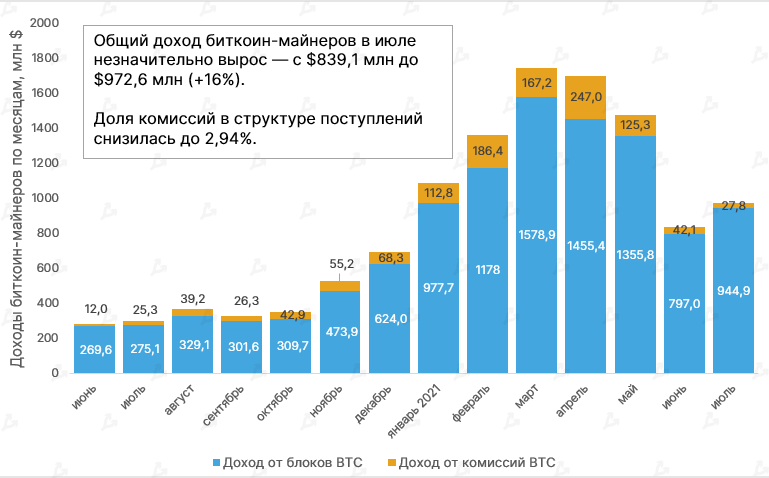
- Bitcoin miners’ revenues rose for the first time in four months.
- Trading volumes on leading exchanges reached levels seen in December–January.
- The decline in TVL in DeFi protocols was followed by growth — the value locked rose 30%, surpassing $70 billion.
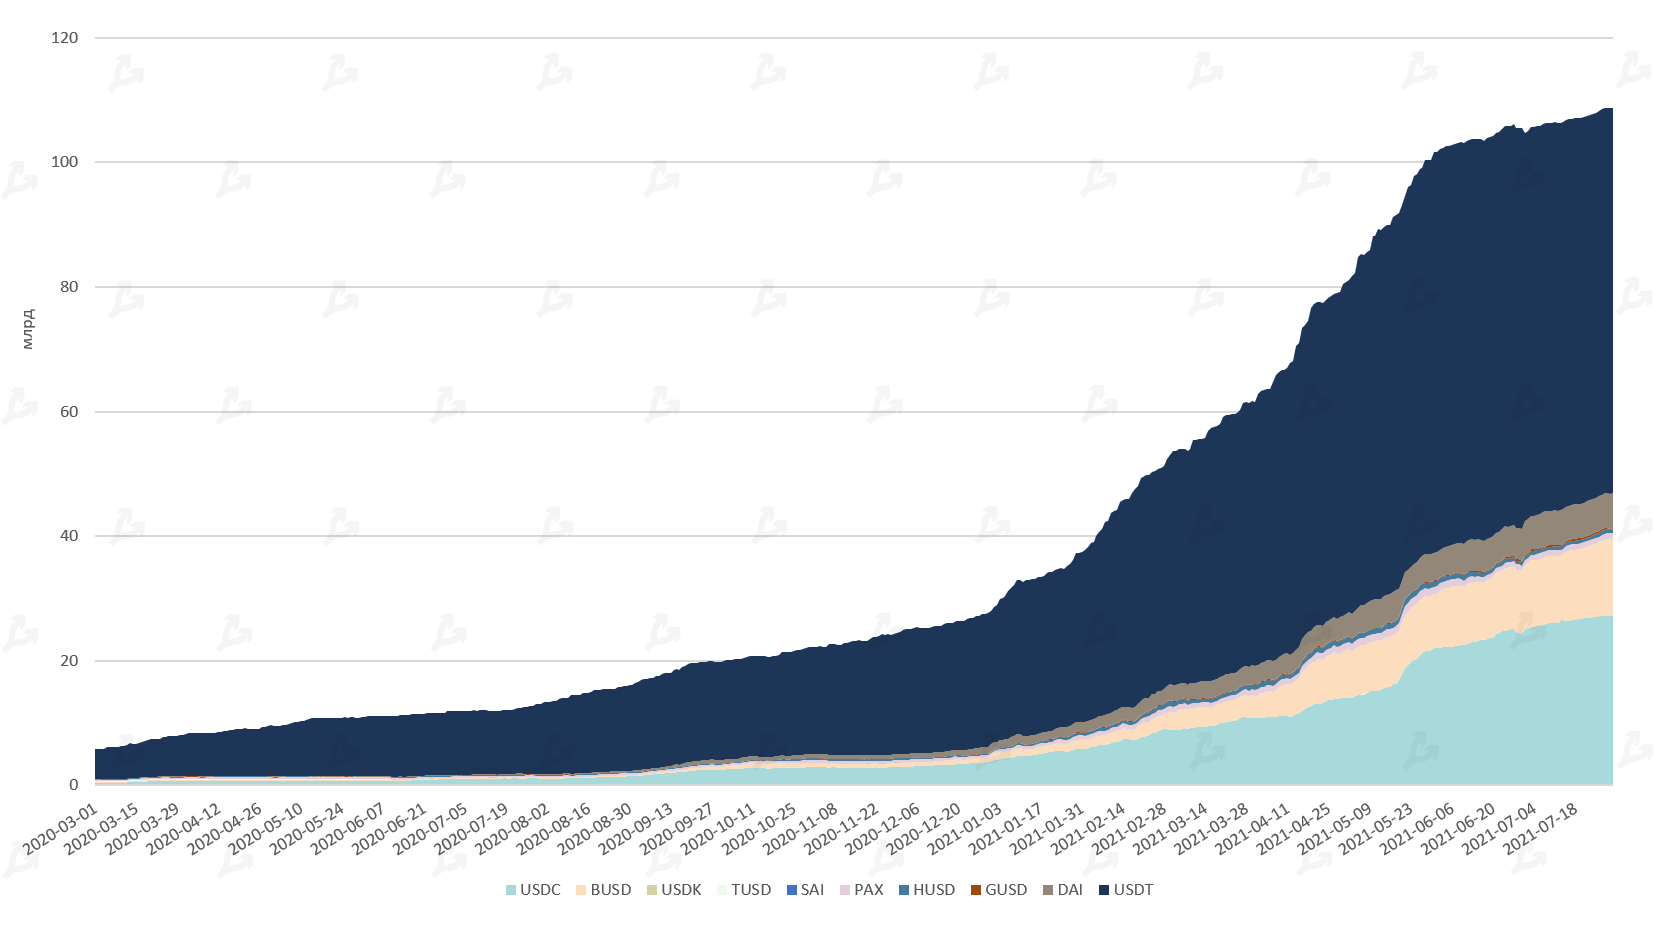
- The issuer of the stablecoin Tether halted new mintings, unlike its rivals.
- FTX closed the largest round in industry history, valuing the firm at $18 billion, while Binance faced regulatory pressure.
Performance of Leading Assets
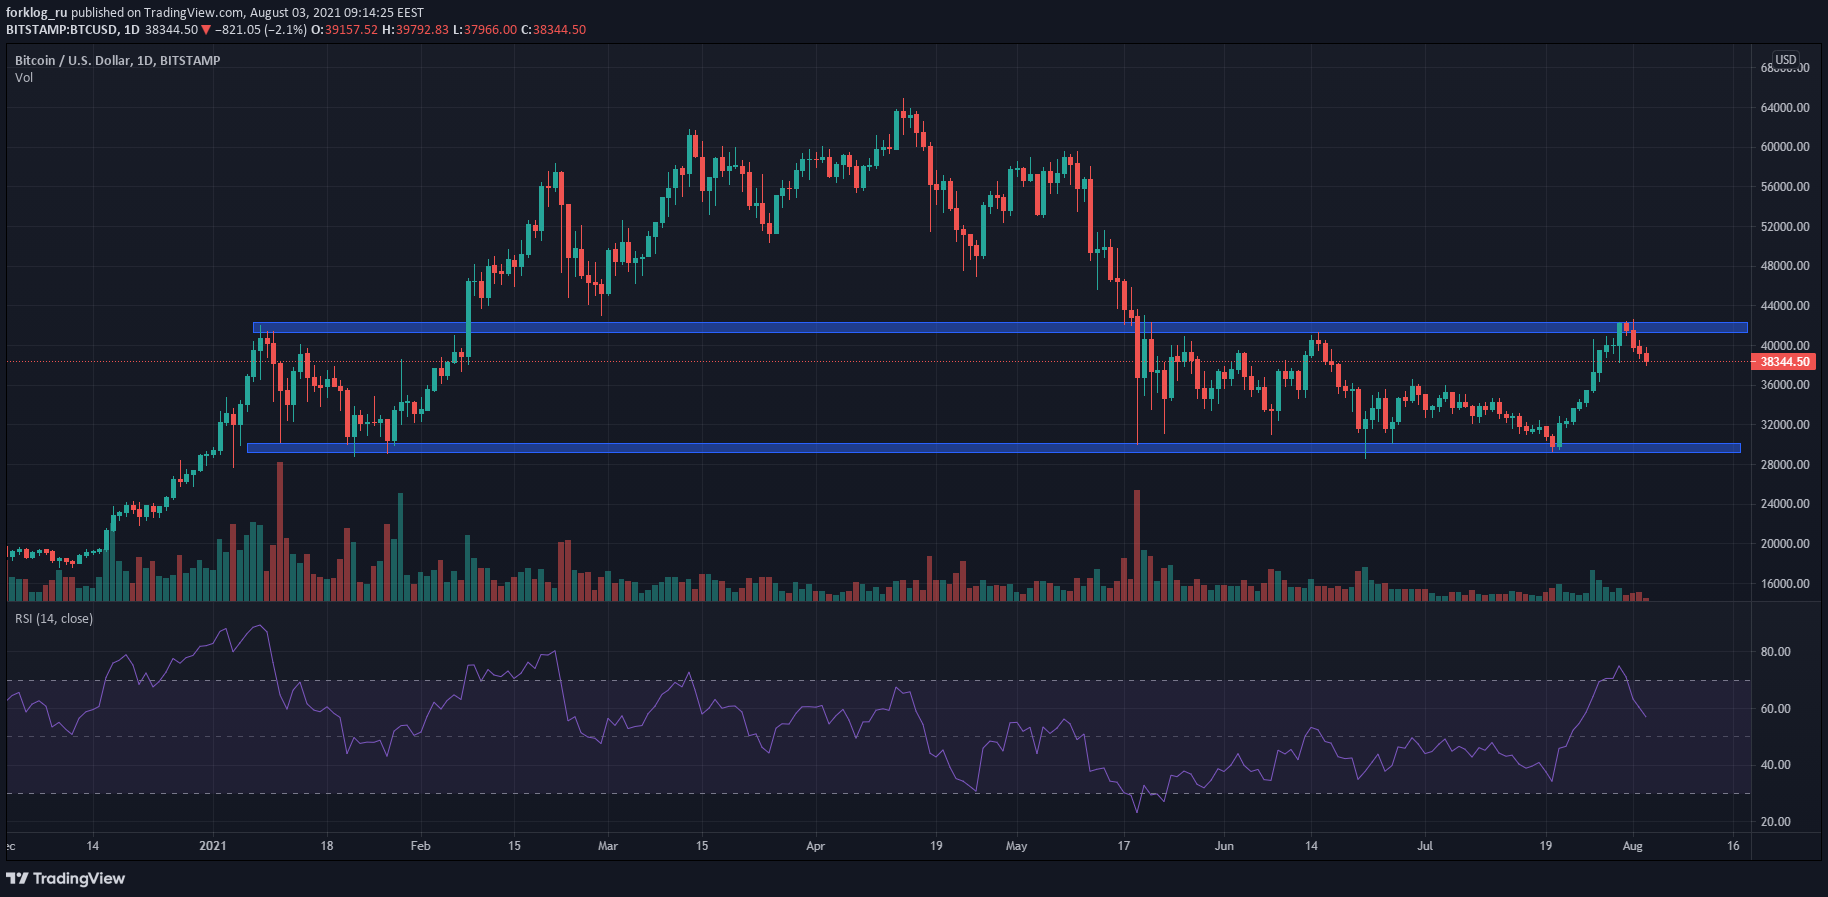
- In the first half of July, Bitcoin traded lower, starting the month at $35,000 and dropping 16% to $29,300.
- From July 19, Bitcoin climbed steadily for ten days, adding about 45% to its price. The local high was $42,400 (July 31).
- By month-end, Bitcoin had risen by 18.3%.
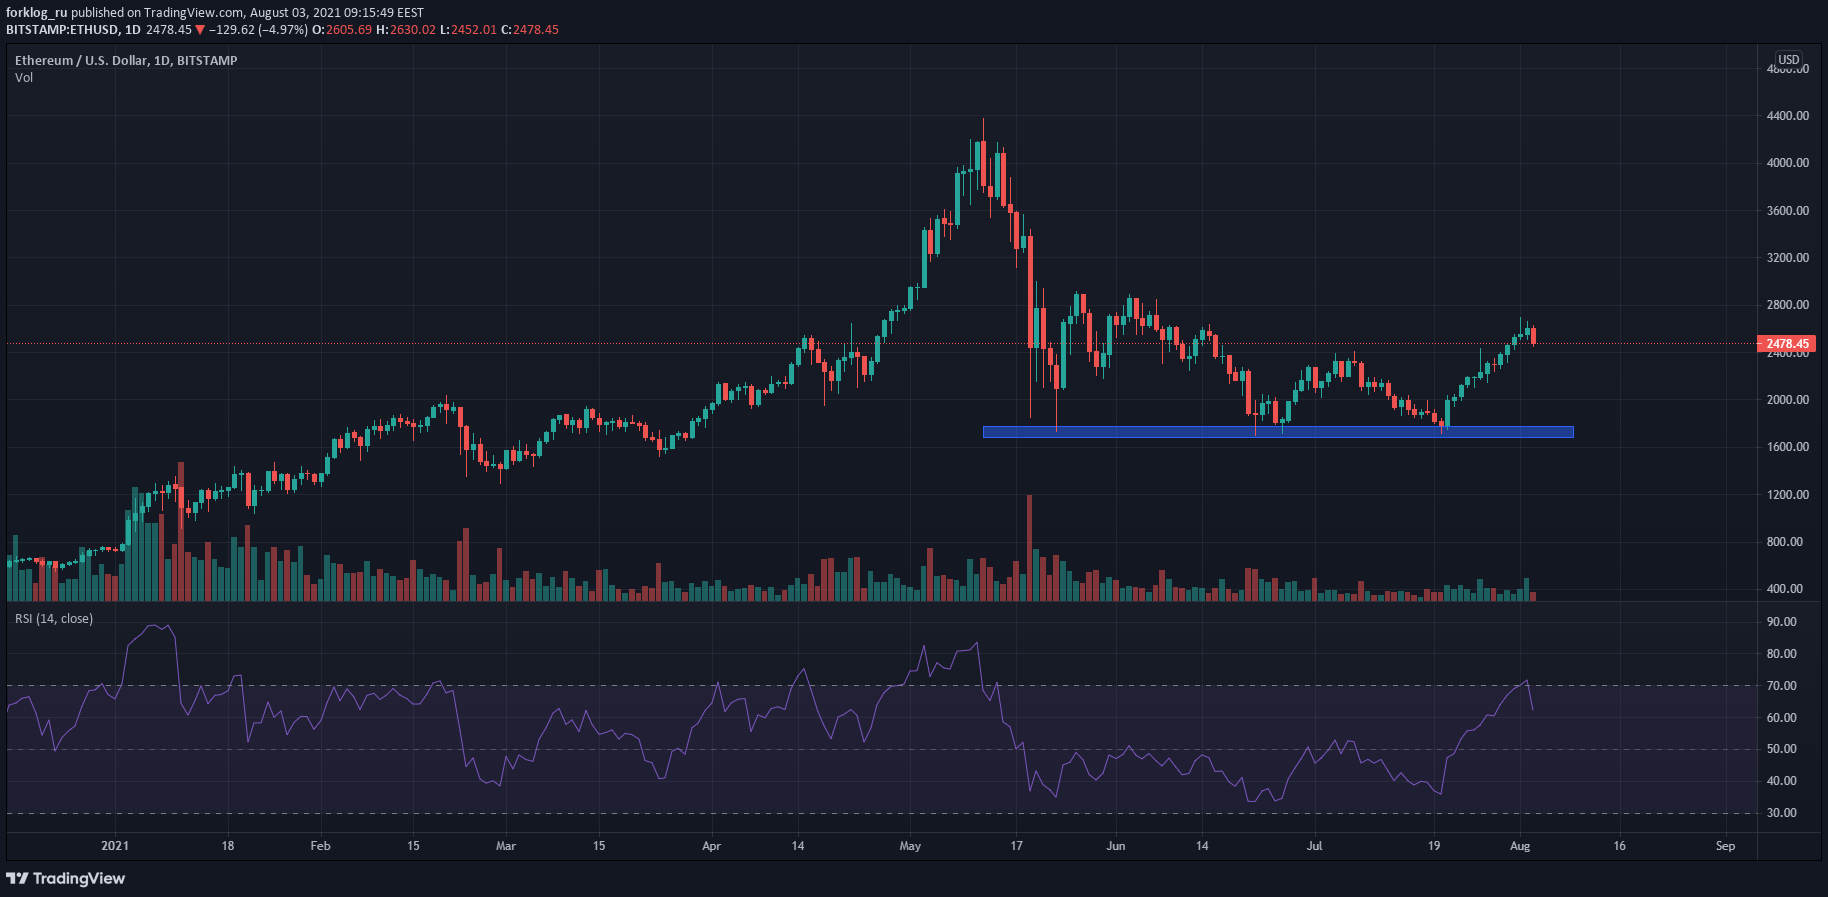
- Ethereum followed a similar pattern — after a 25% decline in the first half of July, the price recovered by month-end by 47% and hit a local high of $2,555 (July 31).
- For the month, the cryptocurrency rose by 10.9%.
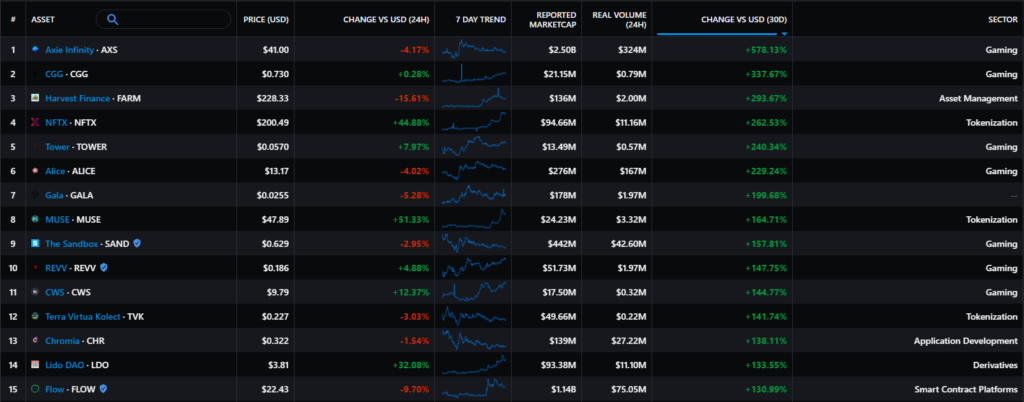
- Unquestioned leaders of the month were NFT marketplace and gaming platform tokens. Axie Infinity (AXS), MyNeighborAlice (ALICE) and Sandbox (SAND) stood out.
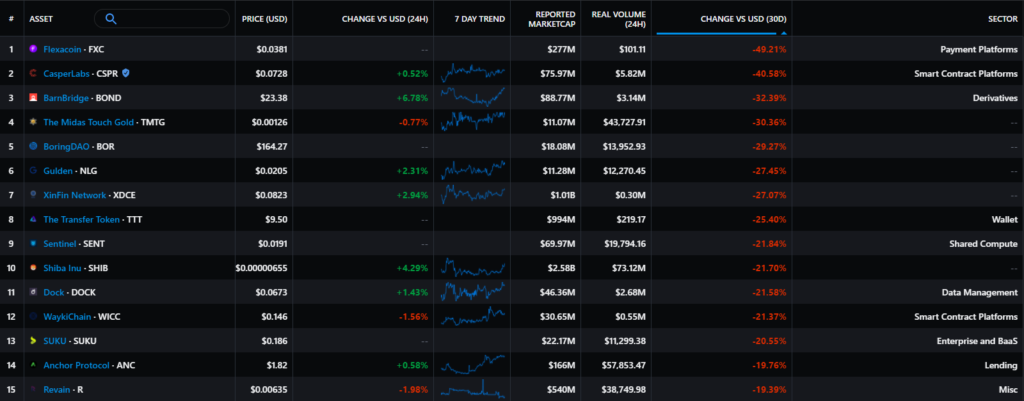
- The poorest performers were Flexacoin (FXC), CasperLabs (CSPR) and BarnBridge (BOND).
Crypto-linked Companies’ Stocks:
- MicroStrategy (MSTR): -3.78%.
- Coinbase (COIN): -5.78%.
- Galaxy Digital (GLXY): -12.4%.
Mining Stocks’ Performance:
- Canaan (CAN): -13.68%.
- Ebang International (EBON): -28.94%.
- Riot Blockchain (RIOT): -11.5%.
- Hut 8 (HUT): +10%.
- Marathon Digital (MARA): -11.92%.
Market optimism did not spill over to traditional markets. Some investors may have viewed the latest uptrend as a correction before further declines.
Macro Backdrop
- After the July 25 meeting, the Federal Reserve acknowledged that there are grounds to begin tapering its asset purchases. The situation will be reassessed at upcoming meetings.
- Fed Chair Jerome Powell said markets would receive such signals in advance. He stressed that the labor market has not fully recovered from the COVID-19 pandemic. He warned inflation will stay elevated for months to come before moderating.
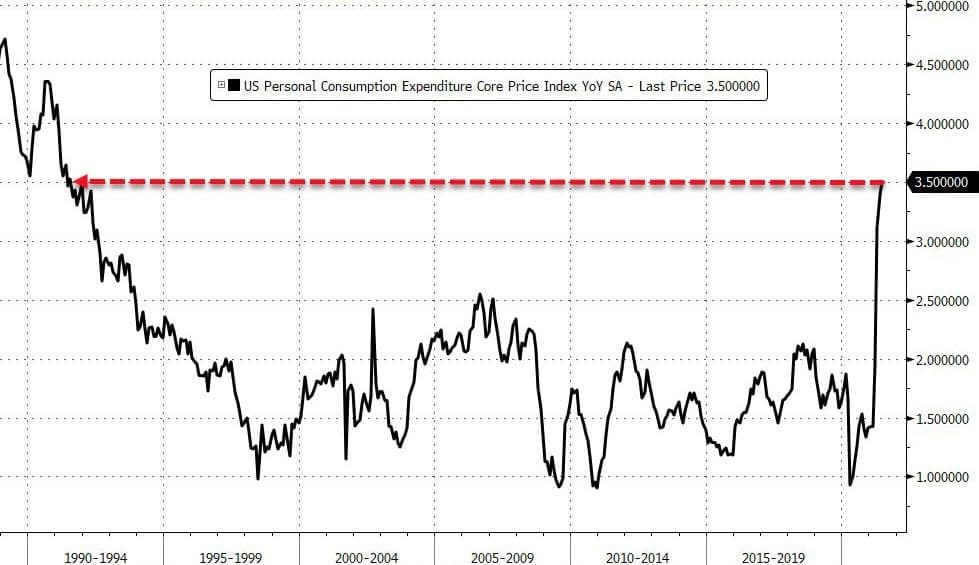
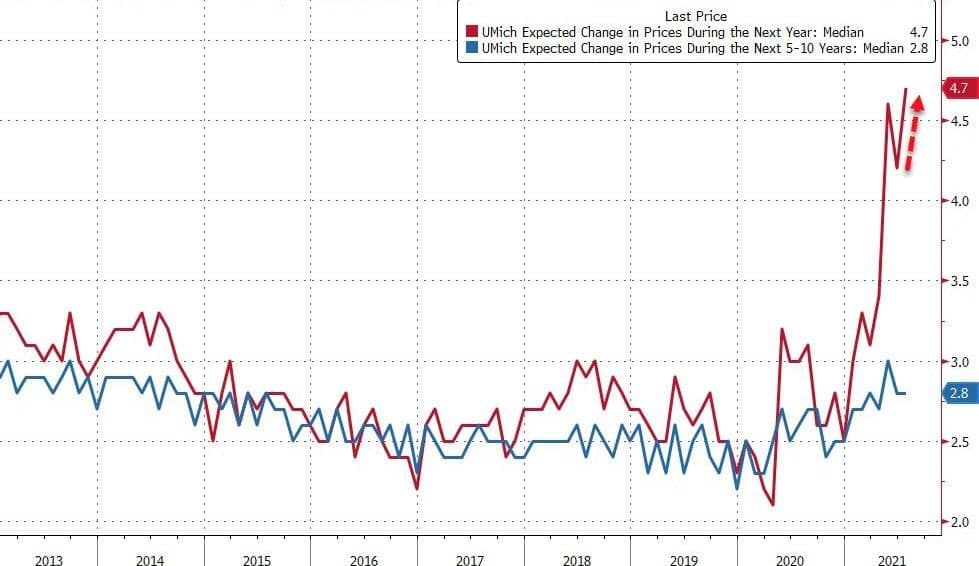
- Such rhetoric could change if consumer prices keep rising — the PCE Core Deflator, the Fed’s preferred gauge, rose to 3.5%, the highest since July 1991. This raises the risk that inflation expectations become anchored at an elevated level over the 5–10 year horizon (currently 2.8%).
The start of a return to normal monetary conditions by the Fed could trigger stress in financial markets. The crypto market could also come under pressure if its behavior comes to resemble risk assets’ moves, as seen in March 2020.
Market Sentiments and Correlations
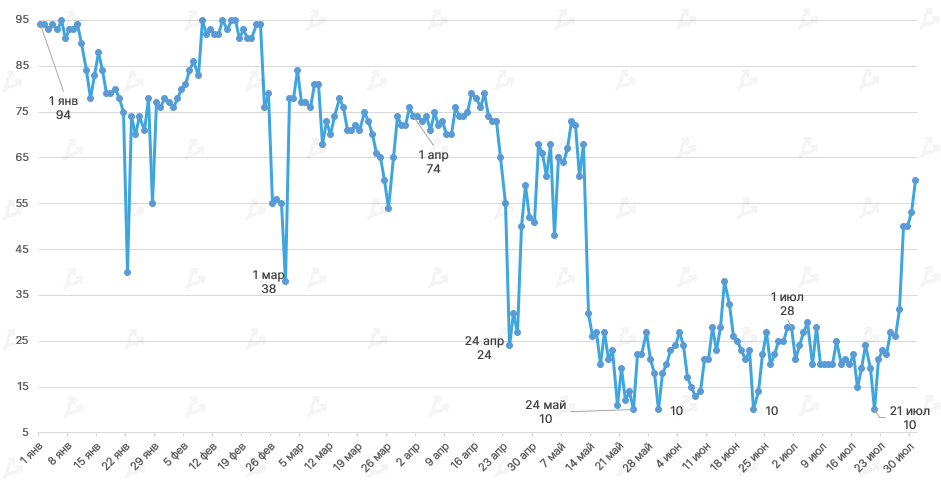
- On July 21, the Fear and Greed Index again fell to 10 — a level last reached in May and once in June. Since then, the index has begun rising into the ‘Greed’ zone, signaling optimism. July’s average was 26.3 (May: 36.9), with a minimum of 10 and a mode of 20.
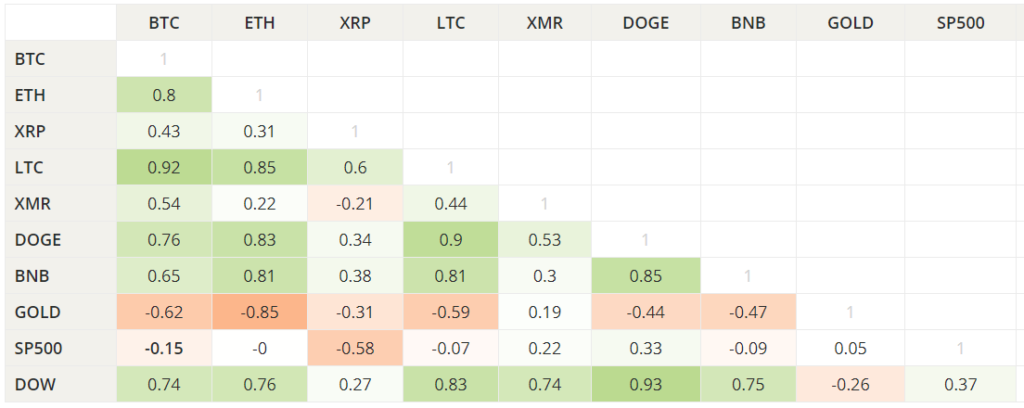
- The correlation of Bitcoin with other PoW assets, including Ethereum and Litecoin, strengthened. Bitcoin’s correlation with gold turned sharply negative (-0.62). Thus, price movements in these assets have diverged recently.
- Bitcoin’s correlation with the S&P 500 stood at -0.15. A month earlier it was 0.13, indicating a small positive link.
On-chain Data
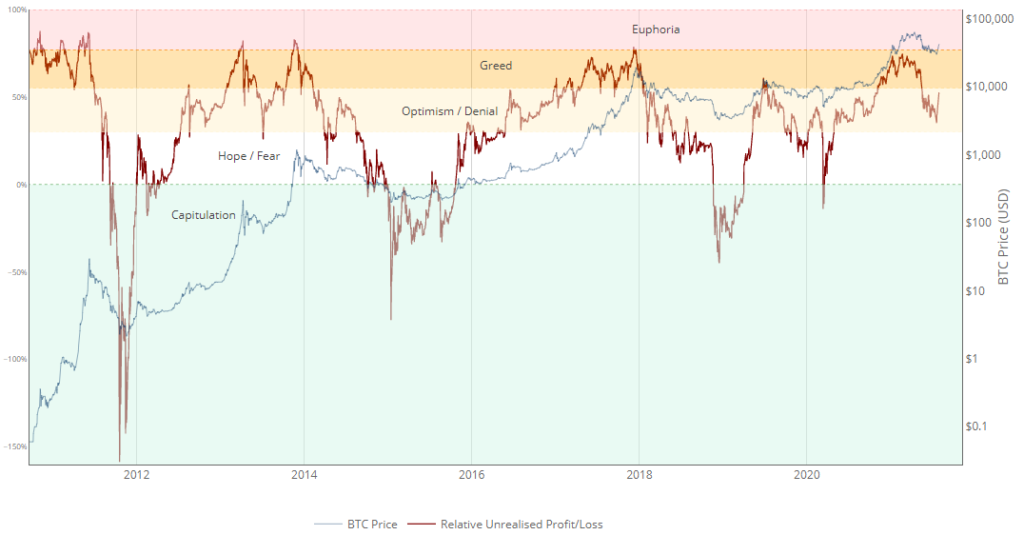
- Despite Bitcoin’s recent price dip, Relative Unrealized Profit/Loss has not yet entered the Hope/Fear zone, let alone Capitulation. Capitulation was last seen at the 2018–2019 turning points and in March 2020. The May collapse was likely just a correction. As of writing, the indicator is approaching the Greed zone, suggesting a resumption of the rally.
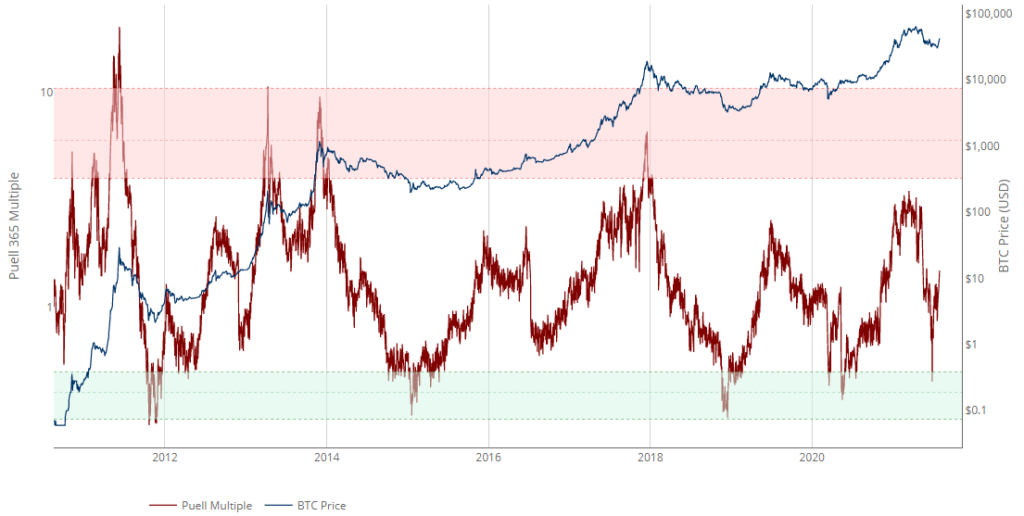
- The Puell Multiple, by contrast, reached the green zone at the end of June, signaling Bitcoin’s undervaluation and a favorable time to buy. Values remain above the oversold region, indicating improving investor sentiment and market stabilization.
Read more about recent on-chain signals in our feature.
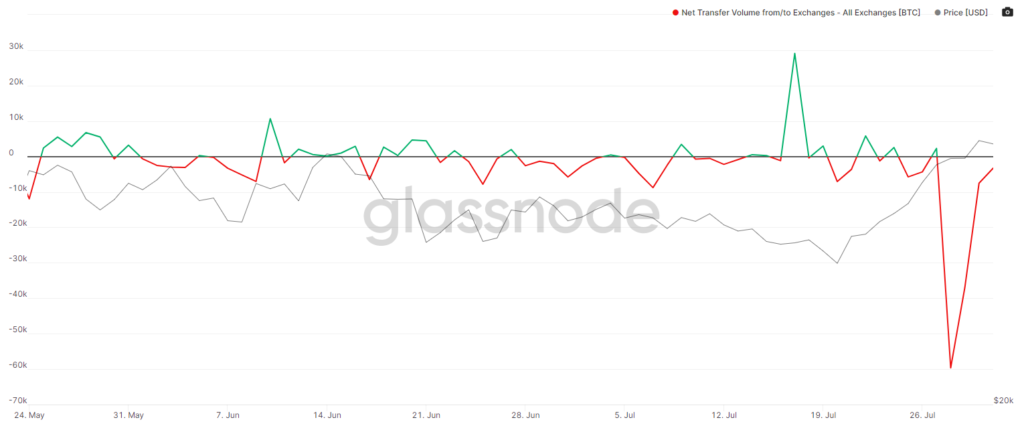
- During the month, centralized-exchange Bitcoin reserves generally declined, signaling reduced pressure from potential selling. The largest net outflow occurred on July 28 (−59,650 BTC).
- Binance’s Bitcoin reserves fell by almost 70,000 BTC over the month amid growing regulatory pressure in various jurisdictions.
Ethereum 2.0
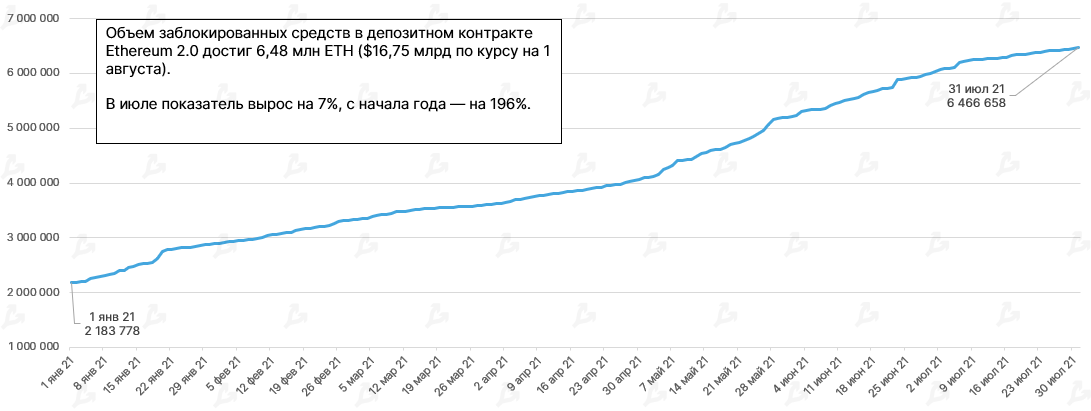
- There are 6.48 million ETH worth $16.75 billion locked on the Ethereum 2.0 deposit contract.
- In the network of the new generation there are 201,818 validators, and in July their number rose by 7%.
Lightning Network
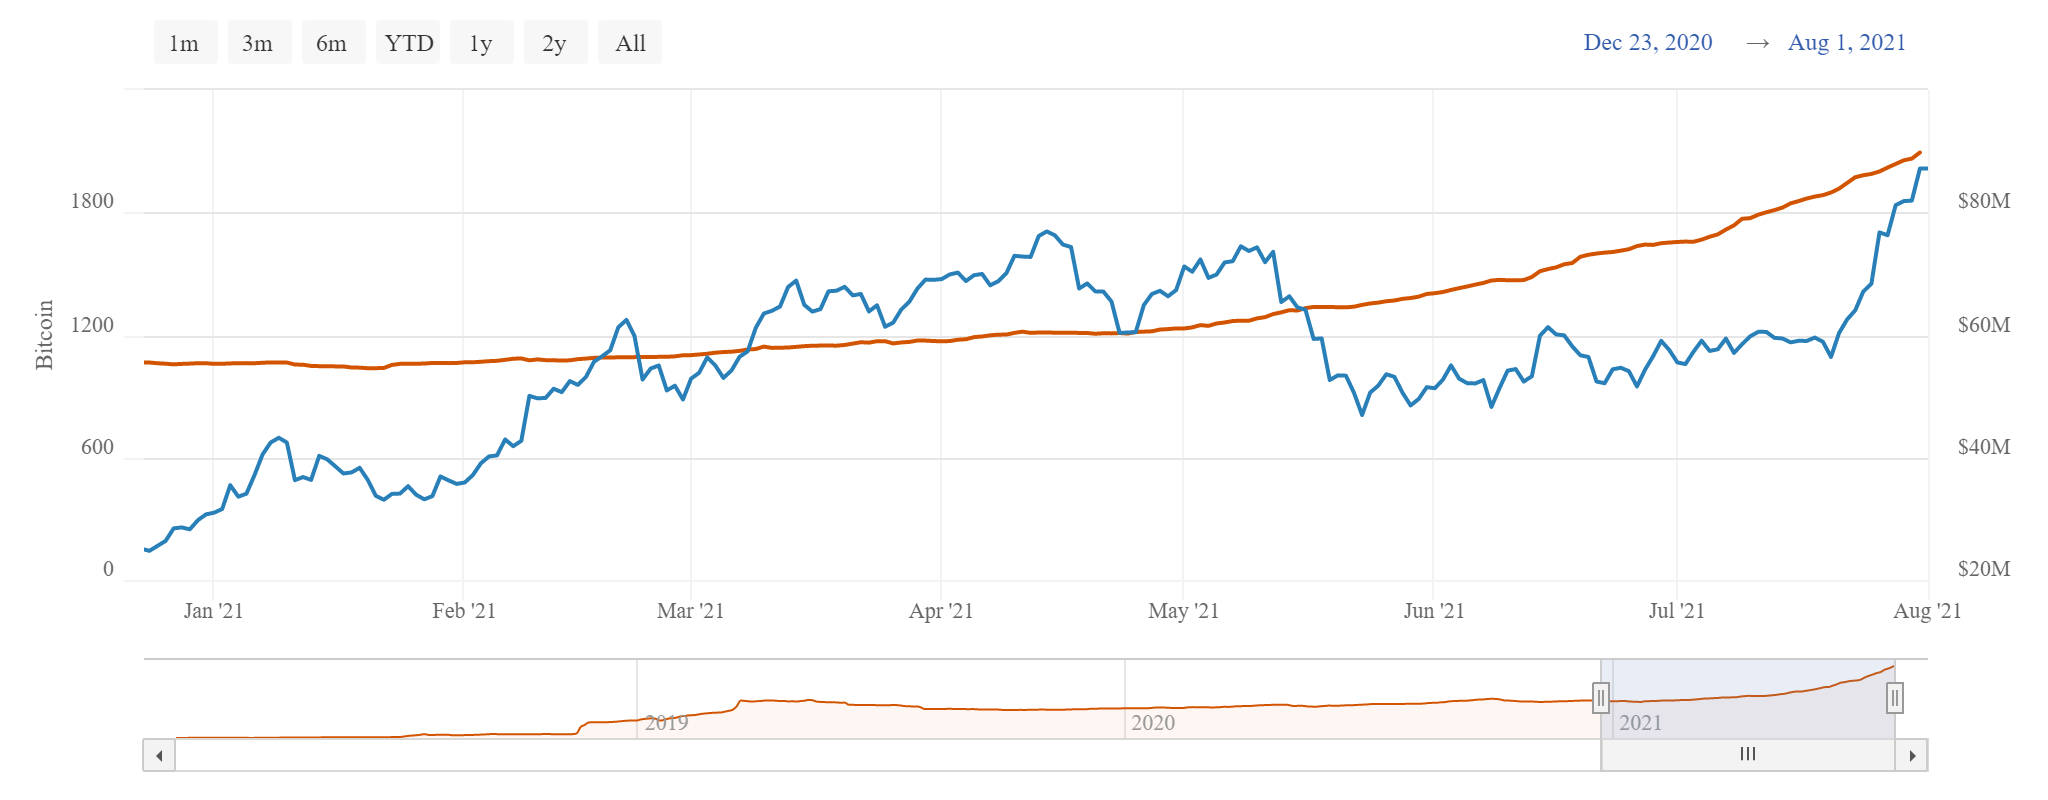
- Since the start of the year, Lightning Network capacity has grown 98% — from 1,058 BTC to 2,093 BTC. Over the last 30 days it rose 29%. Over the same period, LN nodes rose by 7.9% and channels by 17%.
- Lightning Network is one of the key scaling solutions for Bitcoin, reducing transaction fees and increasing payment privacy. Many experts believe this technology will help drive broad crypto adoption.
Binance Smart Chain
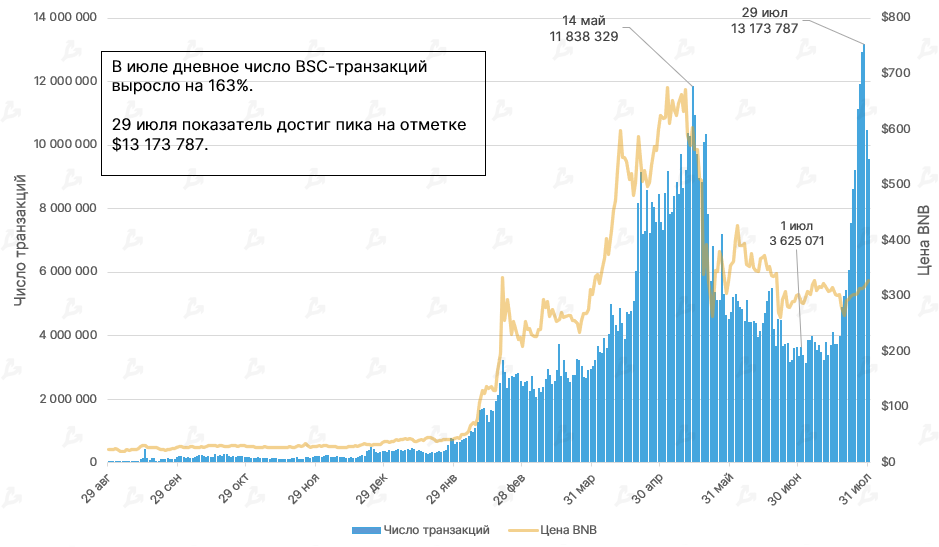
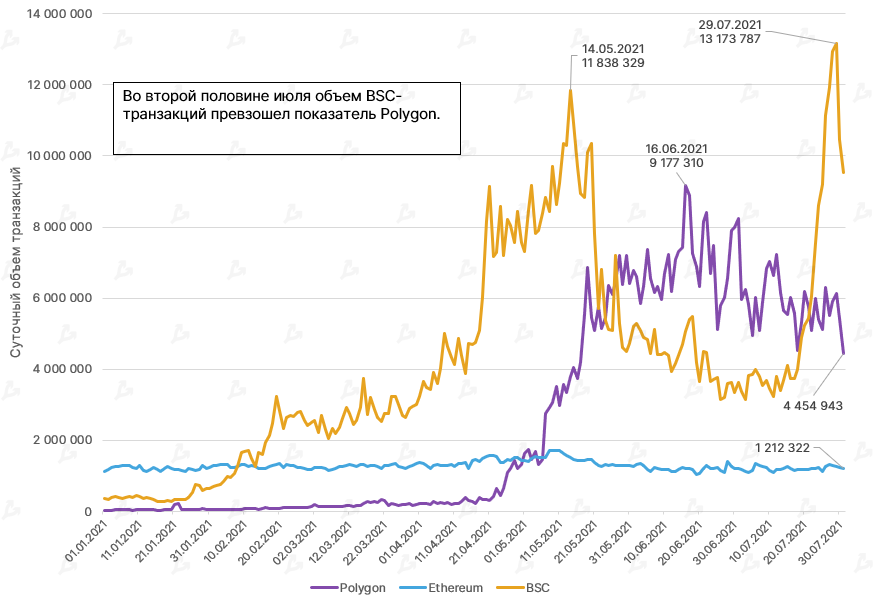
- For the Binance Smart Chain (BSC) ecosystem, July marked a record surge in on-chain activity. Daily BSC transactions cleared 13 million by month-end, exceeding Polygon’s figures.
- The rise came with relatively low market capitalization for BNB, suggesting token under-valuation. The upside may be constrained by the negative news around Binance’s centralized exchange.
- The spike in on-chain activity on BSC coincided with asset outflows from Binance. Some funds may be flowing from the exchange into DeFi-apps.
Mining, Hashrate, Fees
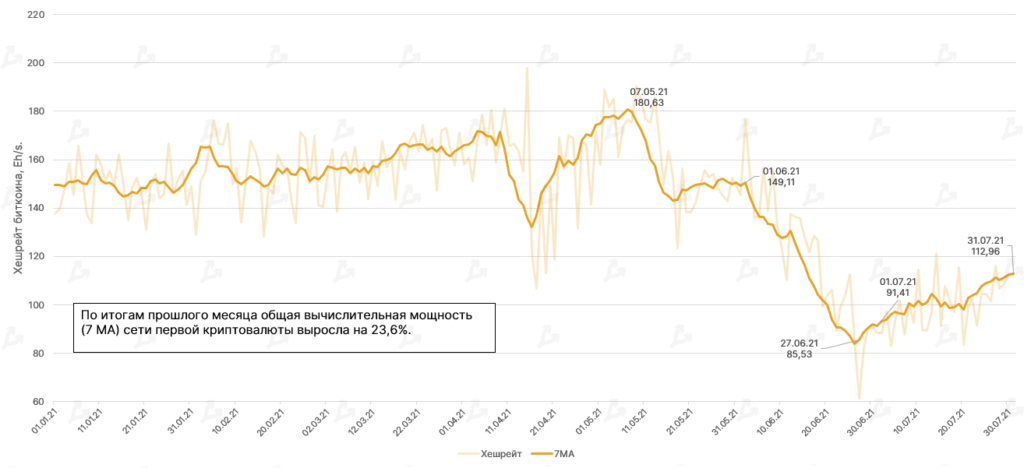
- Throughout July, Bitcoin’s hashrate recovered from the June collapse, prompted by outages at major mining facilities in China and subsequent migration to the United States, Canada and Kazakhstan.
- Total network computing power rose by 23.6% month-on-month (seven-day smoothed). This suggests that some Chinese miners, having moved equipment overseas, connected capacity in new jurisdictions.
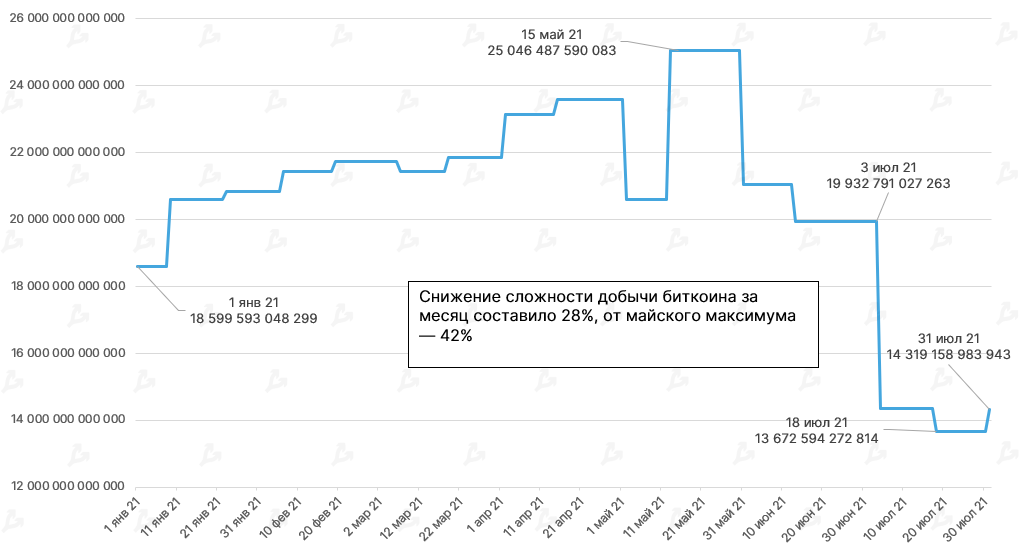
- Following the hashrate, mining difficulty rose slightly for the first time in two months. The indicator increased by 6% according to the latest recalculation on July 31.
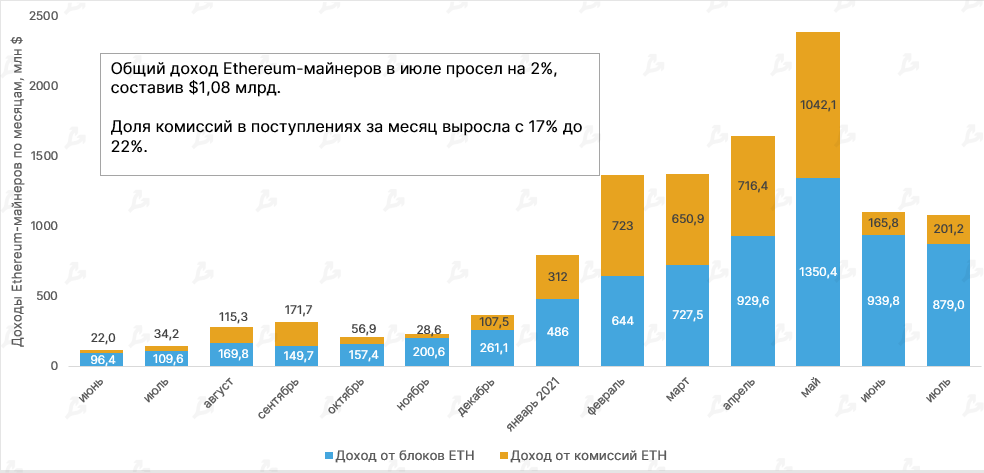
- Ethereum miners’ revenues rose for the first time in four months, to $1.08 billion. The share of fees rose from 17% to 22% — from $165.8m to $201.2m, partly offsetting the drop in block rewards from $939.8m to $879m.
- Overall Ethereum-miners’ revenue has for three consecutive months surpassed Bitcoin miners’ revenue.
- London hard fork in Ethereum implies burning a portion of fees depending on network load. Hence, one may soon expect a rise in the share of block rewards in miner revenue.

- In July, the average Bitcoin transaction fee reached a year-low of $1.97. Ethereum transaction fees, conversely, resumed rising. This affected miners’ revenue mix.
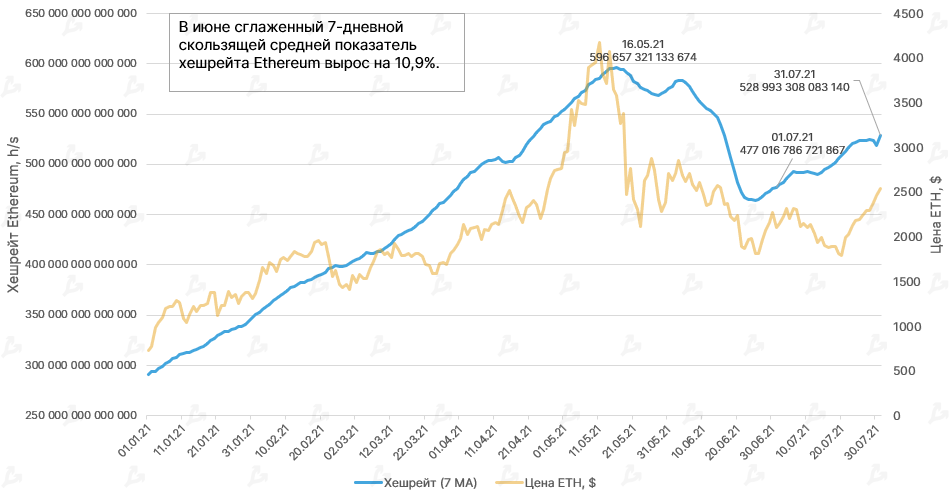
- As with Bitcoin, Ethereum’s network hashrate rose, and the chart shows a clear correlation between the hashrate and the price of the second-largest cryptocurrency.
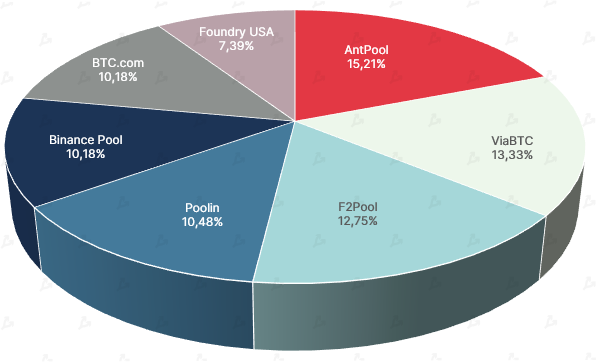
- Antpool emerged as the leader in total hashrate. This pool recently split from its parent company Bitmain.
- The second-largest pool is ViaBTC. Its share of total hashrate had previously never exceeded 8%.
Volume of Trading
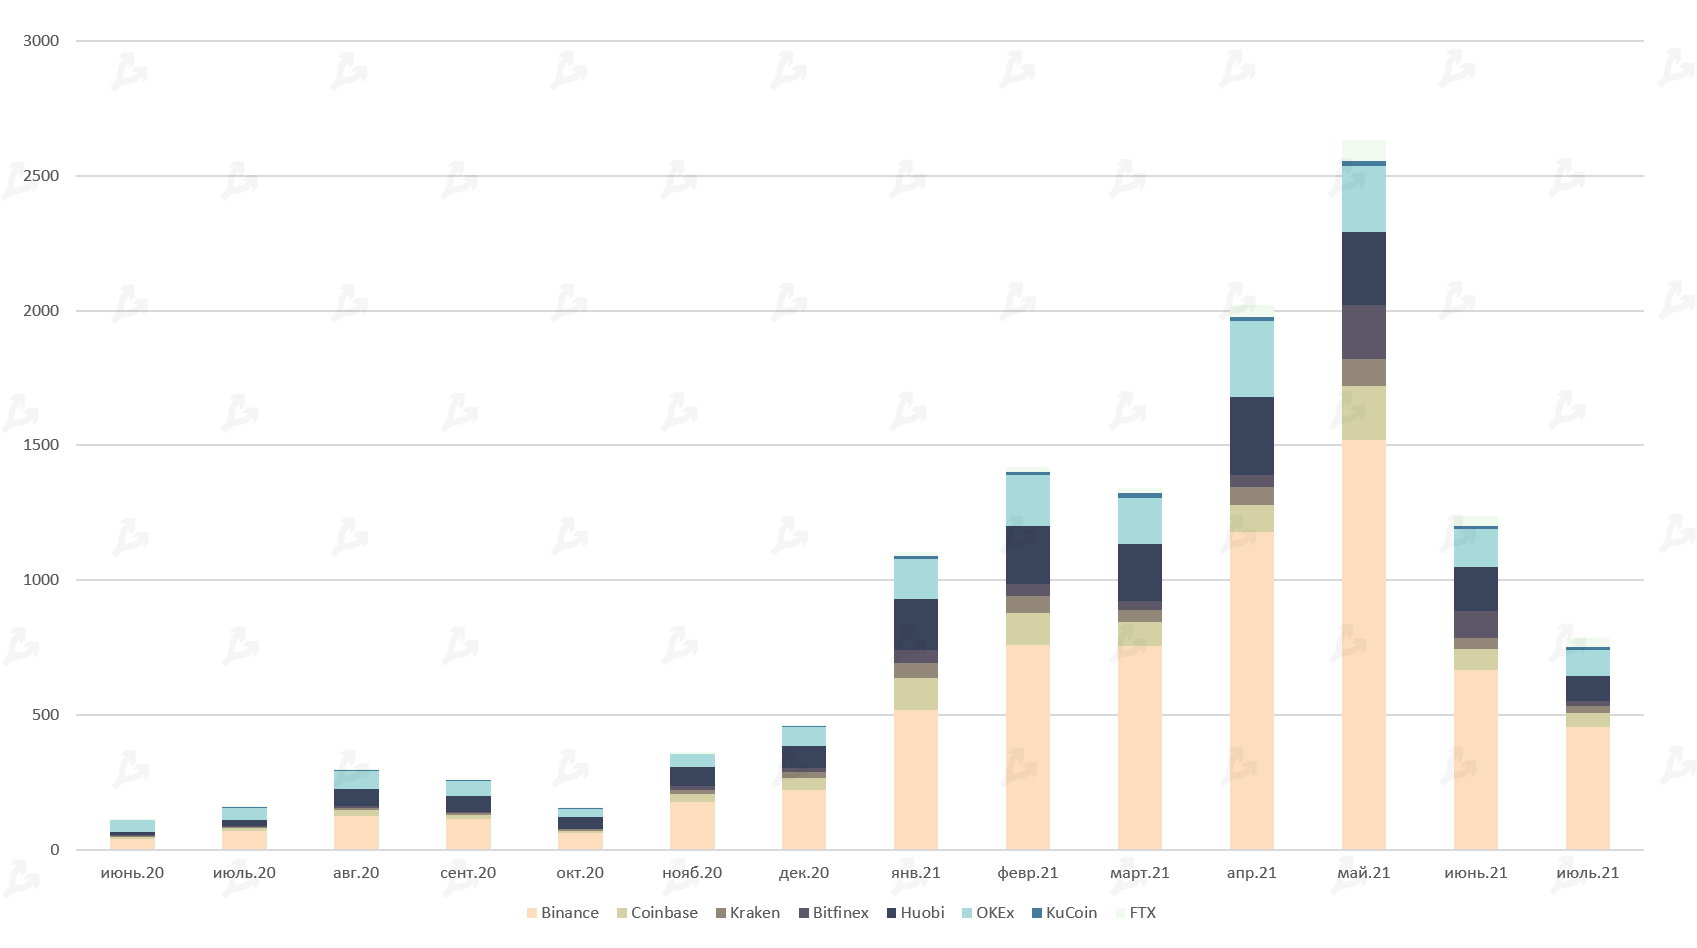
- Trading volume on leading crypto exchanges in July declined by 36%. The metric hit the 2021 low of $786 billion.
- Binance turnover fell to $455 billion, OKEx to $97 billion, Huobi to $92 billion, and Coinbase to $54 billion.
Futures and Options
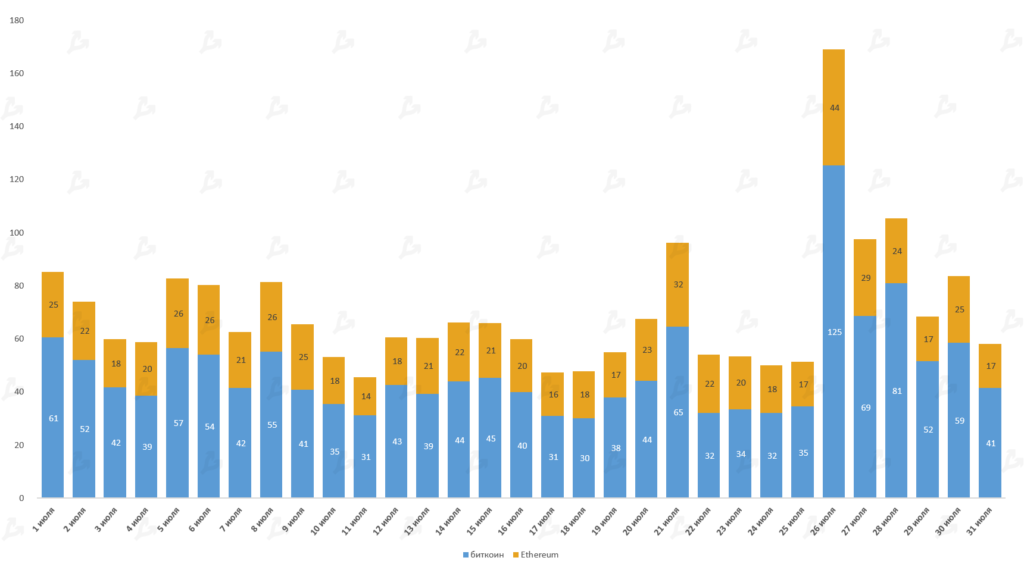
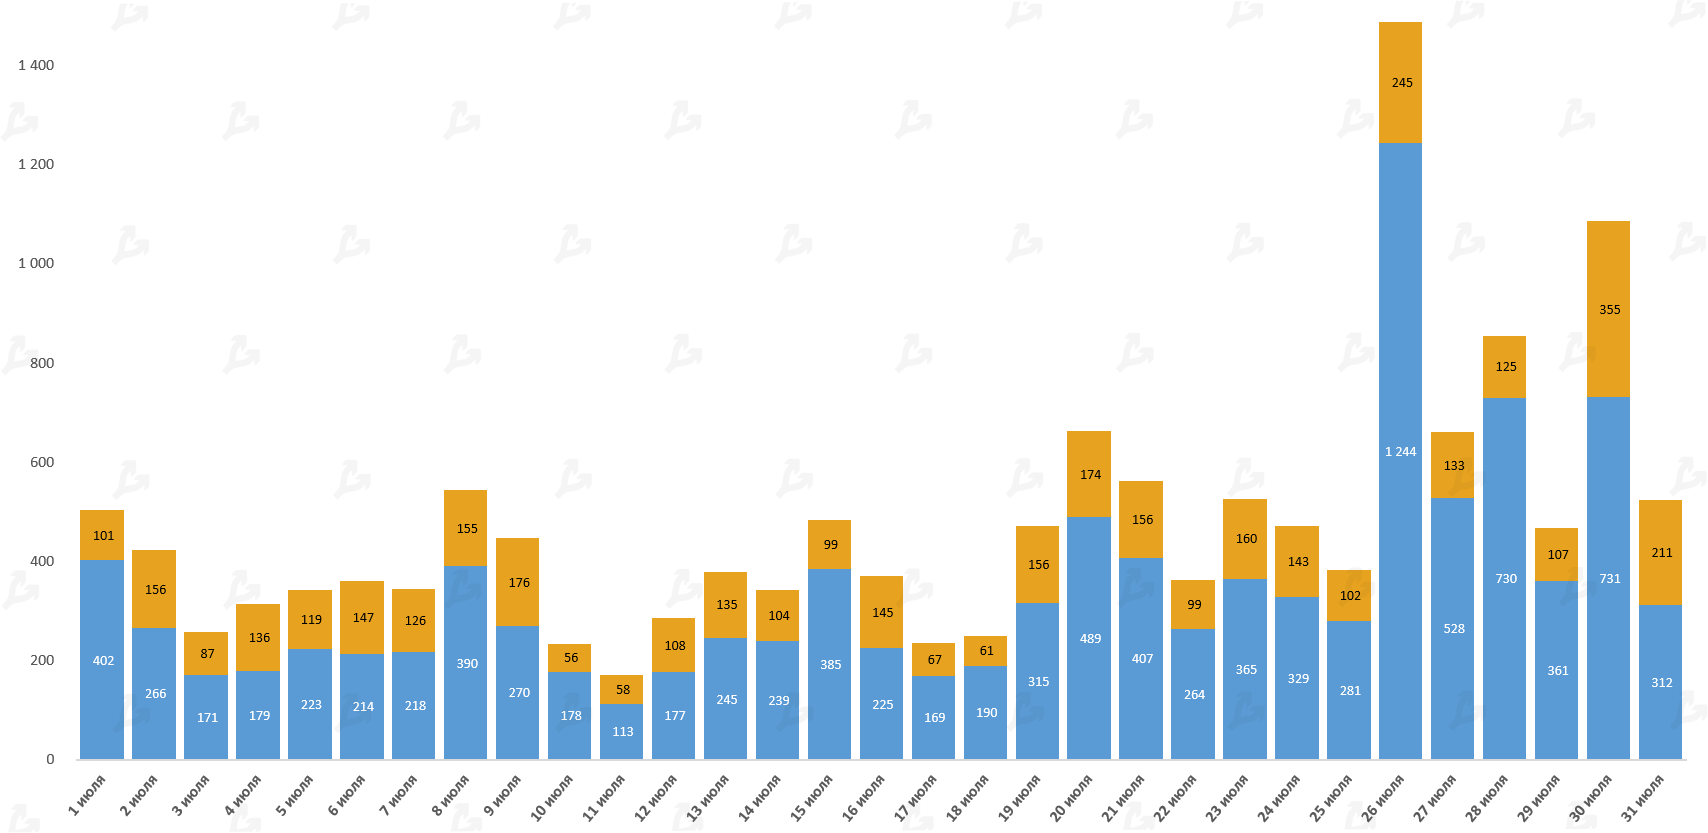
- As with the spot market, futures and options volumes in July hit the lowest level of 2021 ($1.4 trillion for derivatives).
- During the most active session on July 26, when Bitcoin jumped more than 15% in a day, total futures volume on Bitcoin reached $125 billion and Ethereum-based contracts $44 billion. On the options side, volumes were $1.2 billion and $245 million respectively.
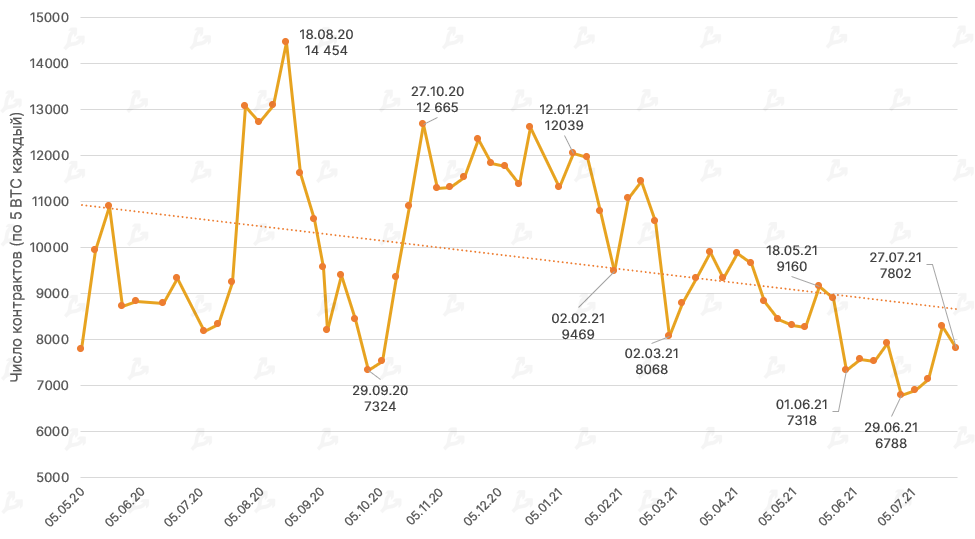
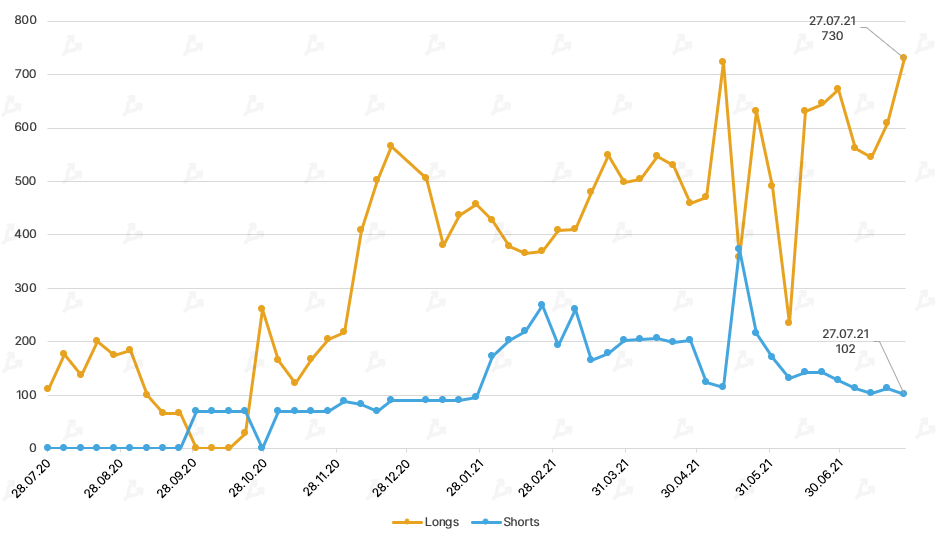
- Open interest generally tracks Bitcoin’s price. In June it rose by 25% to $14.2 billion.
DeFi
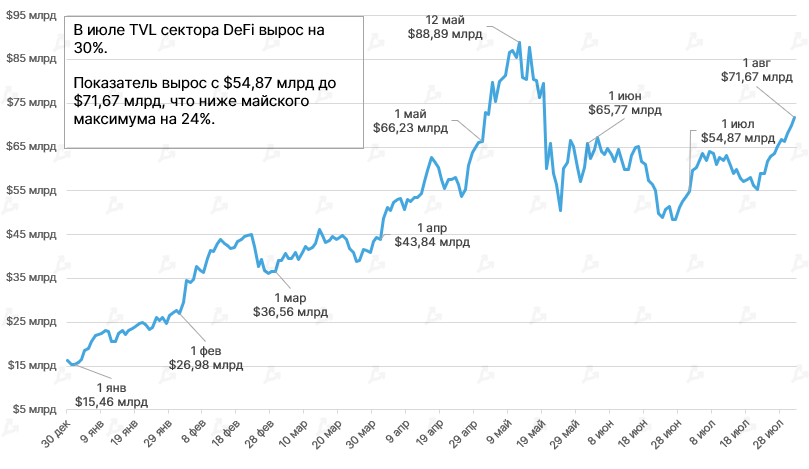
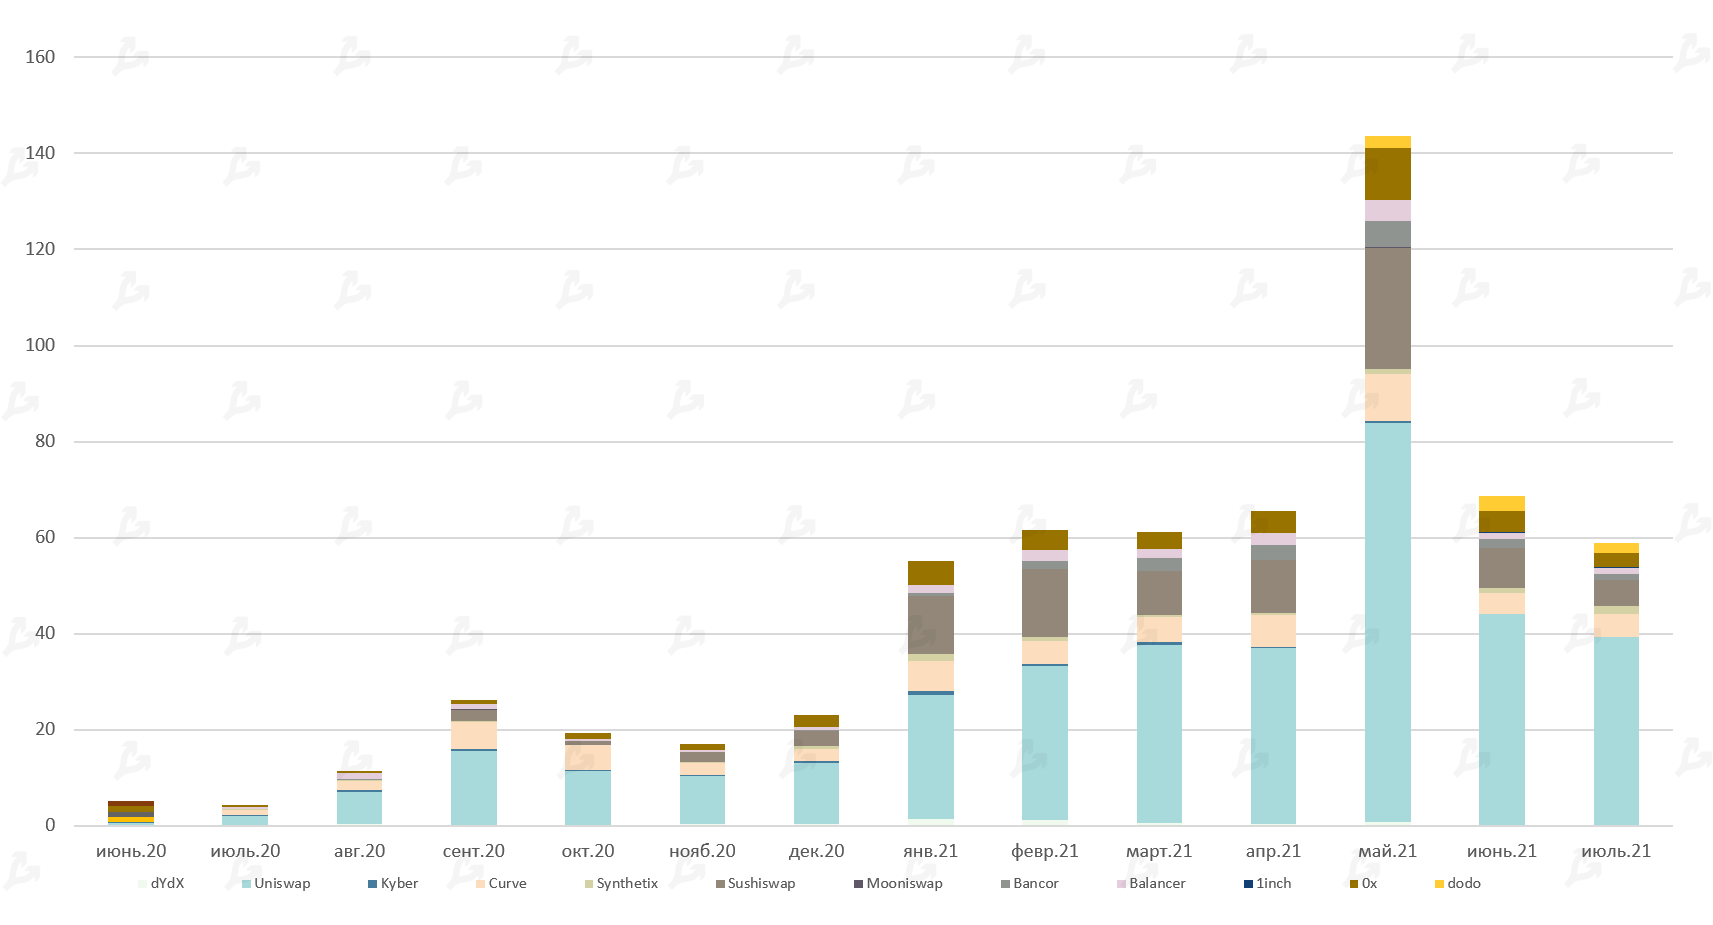
- Last month the DeFi segment’s decline gave way to a confident rebound. TVL rose 30% to top $70 billion.
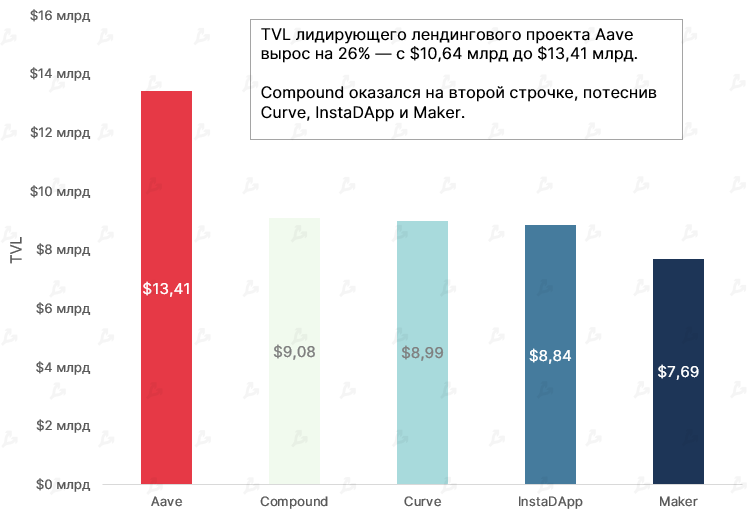
- TVL in leading lending protocol Aave surpassed $13 billion. This could have been aided by market revival and adding support from Polygon for faster, cheaper transactions.
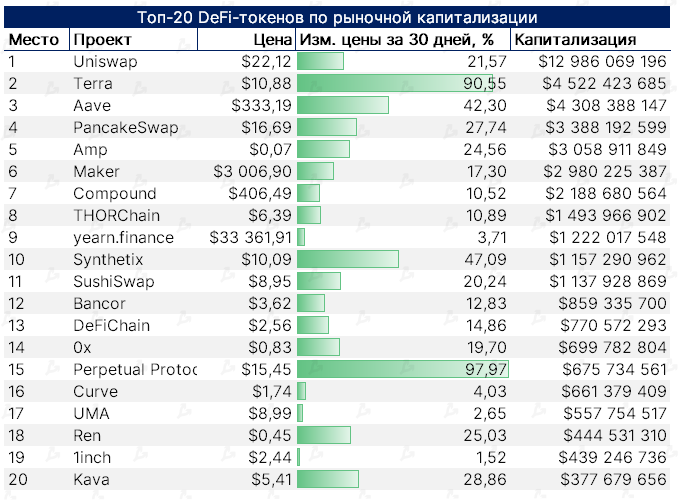

- Among the top-20, Terra and Perpetual Protocol assets surged most (>90%). Uniswap continues to lead by market cap, with UNI trailing by a long margin.
- As before, the DeFi space remains dominated by lending services and decentralized exchanges. Yield aggregators such as yearn.finance (Asset Management category) are gaining traction.
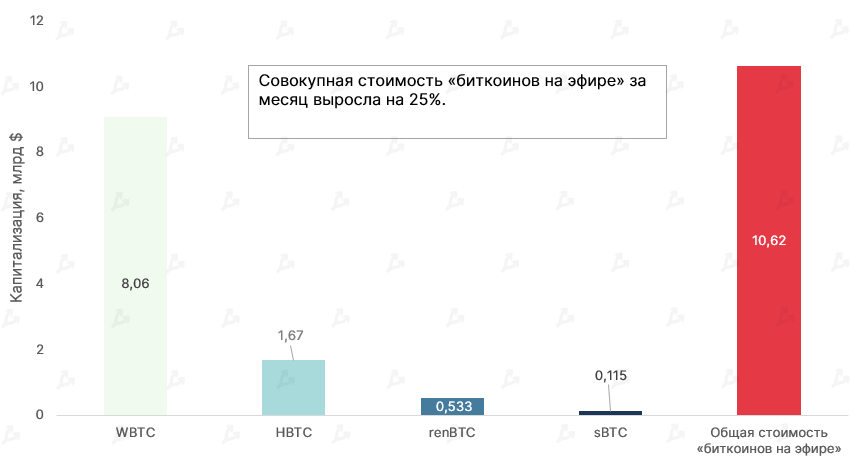
- Against a backdrop of Bitcoin price recovery, the aggregate value of “Bitcoin on Ethereum” rose to above $10 billion. The share of Wrapped Bitcoin (WBTC) in the segment exceeds 75%.
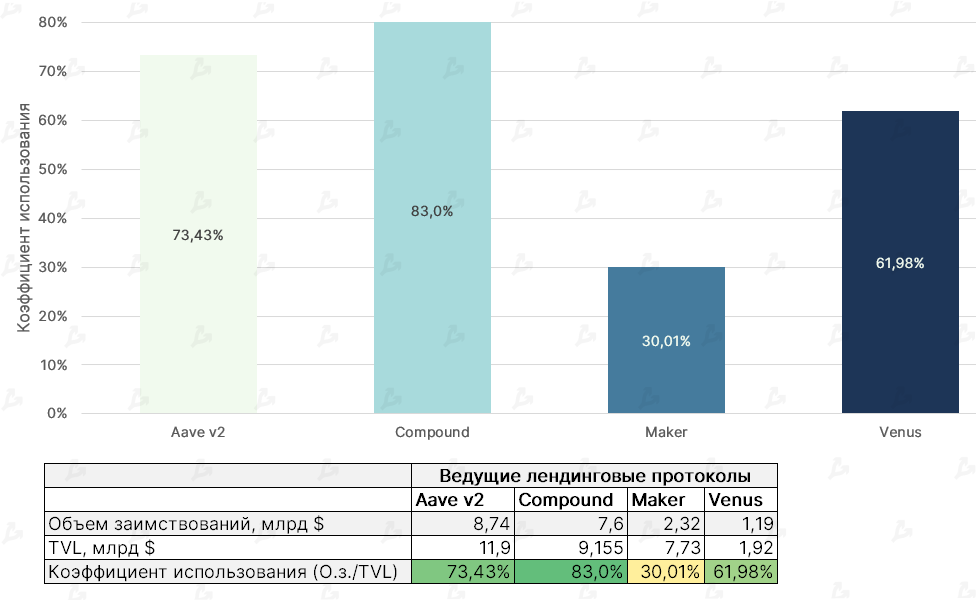
- Among lending protocols, Compound has the highest debt-utilization ratio relative to TVL, indicating heavy use of locked funds as collateral for loans. Maker has the lowest, helping explain its lower ranking on DeFi Pulse.
For more on indicators used to evaluate DeFi projects, see our review.


 “Gold is finite and hard to mine. Bitcoin is a mathematical wonder. I don’t invest in it, but I believe it has a future.”Steve WozniakCo-founder of Apple
 “The most profitable trade is going against traditional media narratives about Bitcoin.”Will WuAnalyst
 “I’m skeptical about the green mining narratives — when I read arguments claiming Bitcoin mining is already green, it sounds more like corporate lobbying propaganda. Green mining looks realistic only in the long term.”Matthew GrahamCEO Sino Global Capital
 “Industry participants should devote resources to offset the negative impact of mining and support a gradual transition to sustainable renewable energy. This seems feasible to me; I don’t see any problems.”Sam Bankman-FriedCEO FTX