July 2022 in Numbers: market braces for The Merge and exits the zone of extreme fear
ForkLog
Key
Market capitalization surpassed $1 trillion as crypto markets consolidated.
Interest in Ethereum-based derivatives rose on The Merge expectations.
DeFi protocols Aave and Curve announced launches of algorithmic stablecoins.
On‑chain indicators point to a market cycle bottom and improving investor sentiment.
Mining difficulty continues to fall, but hash rate is already turning up.
“Fear and Greed Index” has moved beyond the “extreme fear” range.
With risk adjustments, Ethereum has become one of the most efficient assets.
The Tron ecosystem rose to third place by volume of assets locked in DeFi apps.
The popularity of liquid staking projects is rising.
Performance of Leading Assets
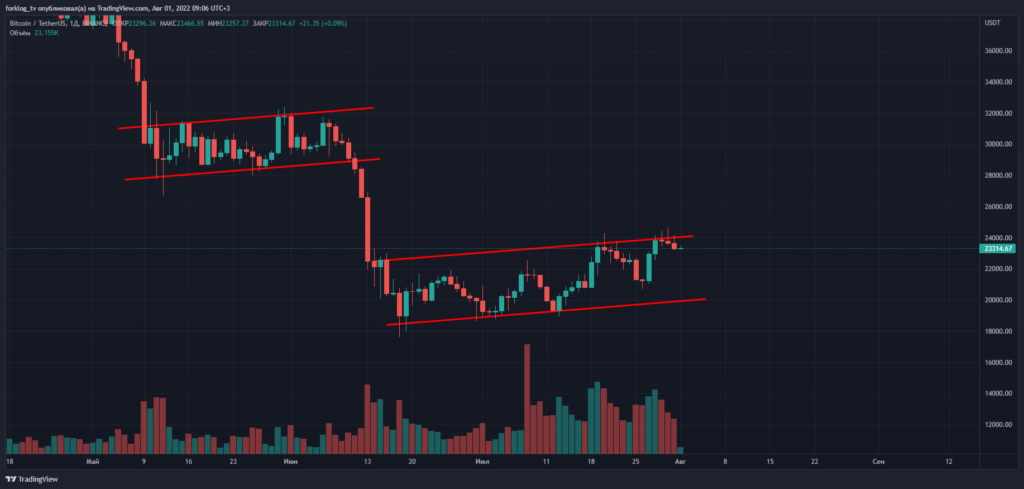
Daily BTC/USDT chart on Binance. Data: TradingView.
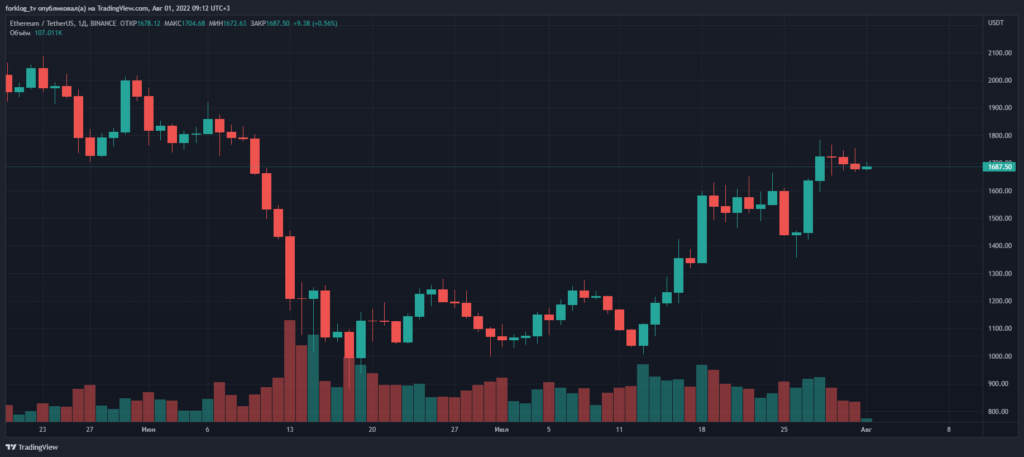
Daily ETH/USDT chart on Binance. Data: TradingView.
In July, leading cryptocurrencies and most altcoins consolidated after the biggest monthly drop since 2011. The move occurred as the Federal Reserve hiked rates and US GDP contracted.
Bitcoin rose 16.8% for the month, and Ethereum 56.6%. The crypto market capitalization returned to above $1 trillion.
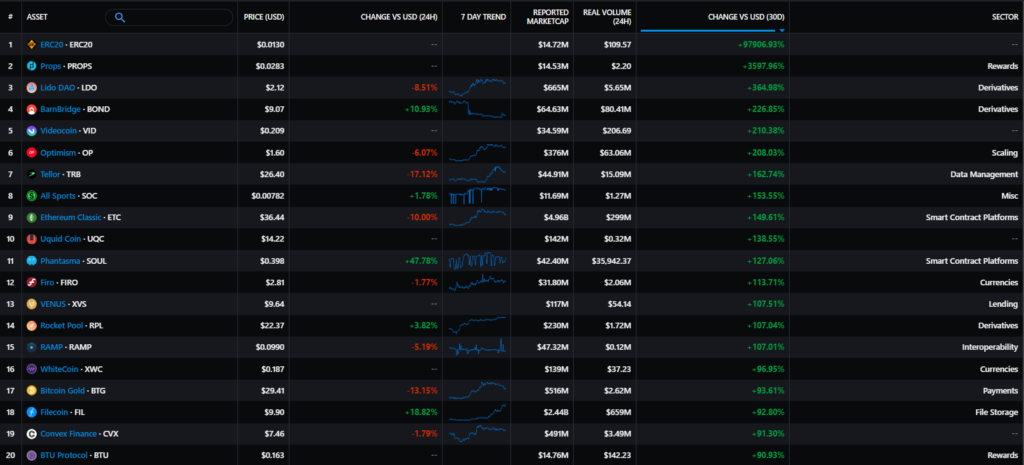
The LDO token from Lido rose by more than 350% on the back of recovering stETH/ETH peg. Positive momentum was also shown by the OP token of the Optimism L2 protocol (over 200%) amid a series of announcements and the Bedrock upgrade looming.
Old-guard assets like Ethereum Classic and Bitcoin Gold were not spared. ETC rose by almost 150% after the Ethereum developers announced that the Goerli testnet would move to PoS for the upcoming Goerli testnet. In this light, the community anticipates migration of Ethereum miners to the PoW protocol of a “closely related” network. Given that the ecosystem is already supported by miners and Vitalik Buterin has publicly weighed in, a further ETC rally appears likely as we approach the merge.
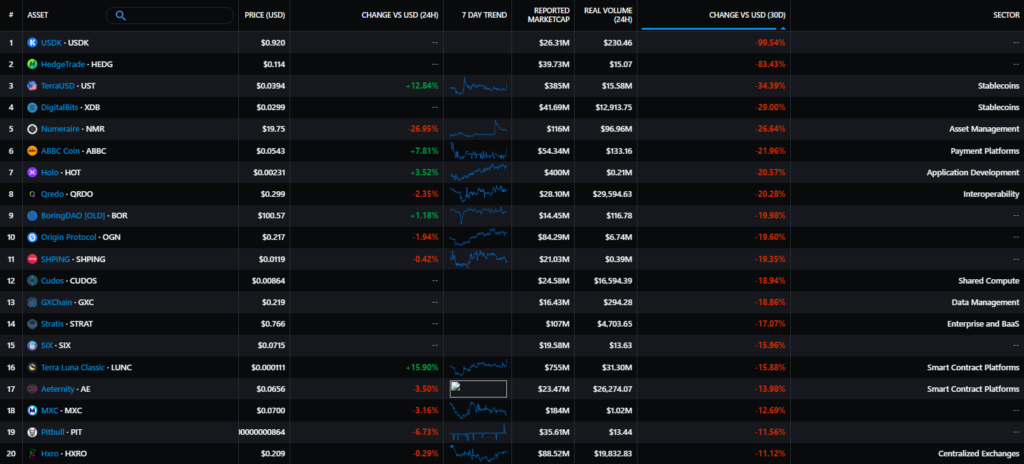
Among the underperformers were assets of the collapsed Terra ecosystem in light of investigations into its collapse by law enforcement and raids on top executives.
The bulk of publicly traded crypto miners and related stocks rose in step with the overall market rebound. Voyager Digital was the exception, filing for bankruptcy. Marathon Digital posted a record month, with shares up 140%. The company reiterated its HODL stance despite heavy selling pressure from public miners.
Macro backdrop
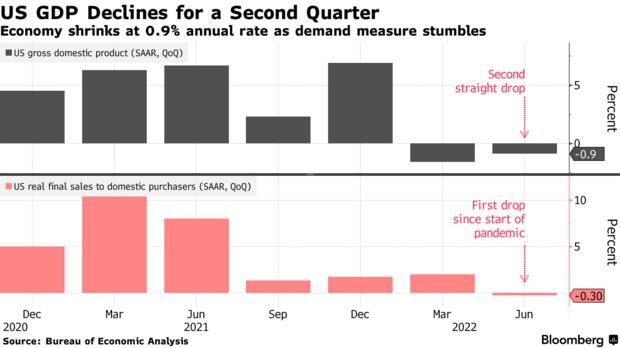
Quarterly dynamics of US GDP in annual terms. Data: Bloomberg.
Following July’s meeting, the FOMC again raised the key rate — by 75 basis points (to 2.25%–2.50%).
Fed Chair Jerome Powell warned that September could bring a “big uptick” in a key indicator. Yet the market focused on the line that future policy steps will depend on the nature of incoming data.
Investors began pricing in stronger recession signals in the economy, which were later confirmed in the initial second-quarter GDP estimate. This could lead the Fed to end the tightening cycle sooner than had been anticipated.
Powell’s two key inflation indicators for the Fed — the PCE Price Index and labor costs — have yet to confirm a peak in inflation.
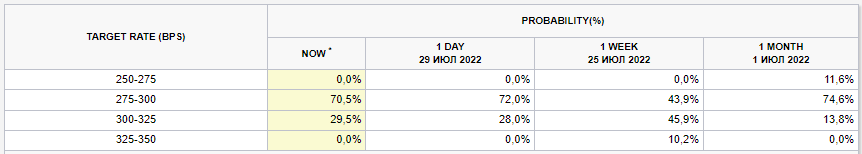
Probability distribution of the target rate after the FOMC meeting. Data: CME FedWatch.
The market is pricing in a September rate increase of 0.50% (probability rose from 53.1% ahead of the meeting to 70.5%) with a final 0.25% hikes in November and December.
By the end of July, the rebound in equities and Bitcoin continued. August could be shaped by the rhetoric of Fed officials (a bullish backdrop could prompt tighter signals) and a fresh batch of macro data in the US. The focus will be on the ISM index (3 August) and the jobs report (5 August). In the inflationary context — the OPEC+ meeting on 3 August.
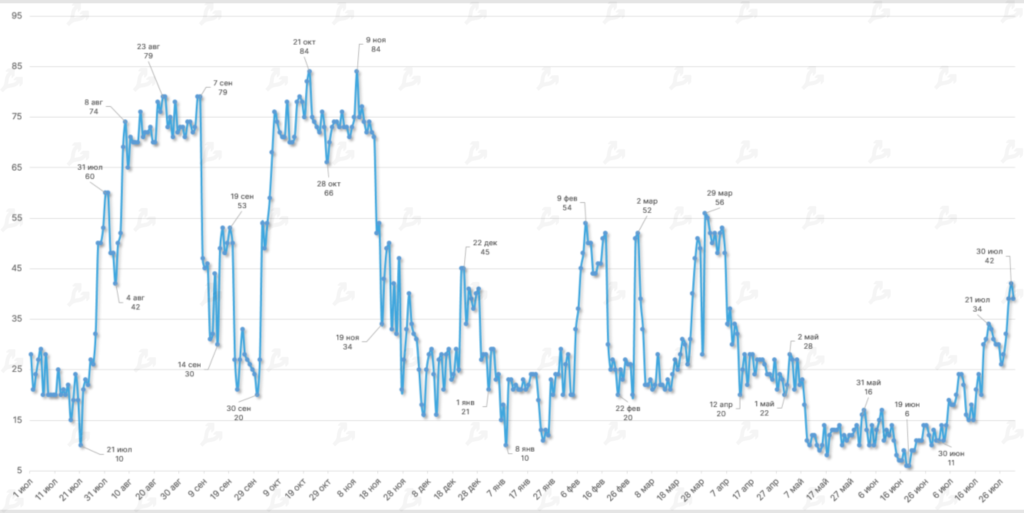
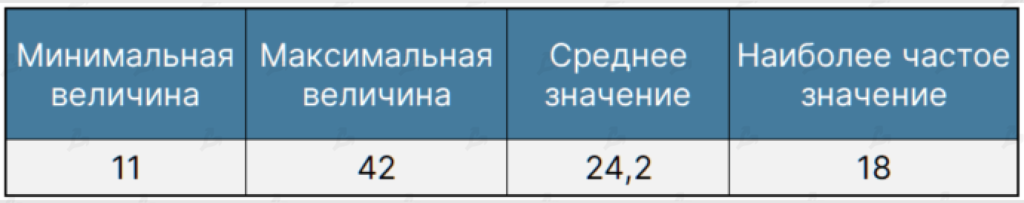
Compared to June, in July the average Fear and Greed Index rose more than twofold (11.3 vs 24.2). However the indicator did not breach the “fear” band — at a local peak it reached 42.
Since mid-May the indicator has resided in the “extreme fear” zone and exited it only at the start of the previous month. This signals a shift in investor sentiment and is one of the signs of a potential market-trend reversal.
Compared with June, in July the average Fear-to-Greed index rose to 11.3 from 24.2. However, the indicator failed to breach the “extreme fear” zone — at the local peak it reached 42.
Since mid-May the index has been in the “extreme fear” zone and exited it only at the start of the previous month. This points to a shift in investor sentiment and is one of the signs of a potential trend reversal.
Compared with June, the July average Fear-and-Greed Index rose more than twofold (11.3 vs 24.2). Yet the indicator did not exit the “fear” band — on a local peak it reached 42.
Since mid-May, the indicator has sat in the “extreme fear” zone and left it only at the start of the previous month. This signals a shift in investor sentiment and is one of the signs of a potential break in the market trend.
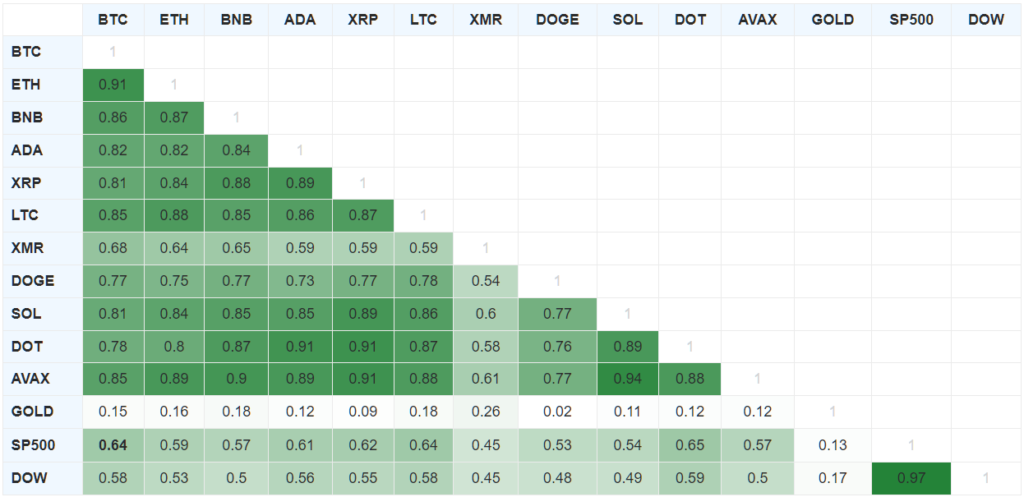
90-day indicators of asset correlations. Data: BlockchainCenter.
Compared with June, in July the average Fear and Greed Index rose to 11.3 from 24.2. However, the indicator did not move beyond the “extreme fear” range — at the local peak it reached 42.
Since mid-May the indicator has been in the “extreme fear” zone and exited it only at the start of the previous month. This signals a shift in investor sentiment and is a sign of a potential breakdown in the market trend.
Compared with June, in July the average Fear and Greed Index rose to 11.3 from 24.2. However, the indicator did not move beyond the “extreme fear” range — at the local peak it reached 42.
Since mid-May the indicator has been in the “extreme fear” zone and exited it only at the start of the previous month. This signals a shift in investor sentiment and is one of the signs of a potential break in the market trend.
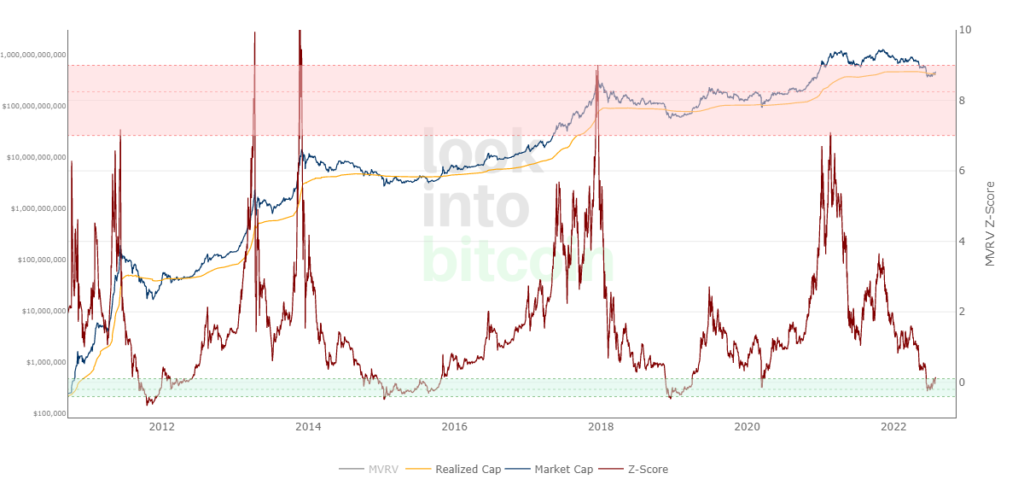
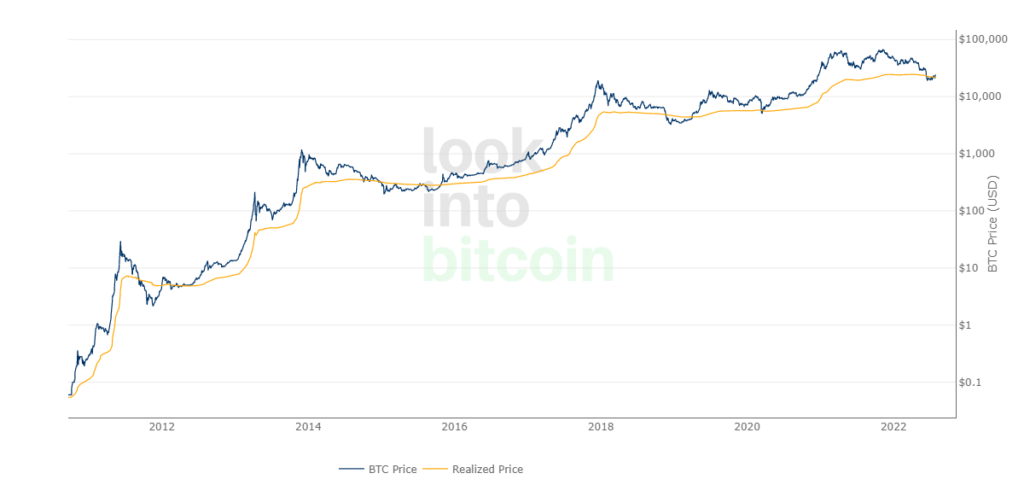
Market and realized price dynamics for Bitcoin. Data: Look Into Bitcoin.
On 28 July, the MVRV Z-Score crossed the upper bound of a deeply oversold zone at 0.1. This is another signal that the market cycle has bottomed.
The Bitcoin price surpassed its realized value. This points to improved market sentiment and indicates that many investors have stopped realizing losses.
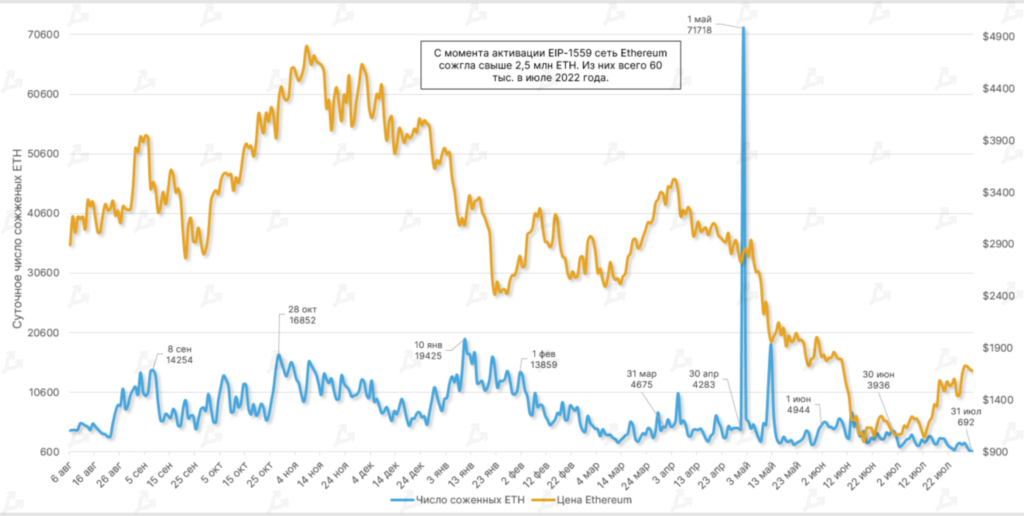
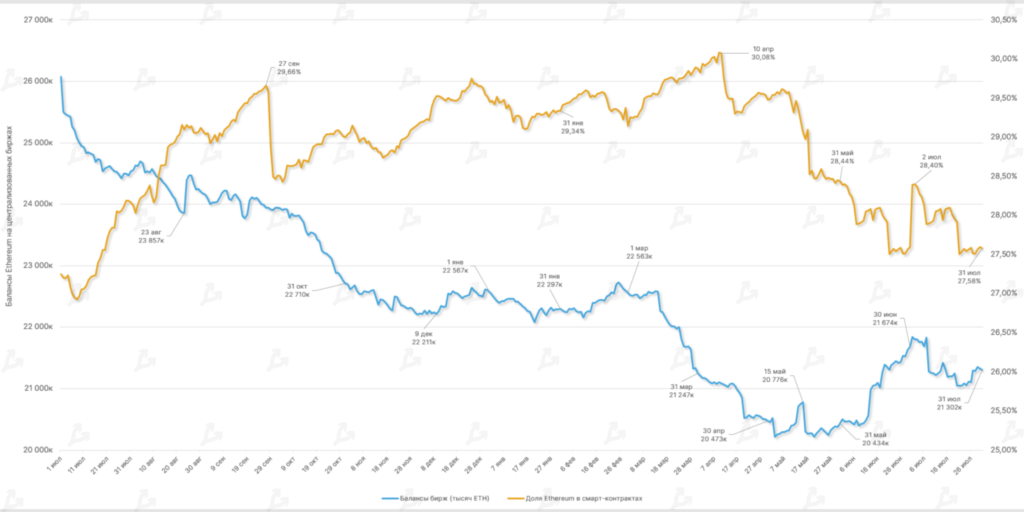
Balances on centralized exchanges and the share of ETH involved in smart contracts. Data: Glassnode.
Since the activation of EIP-1559 in August 2021, the Ethereum network has burned more than 2.5 million ETH. Compared with the prior month in July, the burn rate halved — 120,000 ETH versus 60,000 ETH.
This dynamic is explained by reduced activity on decentralized exchanges and NFT marketplaces, which are the main burn mechanisms. This, in turn, is linked to market conditions.
Against a local Ethereum rally in the latter half of the month, there was inflow of assets to wallets on centralized exchanges. The share of ETH locked in DeFi smart contracts, by contrast, fell by almost 1%.
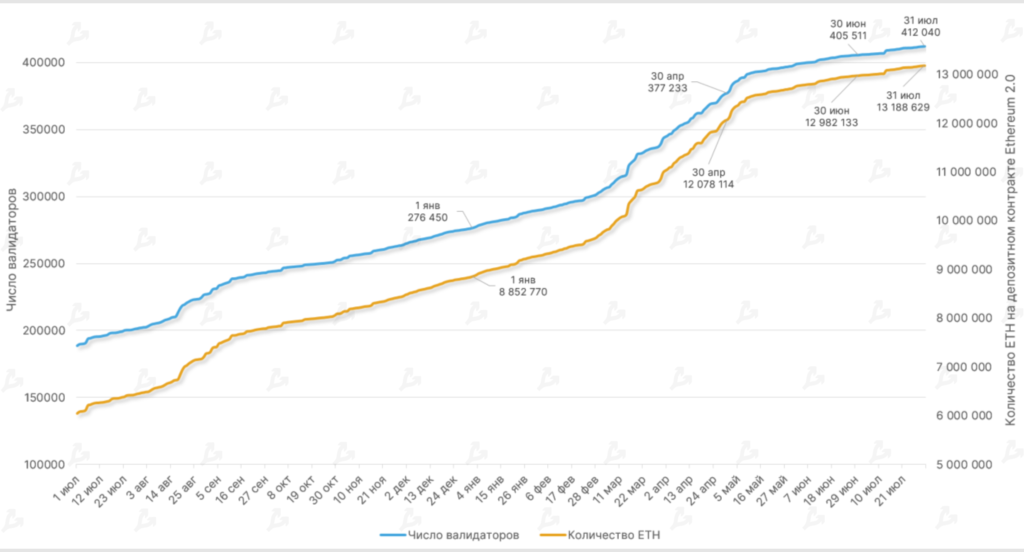
Dynamic of ETH on the Ethereum 2.0 deposit contract and number of validators. Data: Glassnode.
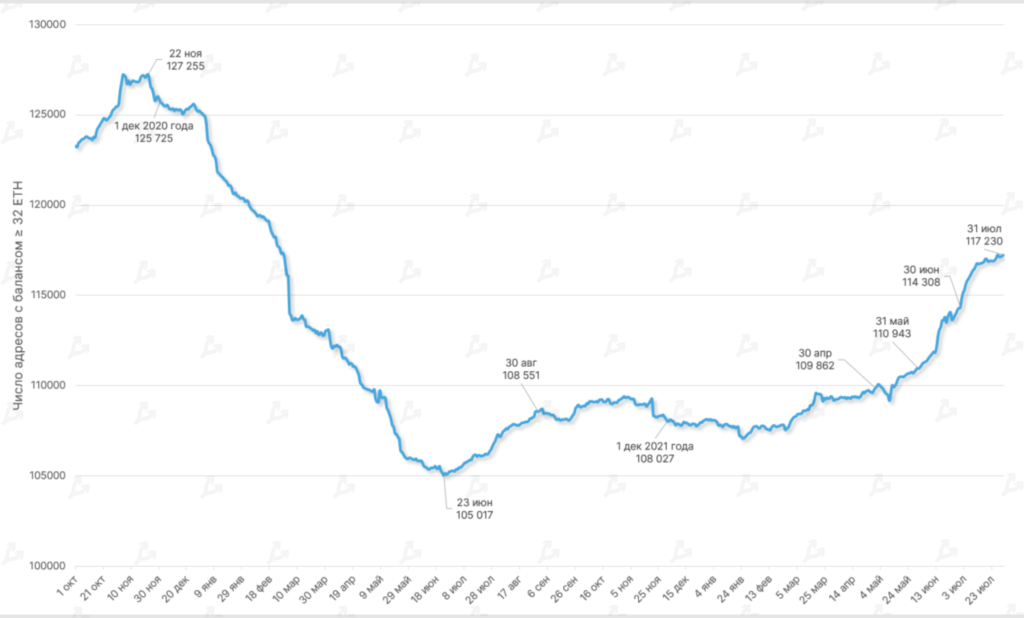
Dynamic of Ethereum addresses with balance ≥ 32 ETH. Data: Glassnode.
At July’s end, the number of ETH on the Ethereum 2.0 deposit contract exceeded 13.18 million coins. The monthly increase was 1.5% — in the previous month it rose 1.9%, in May 5.4%.
Active addresses interacting with the second iteration of Ethereum rose by 1.6% (1.9% in June).
The pace of growth of these metrics softened slightly, likely due to the discount on stETH tokens from Lido, which trade about 2.5% below the underlying asset (on Curve).
The number of addresses with balance ≥ 32 ETH continued to rise. In July, the figure surpassed 177,000 (+2.5% vs last month).
Lightning Network
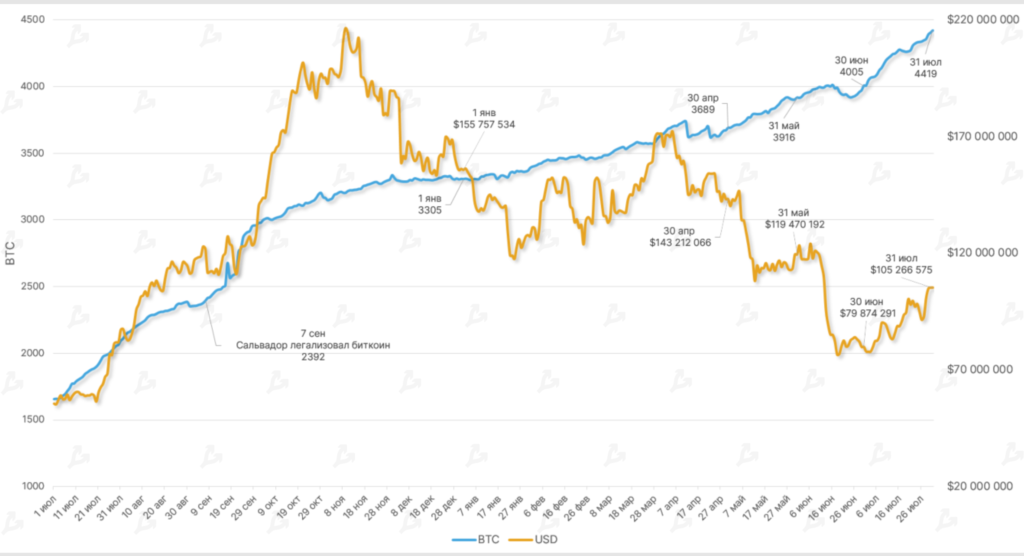
Network capacity of the Lightning Network. Data: Bitcoin Visuals.
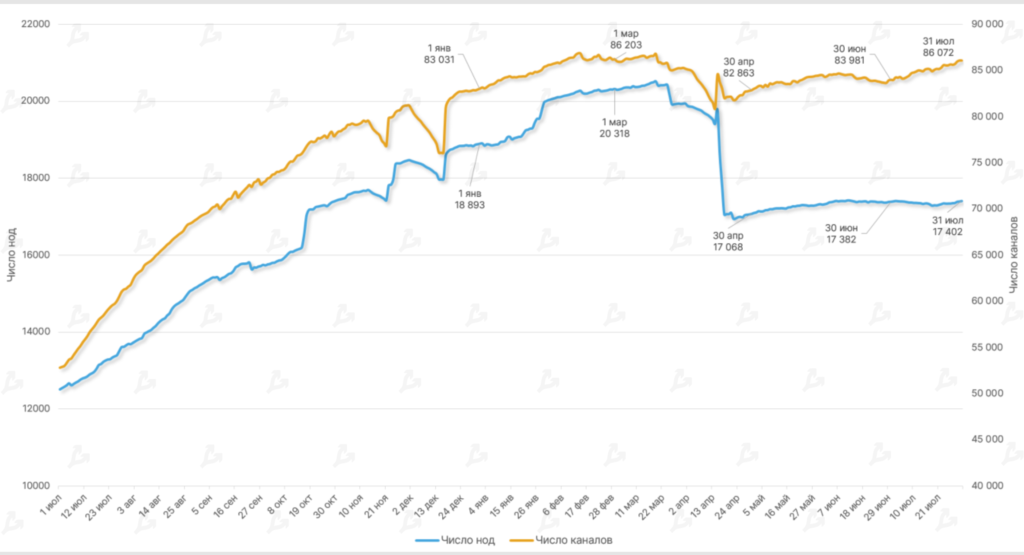
Number of Lightning Network nodes and channels. Data: Glassnode.
In July, LN capacity surpassed 4419 BTC — up about 10% from the prior month.
Capacity growth accompanied by only a modest rise in the number of channels; the number of LN nodes remained almost unchanged.
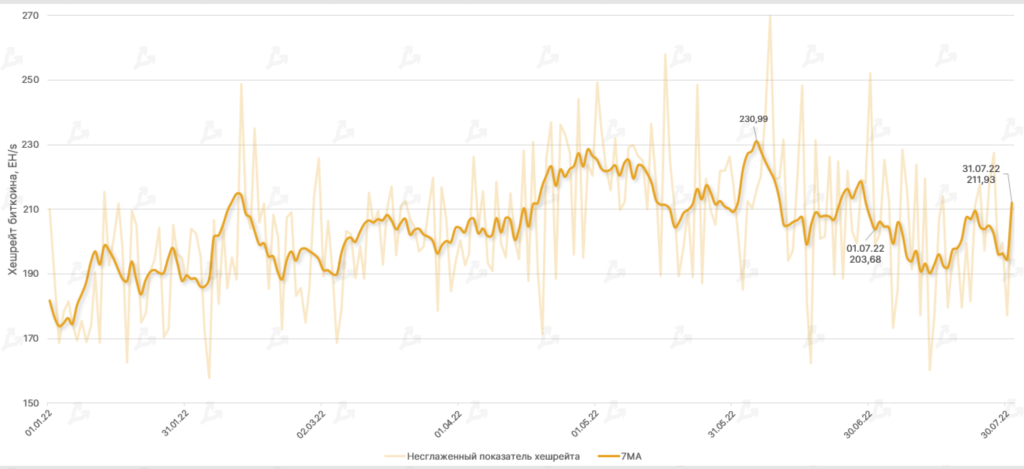
Bitcoin hash rate (7 MA) rose 4% to 211.93 EH/s. Since the start of the year, the reading is up 16.6%. The uptick in hash rate may reflect a gradual revival of price, bringing older mining hardware back online.
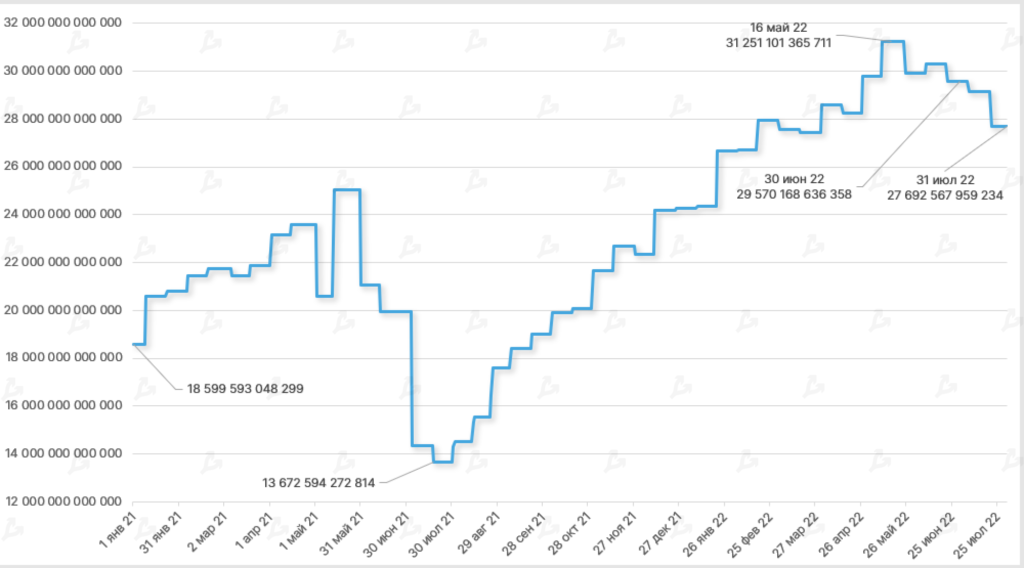
As hash rate climbs with price recovery, a rebound in network difficulty is expected.
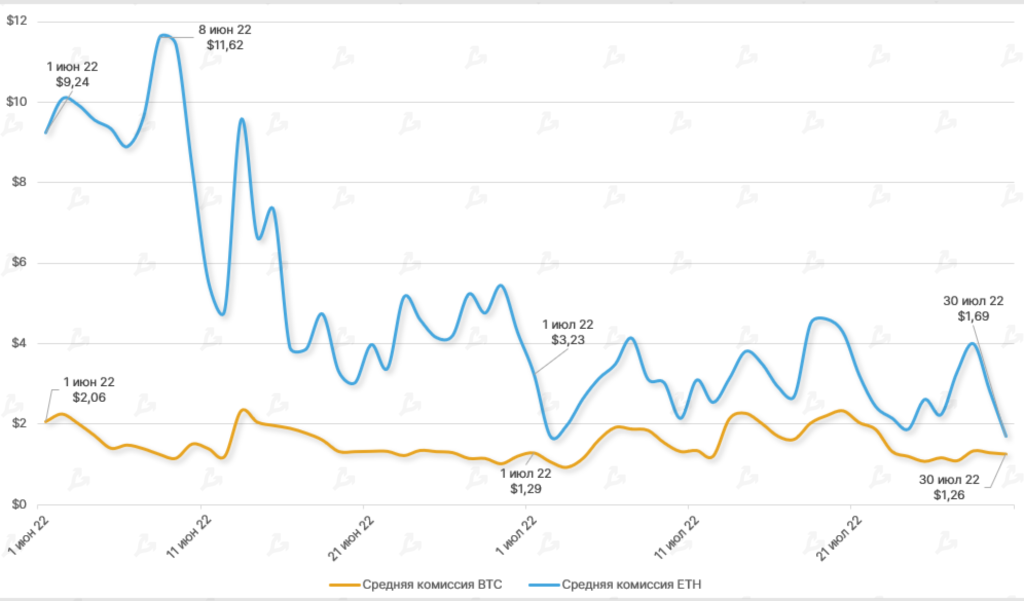
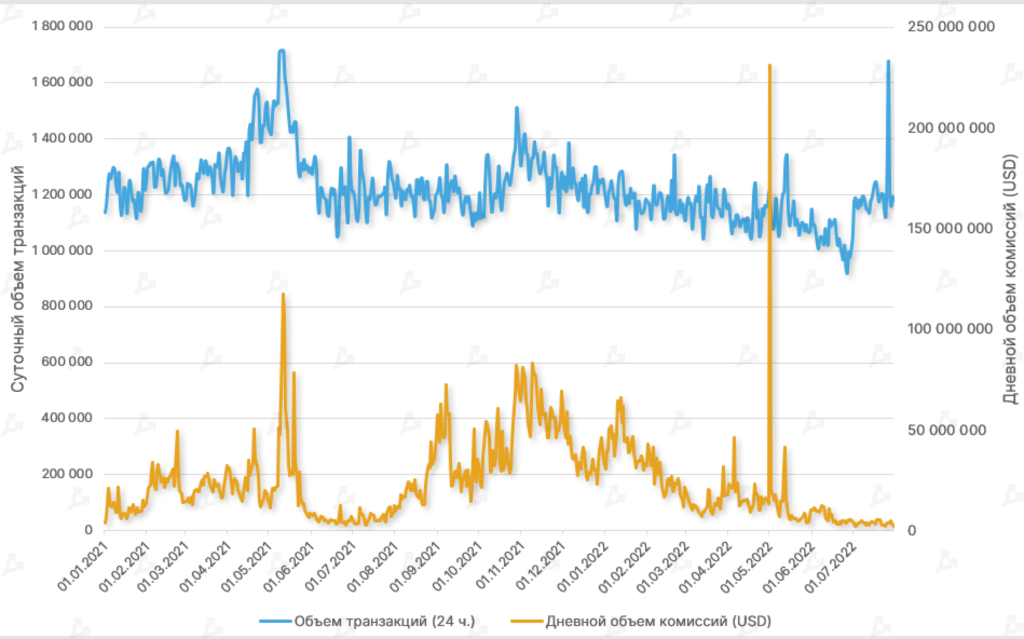
Dynamic of average transaction fee for BTC- and ETH-transactions. Data: Coin Metrics.
In July, the average Ethereum transaction fee fell 47% month-on-month. Fees rarely exceeded $4, signaling reduced activity in DeFi and NFT segments.
Daily Ethereum network fees in July were around 2.5% of November’s peak (~$1.9 million versus ~$82 million). In late 2021, the average fee per transaction was typically above $50.
Bitcoin network fees remained largely unchanged in July, occasionally edging above $2, indicating modest on-chain activity.
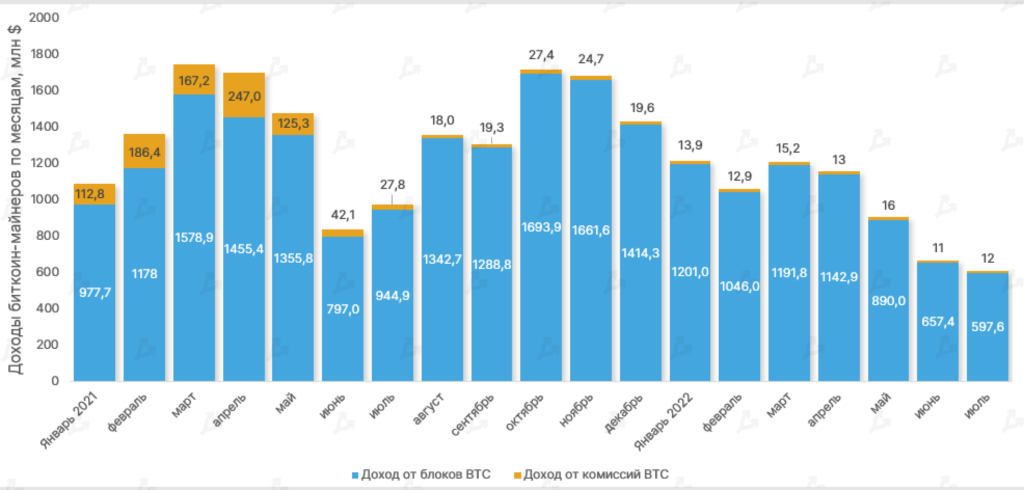
Bitcoin miner revenues by month, $mln. Data: Glassnode.
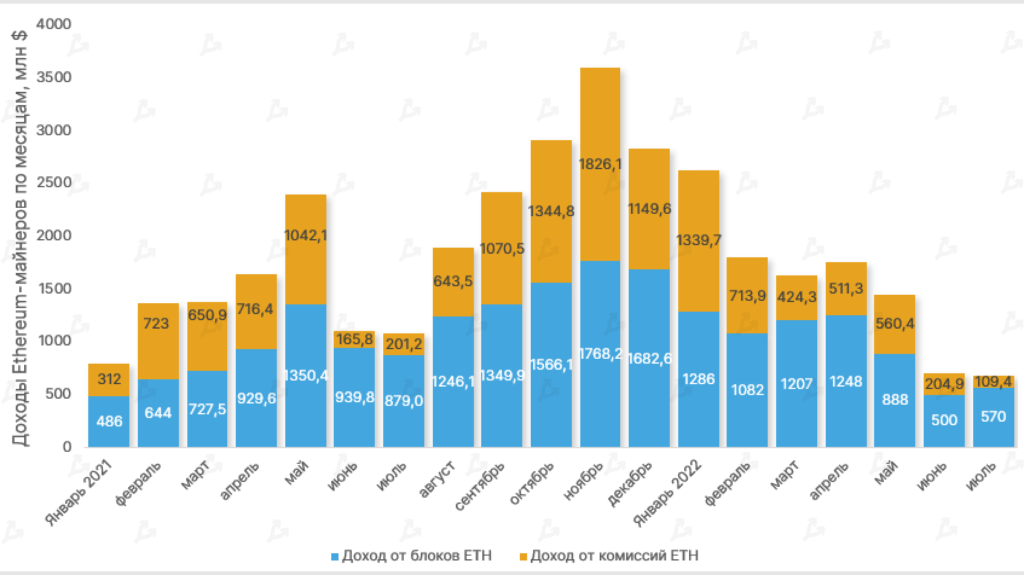
Revenue of Ethereum miners by month, $mln. Data: Glassnode.
In July, total Bitcoin miner revenue fell 9% to $609.7 million. The metric has been falling since March, but the pace of decline slowed. This points to a likely end of miner capitulation.
Total Ethereum miner revenue fell by only 4%, though in the previous period the drop exceeded 50%. This also argues for a market-cycle bottom.
Trading Volume
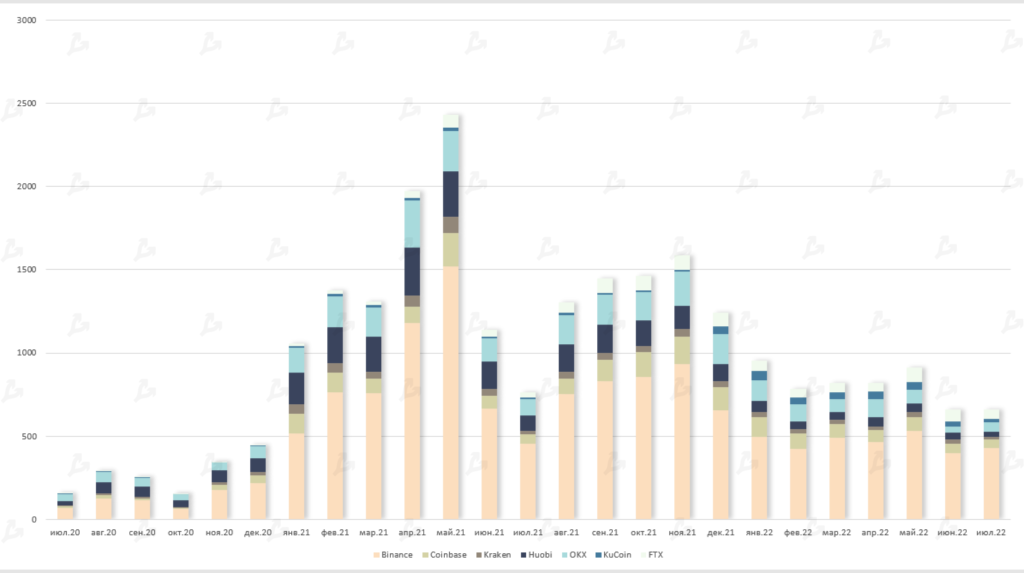
Trading volume on leading spot exchanges, $bln. Data: The Block.
Trading volume on leading crypto exchanges was unchanged from the previous month, reaching $660 billion.
FTX outpaced Coinbase in the last three months and climbed to second place in the overall exchange ranking. In July, volumes on their platforms stood at $56 and $51 billion. Coinbase dropped out of the top three, ceding to OKX with $54 billion. Binance remained the undisputed leader with $428 billion.
Futures and Options
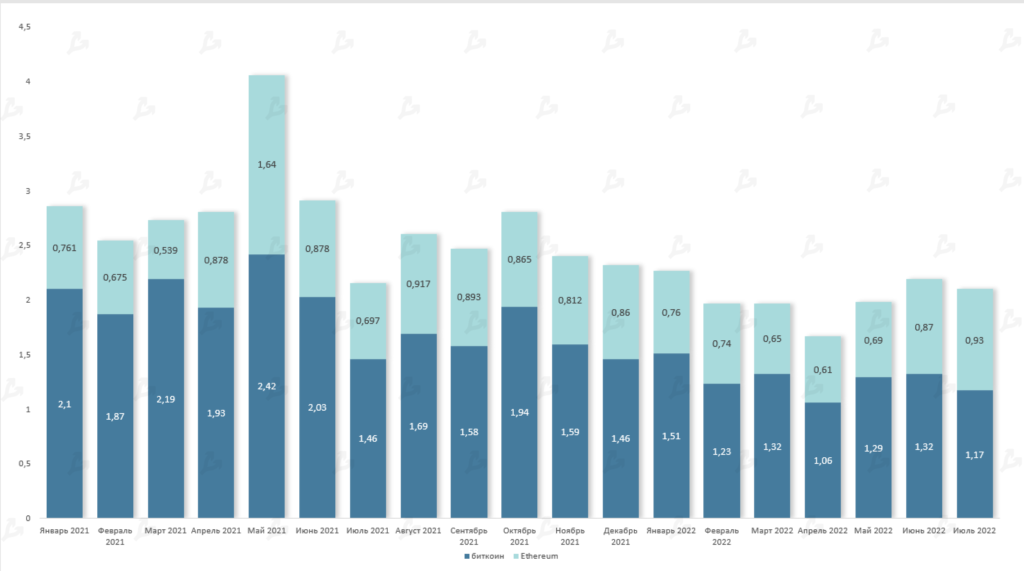
Bitcoin and Ethereum futures volumes, $trn. Data: Glassnode.
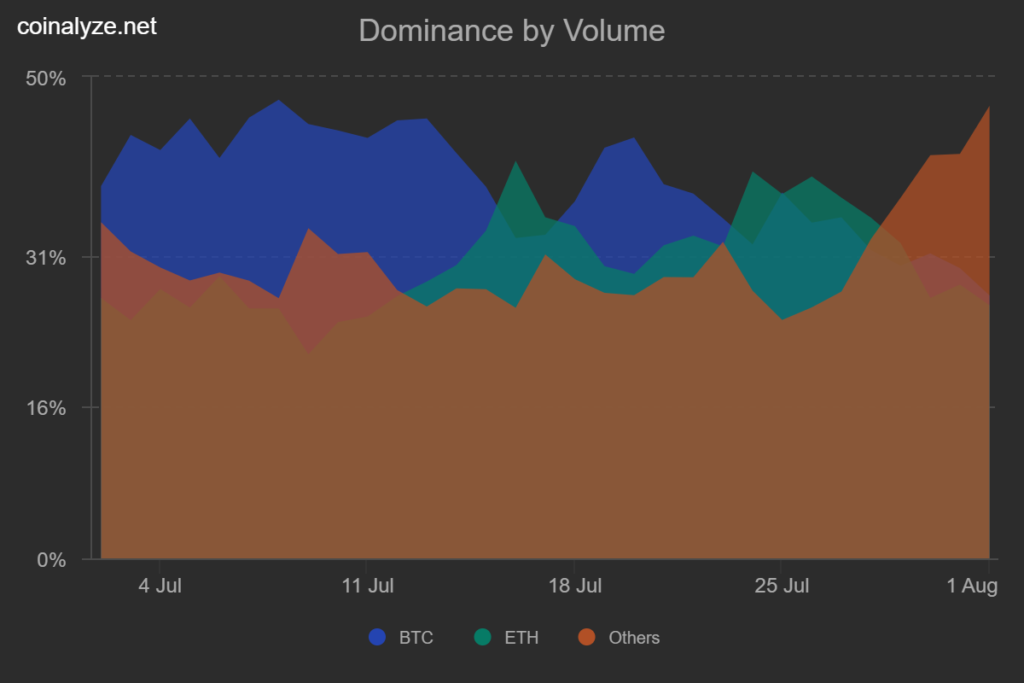
Share of futures on Bitcoin, Ethereum and altcoins in total volume. Data: Coinalyze.
July saw heightened investor interest in Ethereum-based futures — volumes reached $930 billion for the first time since May 2021. From 12 to 28 July, the daily figure exceeded the equivalent for all altcoin futures, and on some days even for Bitcoin futures.
Aggregate open interest rose 34.5% (from $19.5 to $26.2 billion). As Ethereum’s price rose, the share of liquidations in total open interest surpassed Bitcoin futures on several occasions.
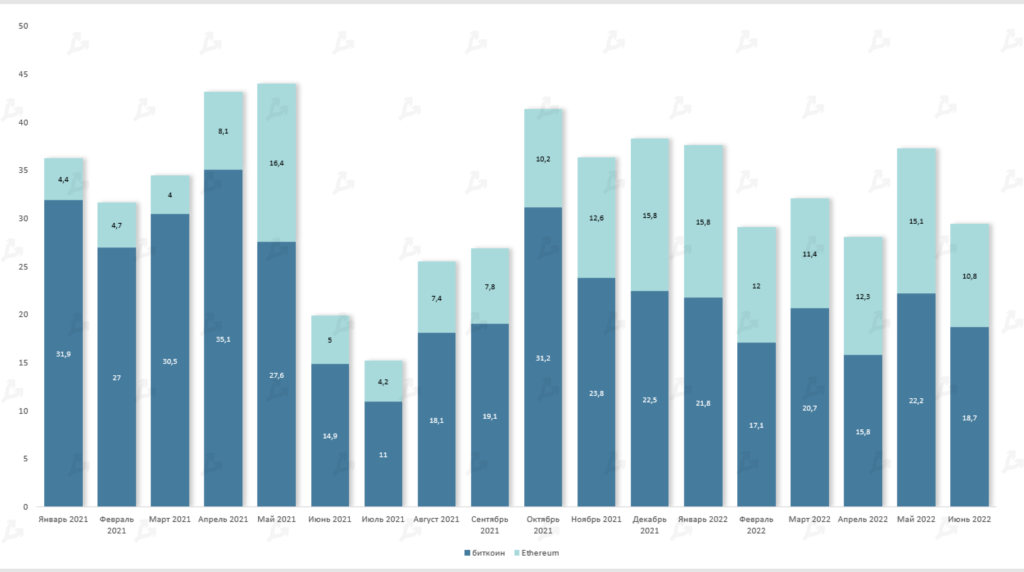
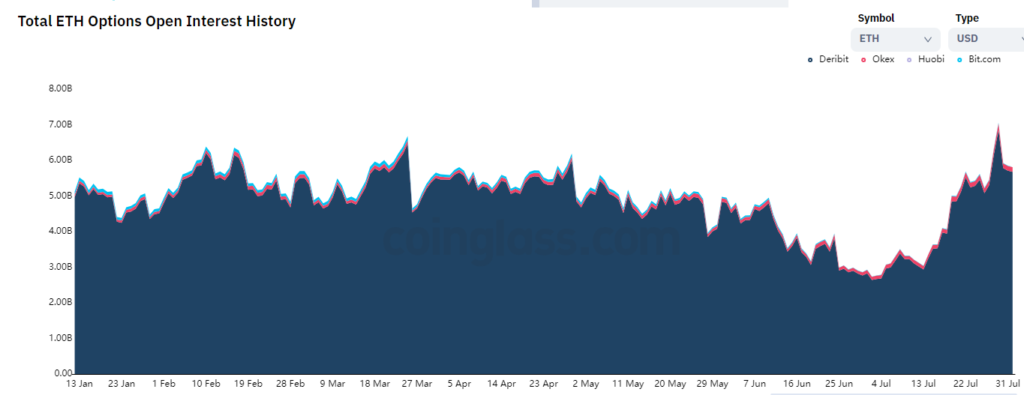
Volume of options trading on Bitcoin and Ethereum, $bln. Data: Glassnode.
Despite the absence of significant activity in the options segment, open interest in Ethereum options surpassed Bitcoin options and briefly exceeded $7 billion. The level matched May and November 2021, when the crypto market was aiming for new highs.
Options on Bitcoin and Ethereum traded volumes, $bln. Data: Glassnode.
Despite the absence of major activity in the options market, the open interest in Ethereum options surpassed Bitcoin options and at times exceeded $7 billion. The level matched May and November 2021 when the market sought new highs.
DeFi
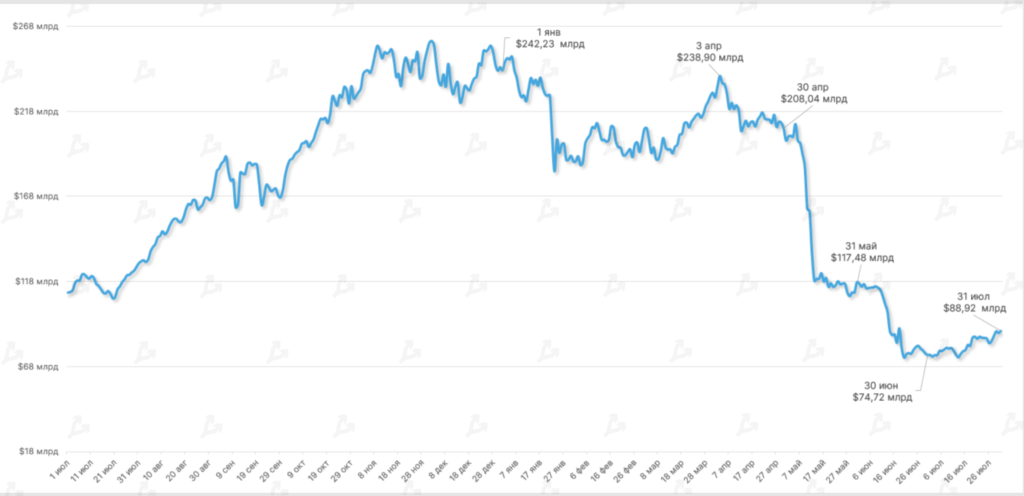
Dynamics of the value of assets locked in the DeFi sector. Data: DeFi Llama.
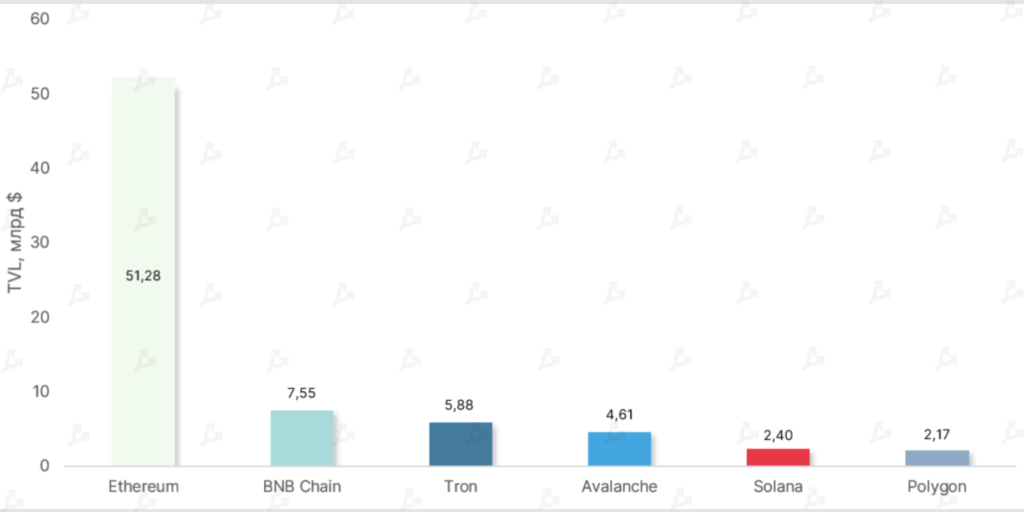
Top DeFi ecosystems by locked value, $bln. Data: DeFi Llama.
In July the TVL of DeFi smart contracts rose 18% to $88.92 billion, aided in part by a local rally in the market.
The unchanging leader by TVL is Ethereum, with $51.28 billion (vs $42.83 billion in June). The ETH-denominated value, however, fell 22% to 30.69 million ETH.
The Tron ecosystem rose to third place by TVL. Inflow to applications on that network totaled almost $25 billion TRX (+41% versus June).
The moves were driven by Justin Sun’s plan to spend up to $5 billion to rescue crypto companies and the fact that the team managed to restore parity of the algostablecoin USDD to the dollar.
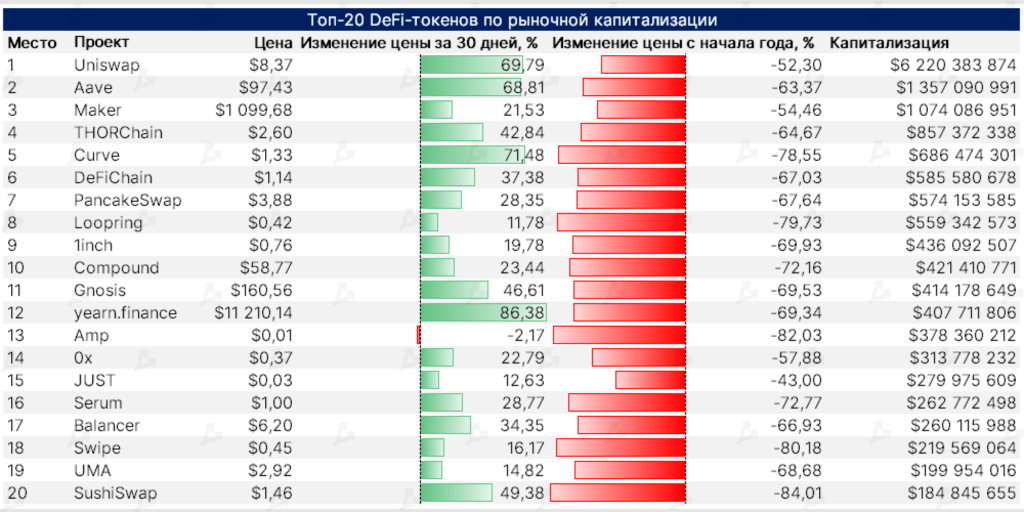
Top-20 DeFi assets by market capitalization. Data: Messari (as of 01.08.2022).
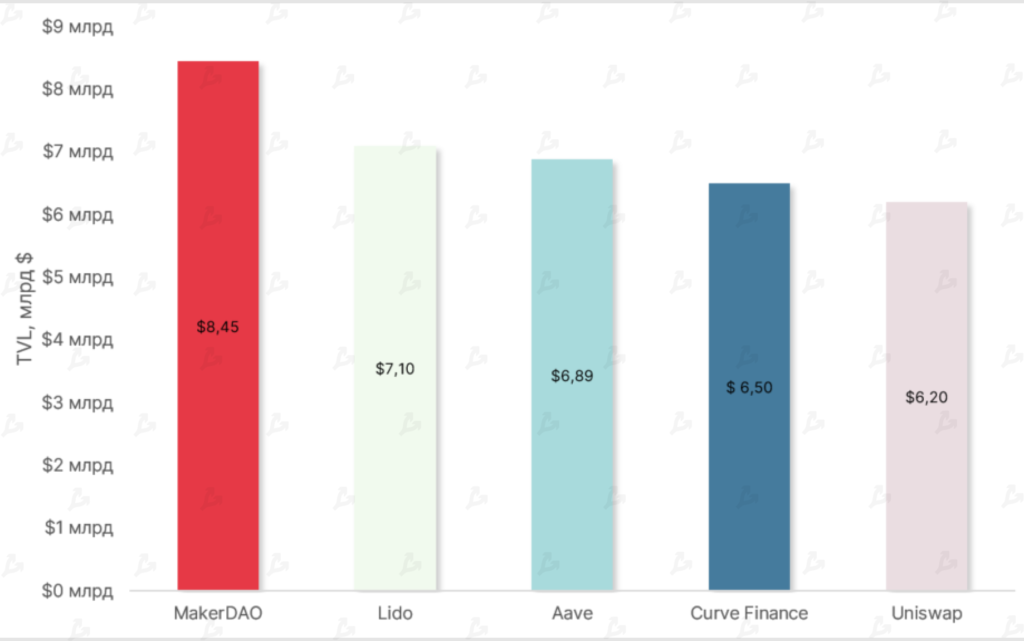
Top-5 DeFi projects on Ethereum by TVL, $bln. Data: DeFi Llama (as of 01.08.2022).
As of July, nearly all DeFi top-20 tokens by market cap were in the green — a reversal from Q2 2022.
The best performer was yEarn Finance’s YFI token — up 86% month over month. The improvement was aided by the service’s ERC-4626 integration.
The market value of Uniswap, Curve and SushiSwap tokens also rose significantly, signaling renewed user interest in decentralised platforms.
Among Ethereum-based projects, governance leader MakerDAO dominated TVL ($8.45 bln). In second place, Lido — up 52% in a month — after which the team announced the launch of the Ethereum 2.0 liquid-staking service on Layer-2 networks.
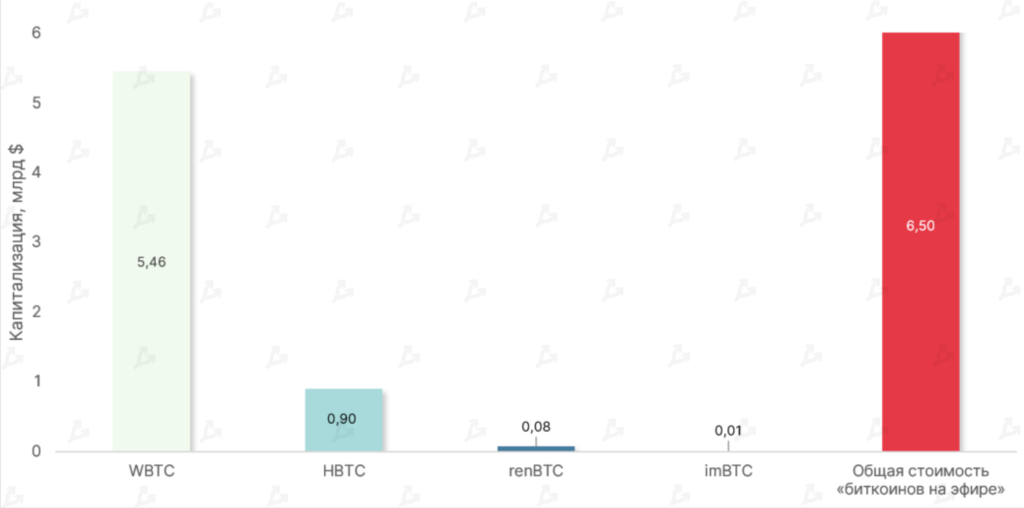
Capitalisation of popular Bitcoin on Ethereum, $bln. Data: Dune Analytics.
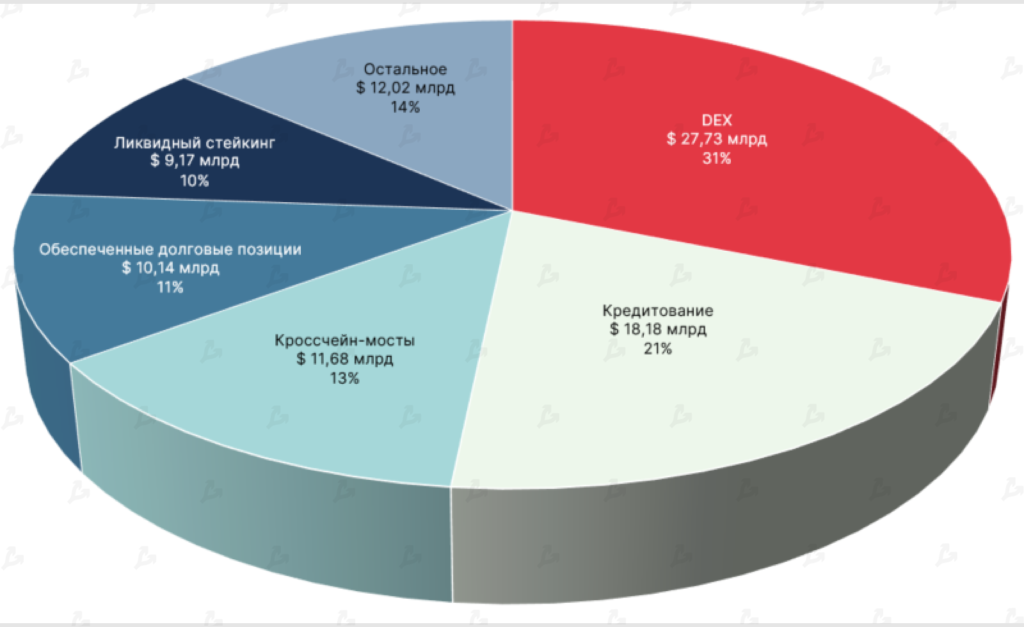
Decentralised exchanges remain dominant in DeFi TVL — more than 31% of the total, or $27.73 bln.
In second place are lending protocols ($18.18 bln), and third are cross-chain bridges ($11.68 bln).
Yield-farming projects have been displaced from the top-five, underscoring the popularity of this earnings method among DeFi users.
As July ends, the combined market cap of “Bitcoin on Ethereum” rose to $6.5 bln. The WBTC dominance index slipped to 84%.
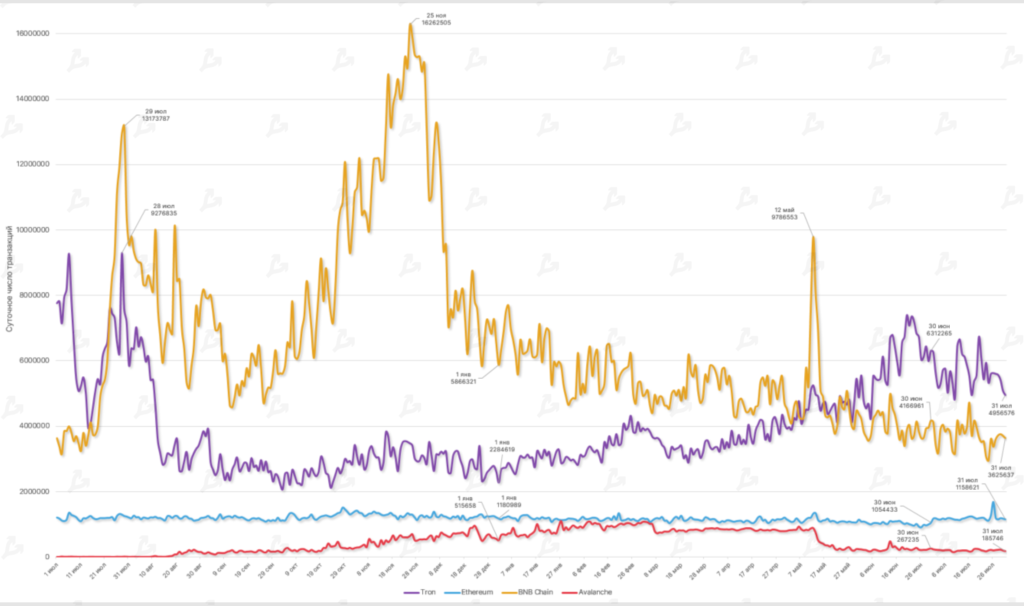
Daily transaction counts across Polygon, Ethereum, Binance Smart Chain and Avalanche ecosystems. Data: TronScan, Etherscan, BscScan, SnowTrace.
July saw a decline in average daily transactions across most networks studied. In Avalanche, the metric fell by 15%, partly due to traffic shifting to the subnets.
The Ethereum network processed around 1,199,149 transactions per day — up 15.7% from the previous month. Higher on-chain activity was driven by lower transaction fees — gas price on the network has fallen by 86% since the start of the year.
DEXs and Layer 2
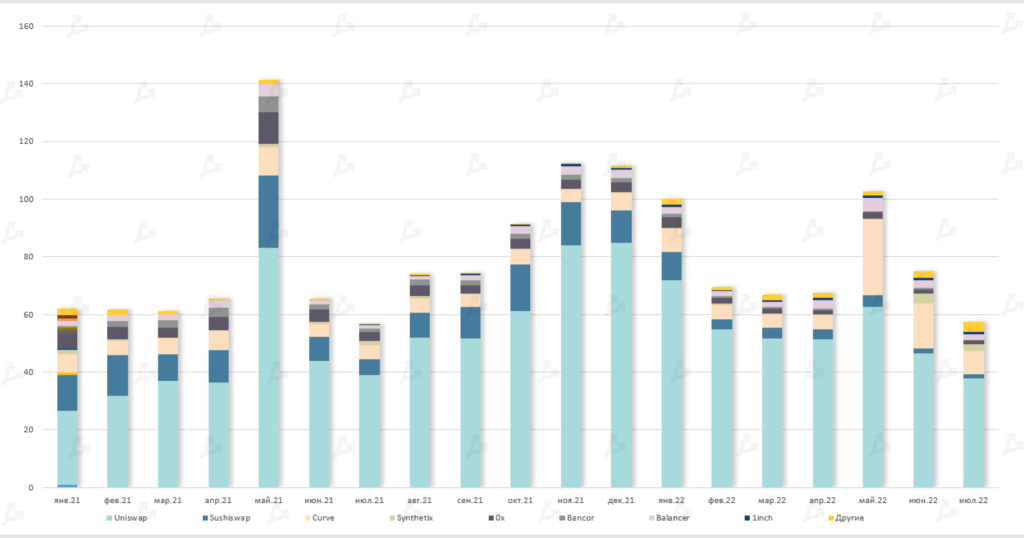
Trading volume on decentralised Ethereum exchanges, $bln. Data: Dune Analytics.
In July, the volume on leading decentralised Ethereum protocols reached $57.5 billion, the lowest for the year.
Uniswap dominates this segment. The platform’s turnover for the month was almost $38 billion. Runners-up were Curve and Synthetix, with around $8 billion and $2.5 billion respectively.
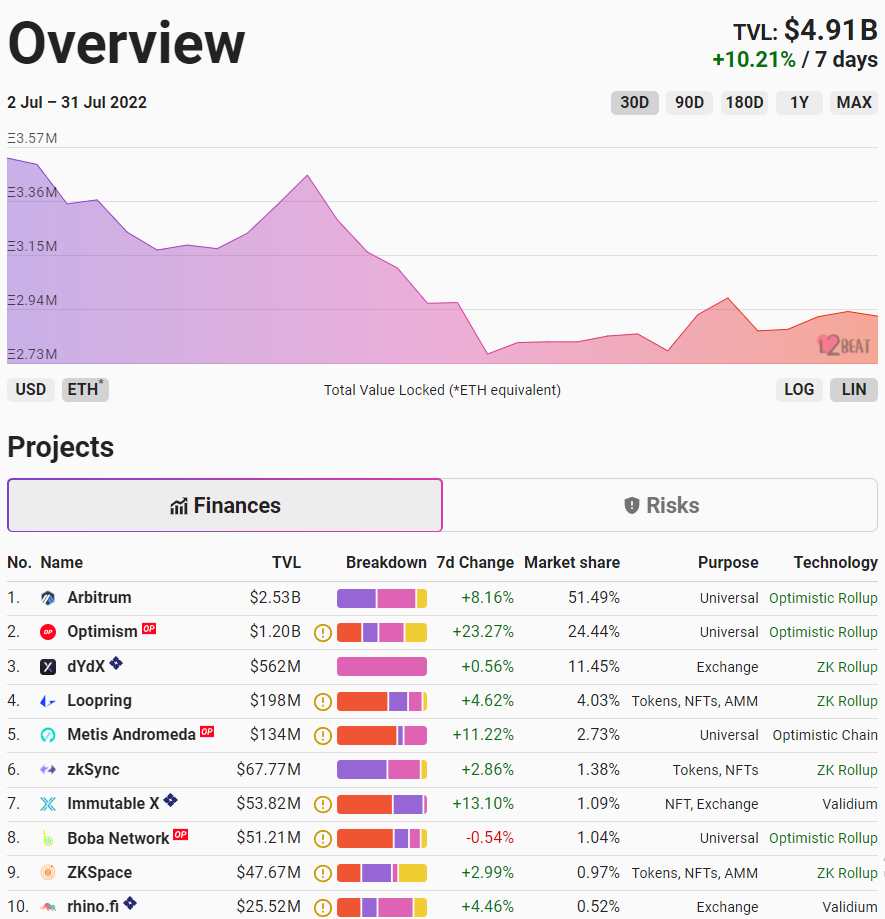
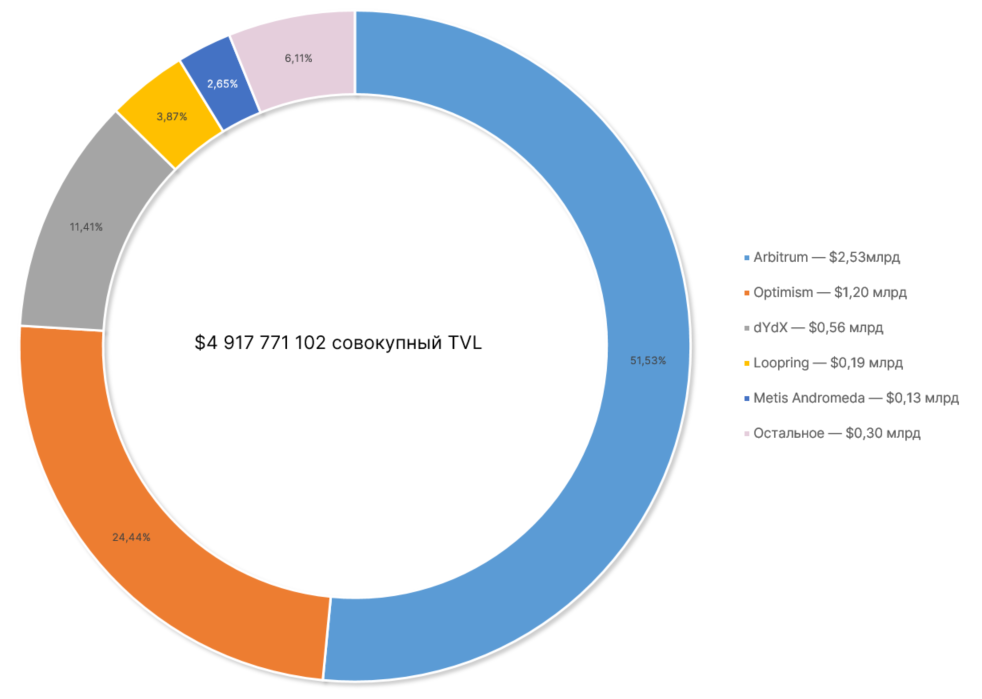
TVL in L2 protocols of the Ethereum network, in ETH and USD. Data: L2BEAT.
Ethereum price gains boosted TVL in Layer-2 protocols, while users withdrew 17% of total liquidity. Likely upwards of 615,000 ETH moved into yield-optimisation tools as market conditions improved.
More than 300,000 of these ETH left the Arbitrum protocol. One reason could be the postponement of Odyssey’s educational event. In mid-July the team rolled out the Nitro upgrade, which was necessary to resume Odyssey (timelines for restart remain unclear), and added support for Tron’s stablecoin USDD on the network.
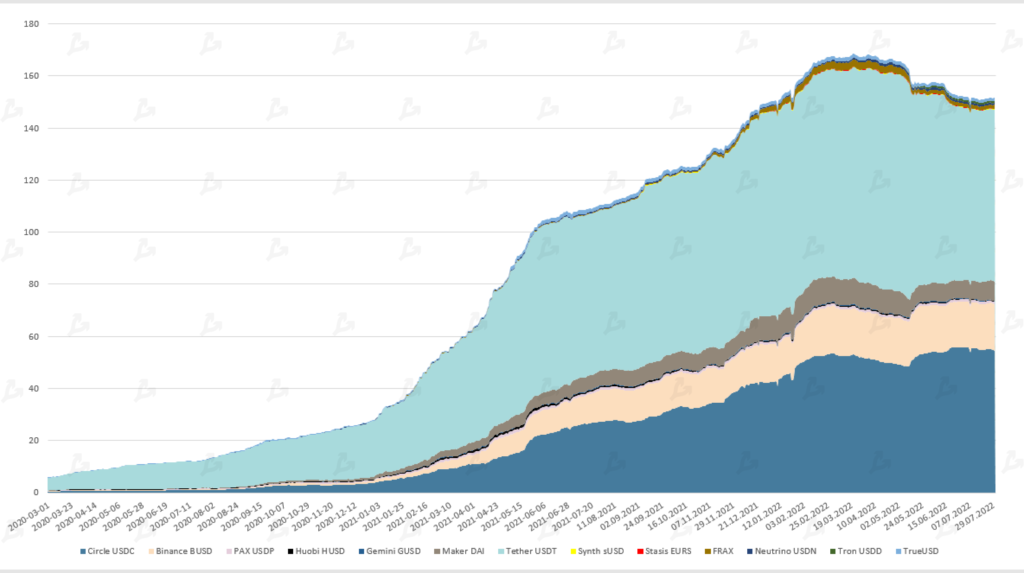
July’s market cap of stablecoins was virtually unchanged at $152 billion.
The dominant issuers broadly trimmed or slowed issuance. An exception was Maker’s DAI, with supply up by $500 million during the month.
DeFi protocols Aave and Curve announced plans to develop their own algorithmic stablecoins. By month-end the Aave community approved the launch of the USD-backed GHO stablecoin. Details on Curve’s similar product remain undisclosed. It is known only that the asset will be backed by a mechanism similar to Tron’s USDD.
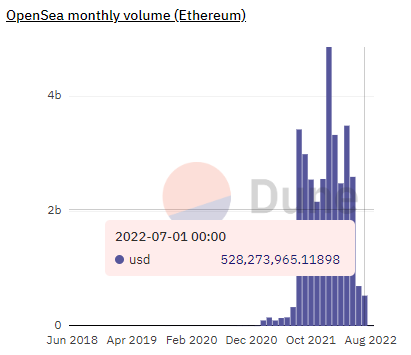
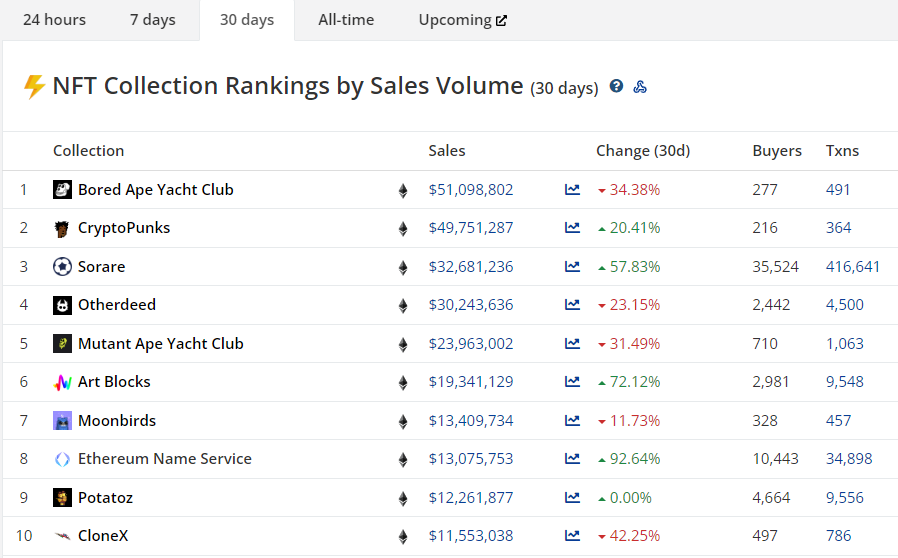
OpenSea, the leading NFT marketplace, continues to post subdued activity in 2022. July volume stood at $528 million.
Despite some positive signs in NFT activity, key metrics remain at record-low levels. Sorare stood out, with more than 400,000 trades on collectible cards worth $32 million.
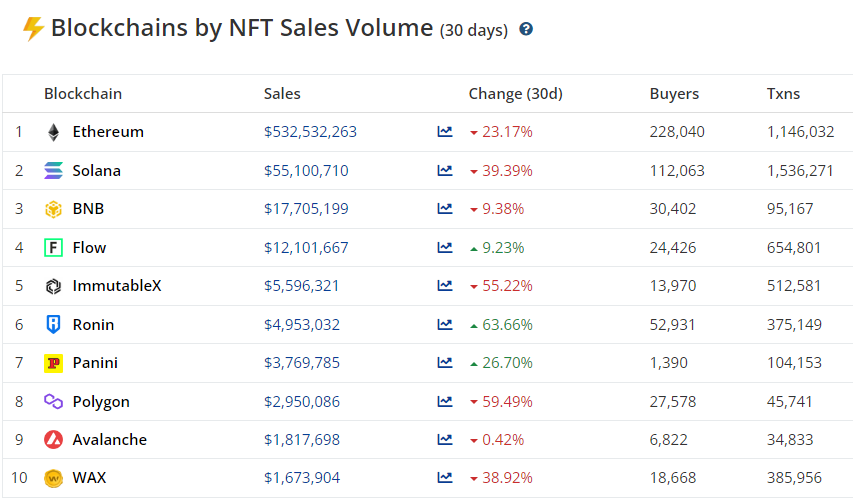
On-chain activity analysis supports the hypothesis of volume — July saw a revived activity on Ronin, a sidechain re-launched after a hack. A modest rise in NFT transactions occurred on Flow and Immutable as the market re-energised.
Activity of Major Players
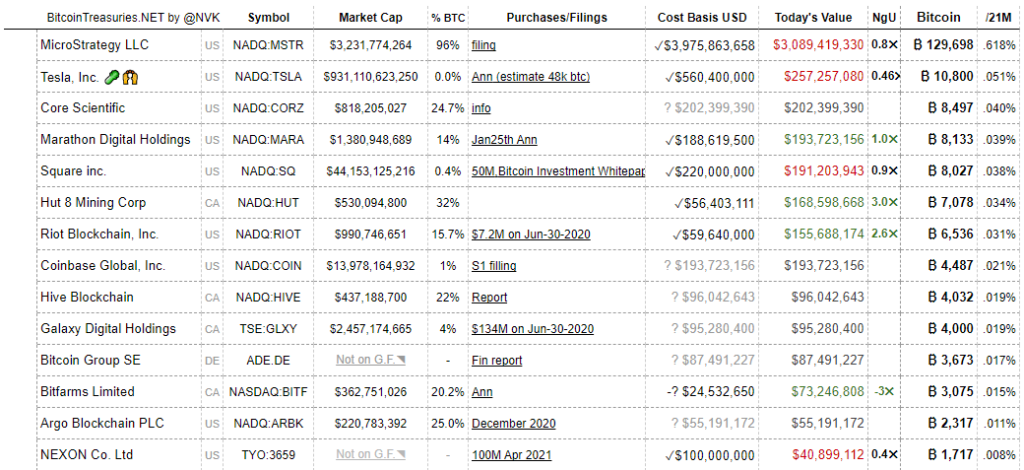
Largest public companies holding Bitcoin as reserves. Data: Bitcoin Treasuries.
In July Tesla announced the sale of 75% of its Bitcoin holdings for cash. The report indicates that profit from crypto asset sales since the start of the year to 30 June amounted to $64 million.
Despite selling most of its digital gold, Tesla remains second in the ranking of public companies with Bitcoin on the balance sheet.
MicroStrategy’s Bitcoin reserves remained unchanged. CEO Michael Saylor in July did not announce new Bitcoin purchases, but criticised Ethereum and predicted its volatility.
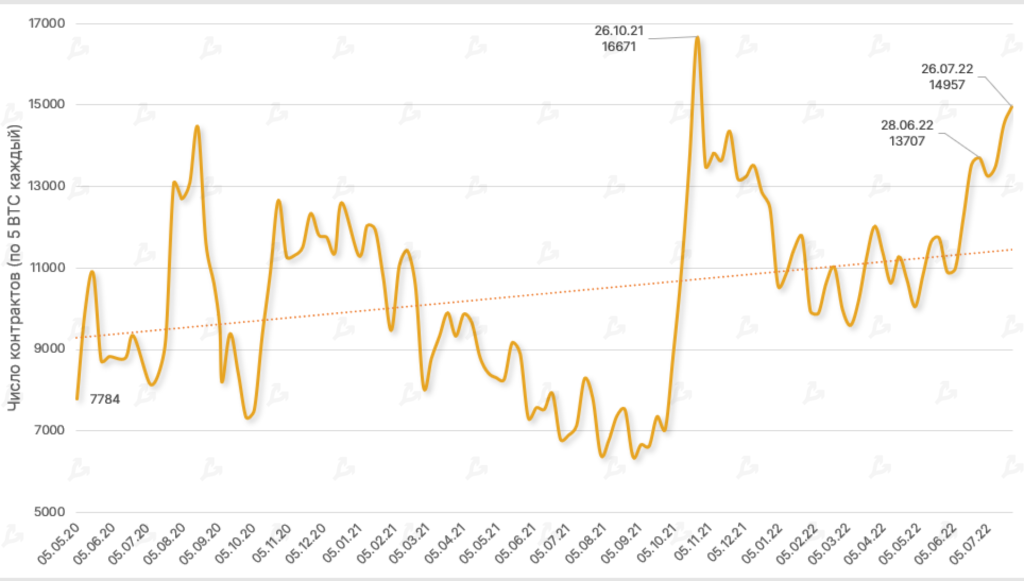
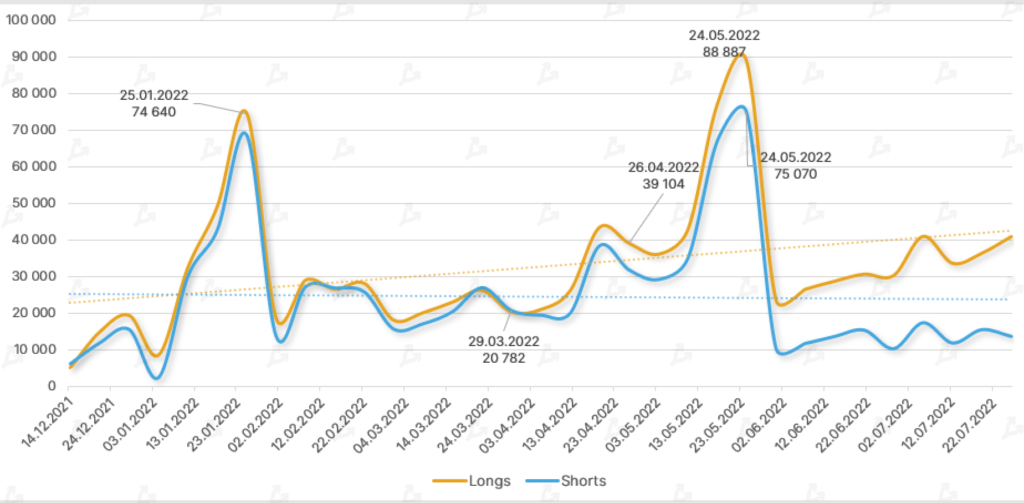
Dynamism of open interest in Bitcoin futures on CME. Data: CFTC.
Dynamics of positions in CME microfutures of major players in the Commercial category. Data: CFTC
Open interest in regulated Bitcoin futures on the CME continued to rise — total contracts for 5 BTC rose by 9.1%.
There were no major shifts in the balance of power in July. Different categories of players held roughly the same levels of longs and shorts.
Among Bitcoin microfutures, the situation was similar. The difference was the dominance of short positions among Commercial players.
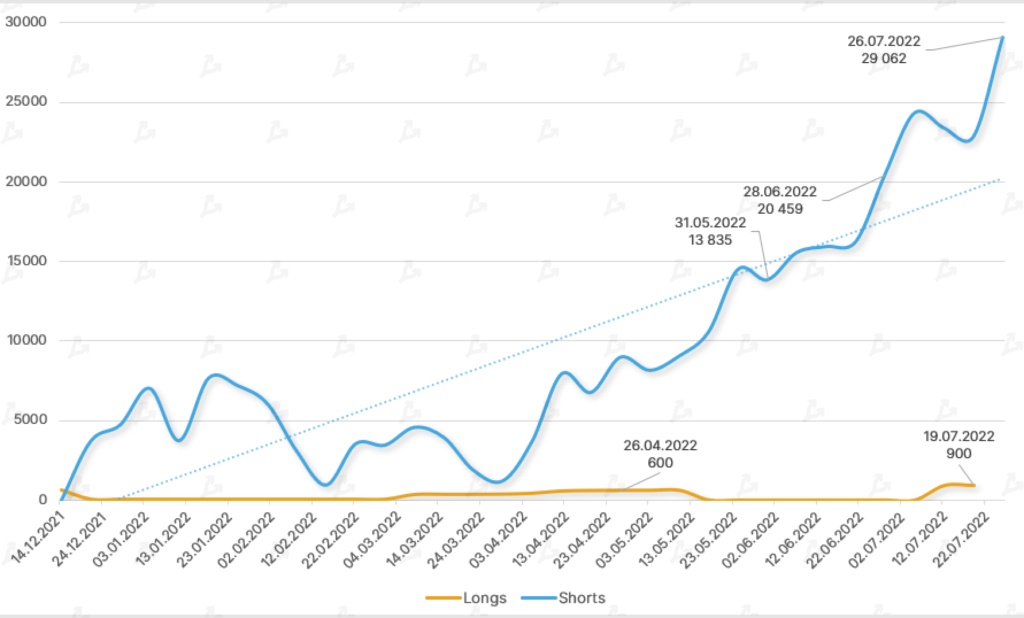
Dynamics of CME futures positions for Ethereum from Non-Commercial players. Data: CFTC
Dynamics of Ethereum major players’ positions in Microfutures, Commercial category. Data: CFTC
In microfutures on Ethereum, Non-Commercial and Nonreportable players hold longs over shorts, signaling optimism about Ethereum’s prospects as the second-largest cryptocurrency.
Conversely, Commercial players are building short positions. The number of short positions among Commercial players increased by about 42% this month.
Major Venture Rounds
$450 mln
venture firm Variant announces two new funds focused on Web3 and the DeFi sector.
$150 mln
The Aptos blockchain platform team Aptos leads Series A financing. Led by FTX Ventures and Jump Crypto.
$100 mln
Dubai-based 5ire in Series A funds. To be used to develop an ecology-friendly blockchain on a Proof-of-Benefit basis.
$100 mln
platform for digital-asset management Safe (formerly Gnosis Safe) in a strategic financing round led by crypto fund 1kx.
$75 mln
blockchain-gaming operator Animoca Brands. Preliminary company valuation reached $5.9 billion.
$65 mln
decentralised domain registrar Unstoppable Domains in a Series A round. Investors valued the project at $1 billion.
Regulation
The head of the SEC said that work on registering digital assets as securities is underway.
Authorities set timelines for passing a crypto-regulation bill.
CFTC will create a new division to oversee cryptocurrencies.
Authorities in Singaporeannounced tighter crypto regulation in the wake of the Terra collapse and several company bankruptcies.
IOSCO, the International Organization of Securities Commissions, will develop regulatory standards for digital assets by the end of 2023.
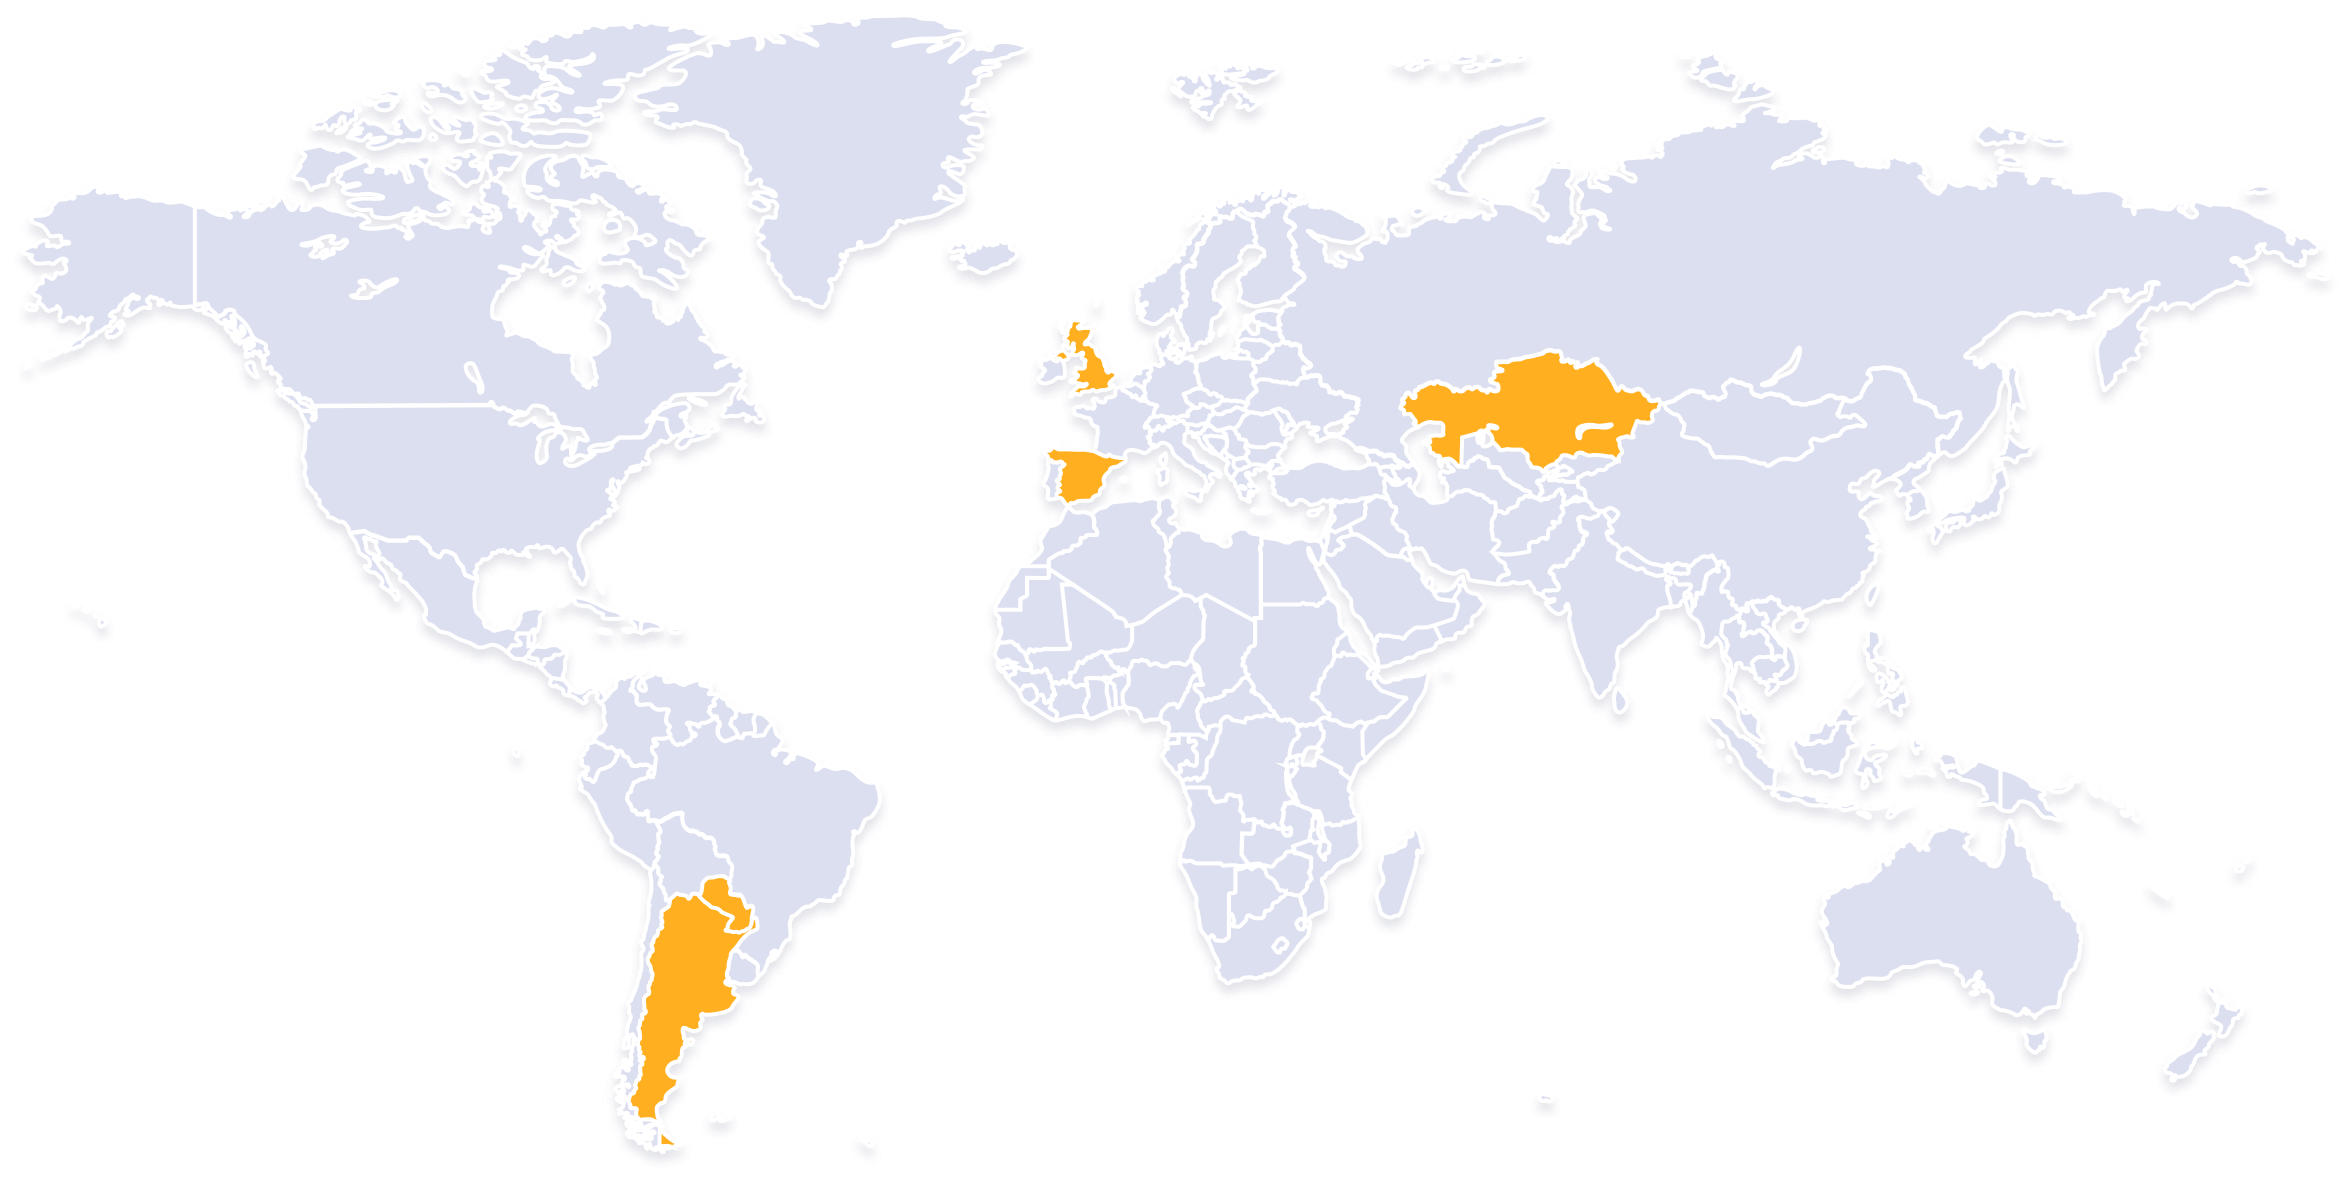
The president of Kazakhstan signed a law on tax rates for miners.
In the EU there were proposals to extend AML standards to NFT platforms, while stablecoins were deemed unsuitable as a payment method.
In Britain there are plans to study tax treatment of crypto lending and staking in DeFi. The authorities included digital assets in the Financial Services Bill.
In G20 there were calls to strengthen oversight of the crypto industry.
Paraguay’s Senate approved a crypto mining and trading bill.
Argentinarestricted dollar sales by Bitcoin traders.
By the end of Q2 2022, Tesla reportedly converted about 75% of its Bitcoin holdings to cash, yielding approximately $936 million, according to the report.
As Elon Musk stated, the sale was driven by a need to boost liquidity during China’s COVID restrictions. The company continues to hold Dogecoin.
On 5 July a bankruptcy petition was filed in New York court for the crypto broker Voyager Digital. Estimated liabilities range from $1 billion to $10 billion with around 100,000 clients.
Three Arrows Capital (3AC) also filed for bankruptcy in July after which Voyager lent 15,250 BTC and $350 million USDC to 3AC. On 14 July Celsius Network and related entities also filed for bankruptcy. By 13 July the firm held assets of $4.3 billion, while its liabilities to customers and creditors stood at $5.5 billion.
In July Ethereum developers approved the Goerli testnet’s transition to the Proof-of-Stake algorithm, which will be the final milestone before full deployment on the Ethereum network. Consequently, the community asked: what about miners? Here are the latest materials for readers: