

A year after Bitcoin’s halving: why is this time different?
It has been more than a year since the fourth halving, yet Bitcoin is still treading water—trading roughly 12% below the ATH set at the time of Donald Trump’s inauguration. Judging by historical patterns, this is the most lacklustre performance of any market cycle.
After previous halvings, the first cryptocurrency typically delivered chunky multiples within 12 months. The 2024–2025 stretch, however, has broken the mould—the market seems stuck in wait-and-see mode.
ForkLog examines why this cycle is different.
Historical patterns versus the current cycle
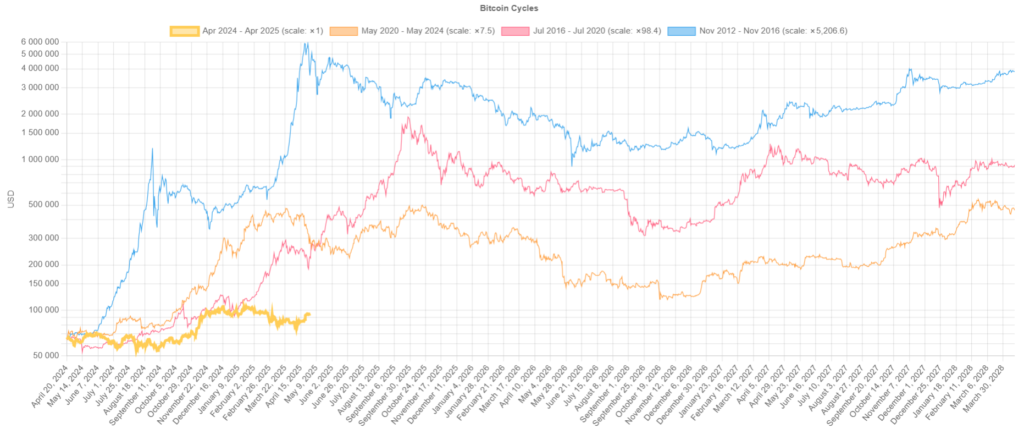
According to researchers at Kaiko, in the 12 months after the 2012 halving Bitcoin’s price soared 7,000%, while the 2016 and 2020 cycles saw gains of 291% and 541%, respectively.
Clearly, this cycle is nowhere close. After the block reward fell from 6.25 BTC to 3.125 BTC, digital gold rose just 46% (calculations as of 29 April).
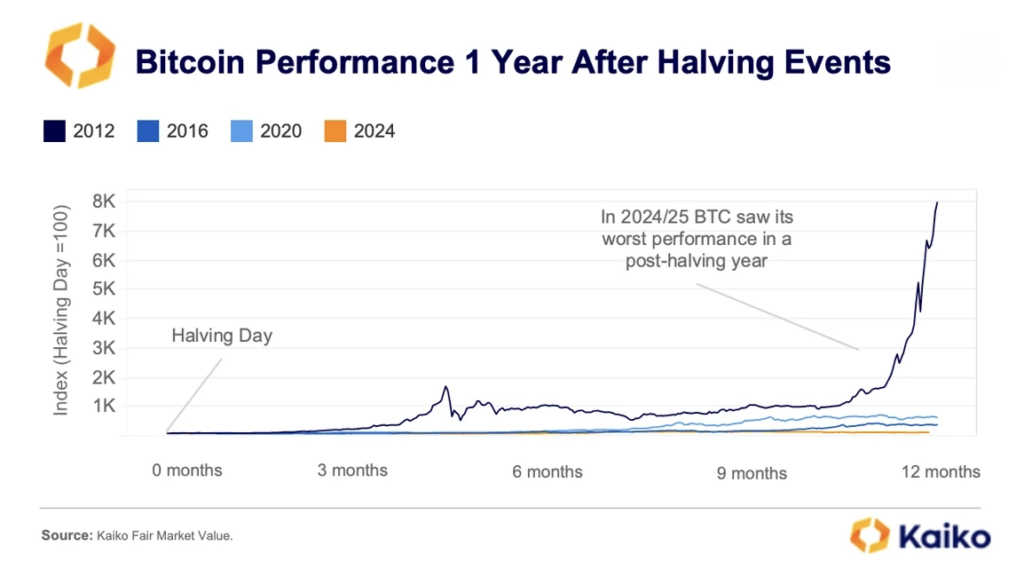
“The characteristic price surge that typically appears nine months after the halving is simply absent this time,” the analysts stated.
Price action remains sluggish amid mounting macroeconomic uncertainty. In the first quarter of 2025, global tensions intensified after the introduction of “liberation” tariffs, damping risk appetite.
In the six months after the fourth halving, the average Economic Policy Uncertainty Index (per FRED) stood at 317. For comparison, in comparable post‑halving windows it was 107 in 2012, 109 in 2016 and 186 in 2020.
The EPU gauges uncertainty in economic policy based on media analysis, tax‑spending forecasts and expert disagreement. High readings correlate with greater equity volatility, weaker investment and stronger “safe‑haven” assets such as gold.
In 2020–2022, rising EPU coincided with capital flowing into Bitcoin, which many view as a hedge against inflation and political risk. Research shows that when the index exceeds 150, interest in digital gold increases.
“However, in the United States, regulatory questions around digital assets are beginning to clear up, which could reduce uncertainty and restore investor confidence in crypto markets over the coming months,” the experts said.
A maturing market
Kaiko notes that Bitcoin’s 60‑day price volatility has fallen markedly—from over 200% in 2012 to barely 50% now.
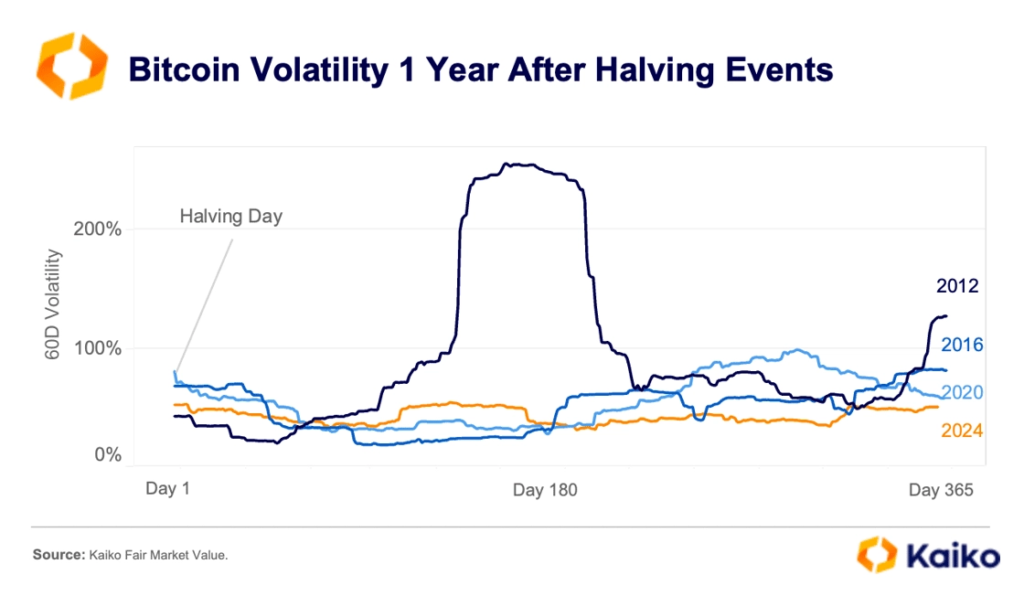
“As Bitcoin matures, it will likely deliver steadier, albeit more moderate, returns than in previous cycles,” the experts opined.
On‑chain analyst Tiago Amaral noted that MVRV, a metric geared towards long‑term investors, points to a sharp decline in unrealised profits. In his view, that signals market maturation and lower prospective returns.
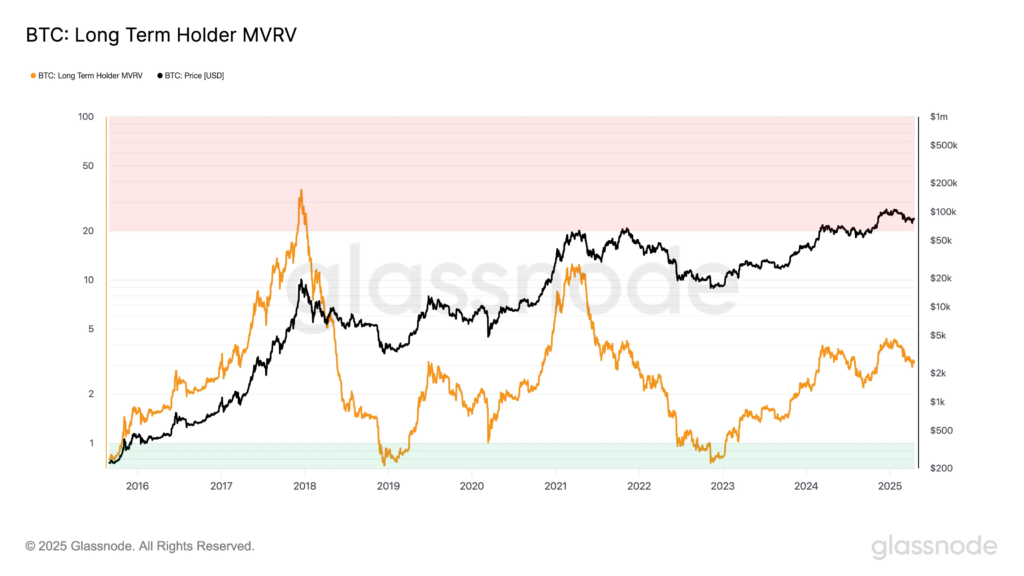
“Bitcoin may be entering a new era—with less pronounced parabolic peaks and more gradual, institution‑driven growth,” Amaral explained.
In the 2016–2020 cycle the indicator peaked at 35.8, signalling sizeable paper gains and a clear market top. In 2020–2024 the maximum fell sharply—to 12.2—despite a new ATH.
In the current cycle, the long‑term‑holder MVRV peaked at just 4.35—well below previous periods. The drop suggests long‑term holders are no longer booking outsized profits.
“The trend is obvious: with every new cycle, the multiples are more modest,” the analyst noted. “Rising market capitalisation means it takes exponentially more capital to move the price materially.”
He also cautioned it is too early to declare a final top for this cycle. Historically, before setting new highs the market often drifted sideways or saw moderate pullbacks.
Given the growing role of institutions, the current accumulation phase may well last longer than in past cycles.
“Although the current stretch feels sluggish and dull, it may in fact be a healthy reset before the next upward impulse,” Amaral suggested.
Cycles and miners
The crypto market’s structure is evolving, and the familiar four‑year cycles appear to be losing relevance.
Mitchell Askew of Bitcoin Magazine Pro and Blockware Solutions believes that with institutional capital, Bitcoin’s “parabolic growth model” followed by deep drawdowns is changing. Meanwhile, mining is becoming more efficient and stable, affecting supply and pricing trends.
Halvings used to coincide with rapid rallies, often followed by 70%‑plus corrections. That driver now looks less potent; instead, more institutions are involved. They make the market steadier but more sensitive to macroeconomics.
According to Askew, spot ETFs and corporate investments help stabilise demand for Bitcoin, reducing the odds of sharp swings. Unlike retail traders—who tend to buy in euphoria and panic‑sell on dips—institutions are likelier to take profits into strength and accumulate during declines.
Like others, Askew also sees longer consolidation phases before advances resume. In his view, Bitcoin increasingly behaves like a traditional financial asset, shedding the hallmarks of a highly volatile speculative instrument.
He added that mining‑hardware efficiency has plateaued, which could materially affect production and supply. New ASIC models are only about 10% more efficient than their predecessors, leaving them profitable for four to eight years.
“This reduces the pressure on miners to constantly invest in new equipment,” the expert observed.
Reward cuts are not the only factor shaping mining profitability.
“Although miners’ revenues remain roughly in line with the five‑year average, mining difficulty is now five times higher than in April 2021 and 40% above pre‑halving levels,” noted Blockworks journalists.
In short, mining is tougher and costlier than ever. But what is the cost to produce one bitcoin? There is no single answer, as the key variable—electricity—varies by region.
Researchers at the CCAF estimate the average cost of mining 1 BTC at $49 887 (as of 30 April).
A correction of over 40%—from around $94,000 to the breakeven ~$50,000—looks unlikely. That, in turn, makes a near‑term miner capitulation improbable.
The dust from the “liberation” tariffs has settled, and most on‑chain metrics are nowhere near overheating. The market remains relatively stable, but one question keeps surfacing: “When does the rally resume?”
Should we expect a moonshot this year?
In March, CryptoQuant head Ki Young Ju concluded the bull trend had ended—predicting a correction or prolonged range over the next 6–12 months.
After a rise to $94,000, he conceded the price was 10% above the level at which he had called the bull trend over.
Ki Young Ju added he would watch the data for a few more weeks for signs of a reversal. Until the price clears $100,000, his view is unchanged: it is too early to declare the uptrend back.
Some on‑chain analysts are more upbeat. A CryptoQuant author known as IT Tech noted that after several weeks of persistently negative readings, the Apparent Demand indicator has turned higher, signalling a clear recovery in demand.
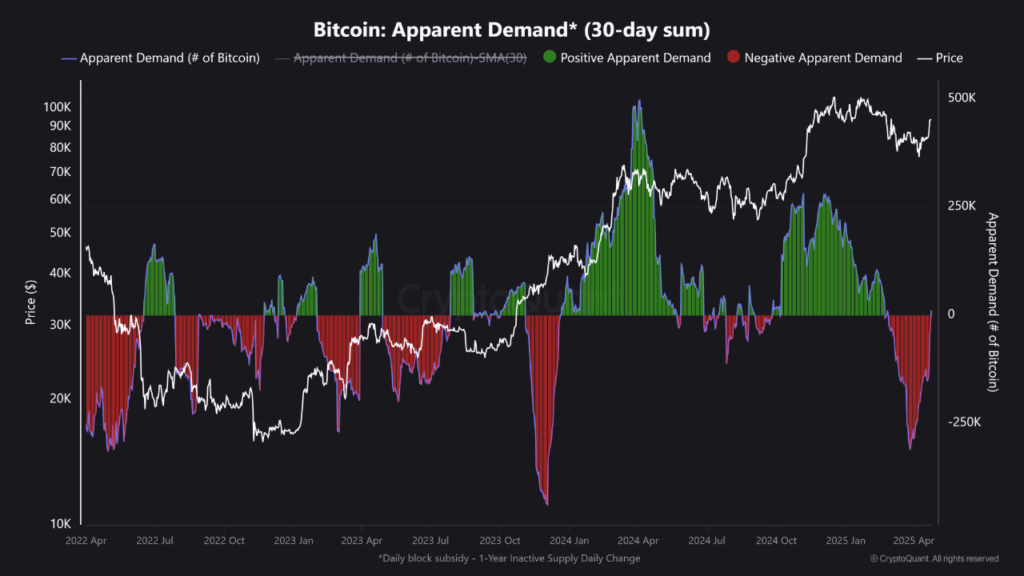
The metric reflects the net change in the volume of coins unmoved for a year, adjusted for daily block rewards. It serves as a proxy for demand strength.
“A vigorous rebound from extremely negative readings (below -200,000 BTC) indicates previously idle capital is re‑entering the market,” the expert explained.
By his account, this is the first significant move since February and comes alongside stronger inflows to spot Bitcoin ETFs and continued long‑term accumulation.
“Historically, such Apparent Demand reversals preceded either large‑scale rallies or the formation of durable support levels,” IT Tech said.
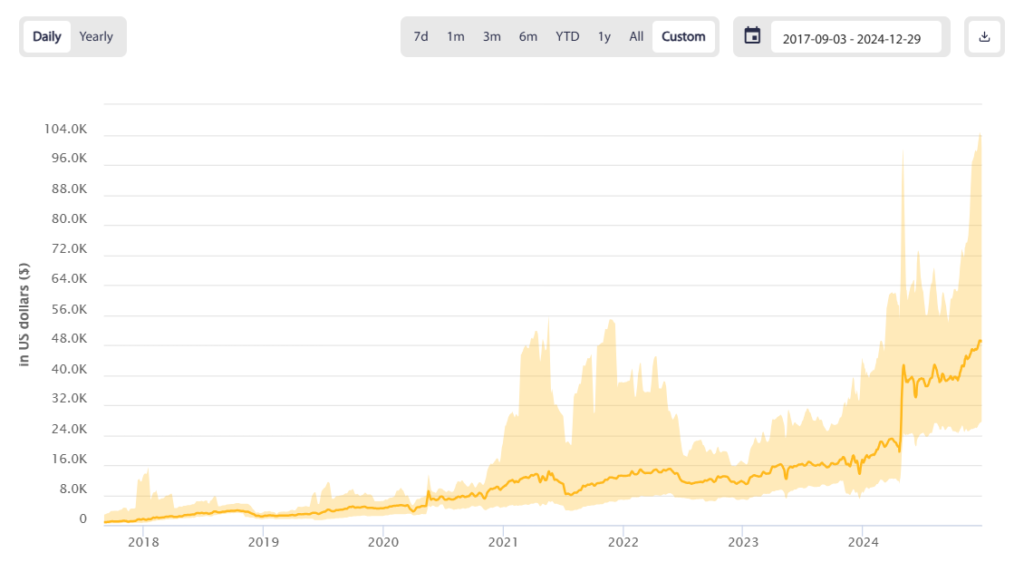
Capriole Investments founder Charles Edwards, using the Bitcoin Energy Value (BEV) model, concluded that Bitcoin trades at a 40% discount to its fair value—$130,000.
Bitcoin Energy Value is at $130K. We are one year post Halving and Bitcoin is trading at a whopping 40% discount to its intrinsic value. pic.twitter.com/kbqTgTPp5d
— Charles Edwards (@caprioleio) April 25, 2025
BEV estimates digital gold’s “fair price” based on the energy expended to mine it. The metric is calculated as follows:
V = E*C/S
where:
- E — miners’ energy consumption (in joules or TWh/year);
- C — a fiat constant (converts energy to US dollars);
- S — the growth rate of Bitcoin’s supply (accounts for halvings).
The analyst known as Crypto Caesar is confident that clearing the psychological $100,000 mark would open the way to new record highs in the $110,000–115,000 range.
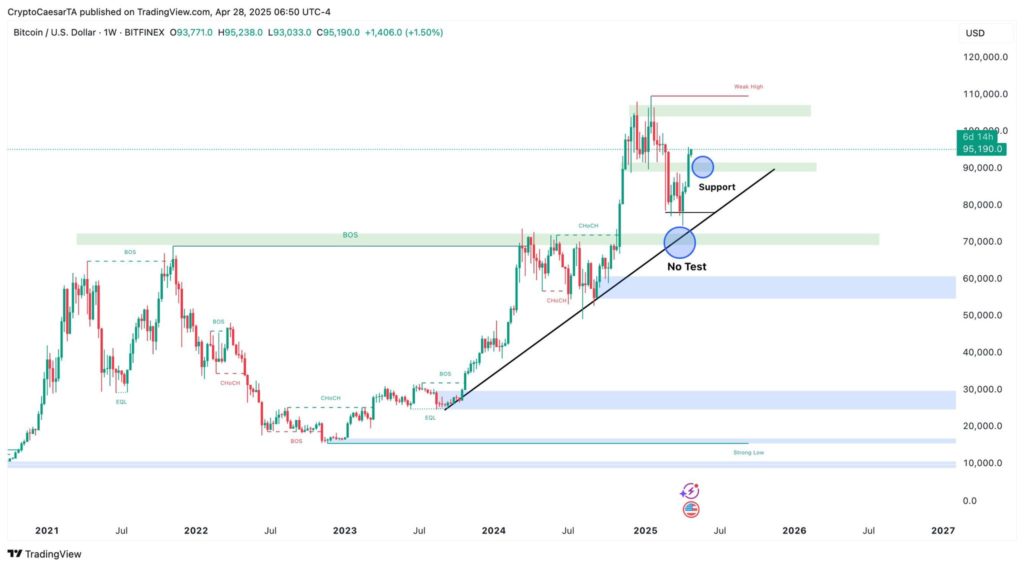
In his view, support at $89,000–90,000 is attractive for active buying and should limit potential drawdowns.
The lower $70,000–72,000 area remains “untapped”. It coincides with a diagonal support line that could prove pivotal if the correction deepens.
A rising share of bitcoins acquired at lower prices points to an approach towards a “historic level of euphoria”, according to a CryptoQuant analyst known as Darkfost.
By his account, that metric is again above 85%, which is “quite positive”. During the previous correction it fell to nearly 75%.
Darkfost’s colleague Carmelo Aleman added that Bitcoin’s realised capitalisation has once again hit a record.
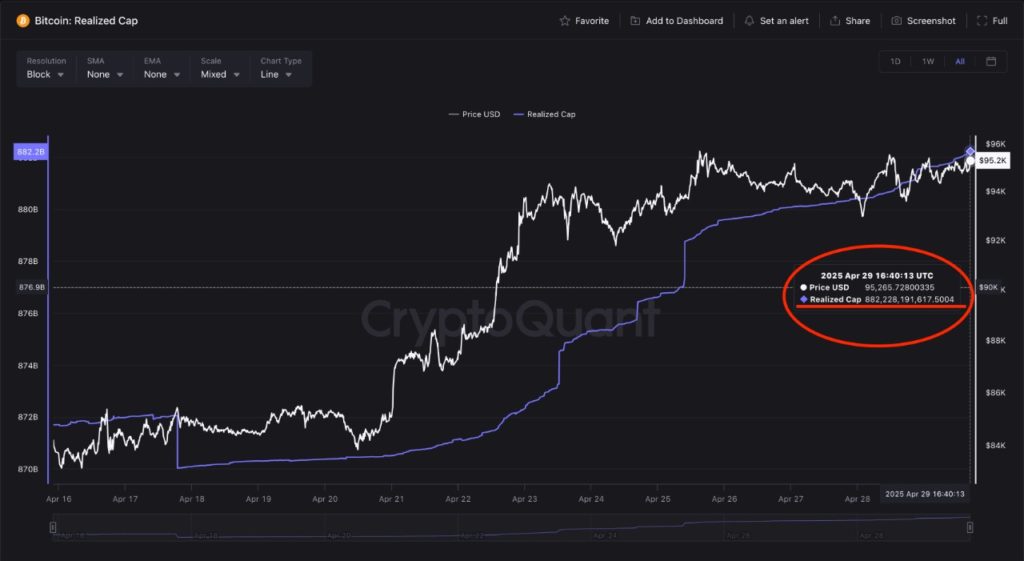
The researcher sees this as a bullish signal and evidence of “confidence in the asset” among whales and retail investors who “are betting on strong growth in the near term”.
The metric is the total value of all bitcoins in circulation, calculated using the last on‑chain transfer price of each coin.
Some analysts are even more optimistic. Peter Chang of Presto Research forecasts Bitcoin at $210,000 by the end of 2025.
He argues that growing institutional interest and rising global liquidity will drive the move. He also deems recent pullbacks a “healthy shakeout” that laid a firmer foundation for the next uptrend.
Standard Chartered’s Geoffrey Kendrick is more measured: he expects Bitcoin at $120,000 in the fourth quarter. By end‑2025, he reckons, the price could reach $200,000, helped by capital rotating out of US assets into the first cryptocurrency.
Bernstein’s analysts project that by end‑2025 Bitcoin will peak for this cycle around $200,000. Despite inevitable bear phases, they see $500,000 by 2030 and $1m by the end of 2033.
Takeaways
A year on from the fourth halving, Bitcoin is unusually subdued: +46% instead of the hundreds or thousands of per cent of past cycles.
Analysts attribute the slower pace to high macro uncertainty and the asset’s maturation. It now resembles a traditional financial instrument—underlined by a rising correlation with gold amid turbulence. Bitcoin is shedding speculative traits: volatility is trending down, as are holders’ paper gains.
The growing sway of ETFs and institutional whales that “buy the dip” makes the market steadier. Analysts therefore expect a more gradual advance, steered by macro trends and regulatory clarity.
Many believe the bull phase is far from over, with fresh highs possible this year. But unlike past cycles, a longer consolidation may precede the next leg up.
Рассылки ForkLog: держите руку на пульсе биткоин-индустрии!