Key takeaways
- Leading cryptocurrencies closed the worst quarter since 2011. Bitcoin fell below $20,000.
- Trading volume on centralized exchanges dropped to December 2020 levels.
- Some on-chain indicators are signaling a buying opportunity for Bitcoin.
- Bitcoin and Ethereum miner revenues fell by 26% and 52%, respectively.
- Stablecoin issuers reduced issuance. An exception was Circle’s USDC.
- The NFT segment shows signs of a bursting bubble.
- “Fear and Greed Index” fell to August 2019 levels.
- Total value locked in the DeFi segment fell by 36%.
- Avalanche ecosystem rose to third place by TVL.
Performance of leading assets


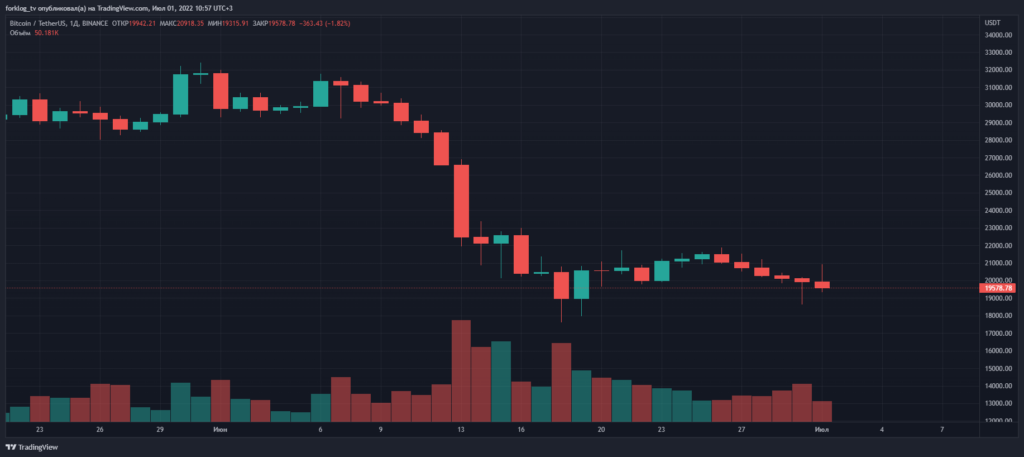
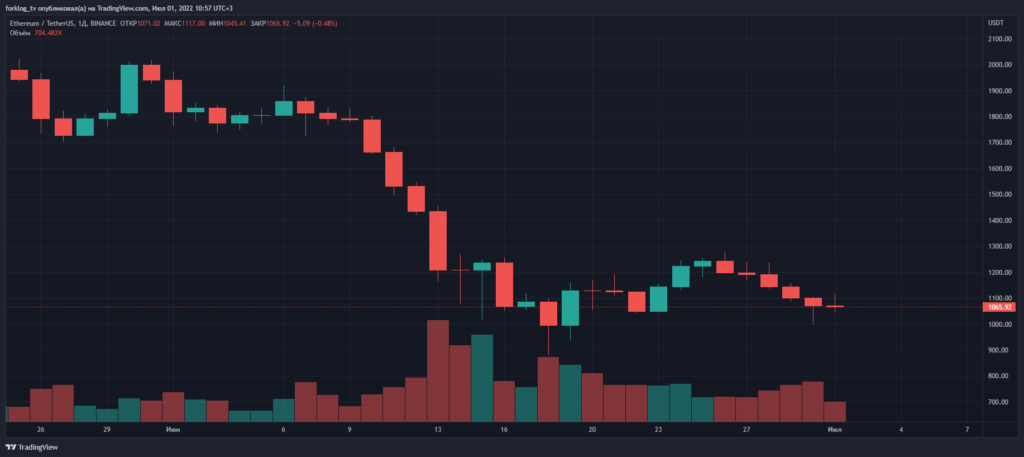
- June 2022 and the second quarter overall were marked by the largest correction since 2011. Bitcoin started the month near $32,000, hit a low of $17,622 (June 18 on Binance), and closed the month below $20,000.
- The flagship asset pulled the entire crypto market down — at one point total market capitalization dipped below $800 billion.
- Ethereum breached the key psychological support level of $1,000. On June 18 the price reached $881.


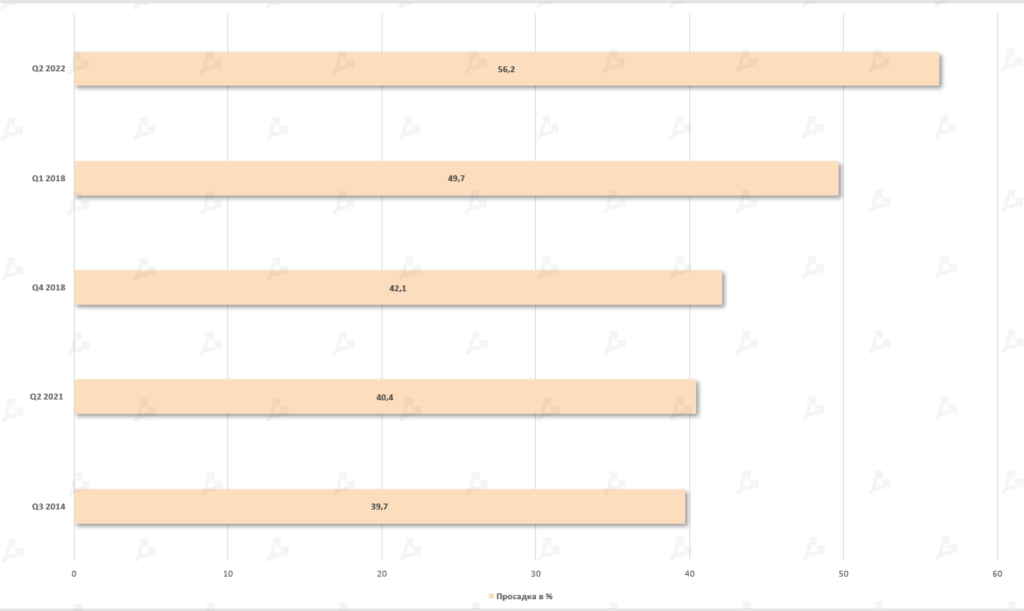


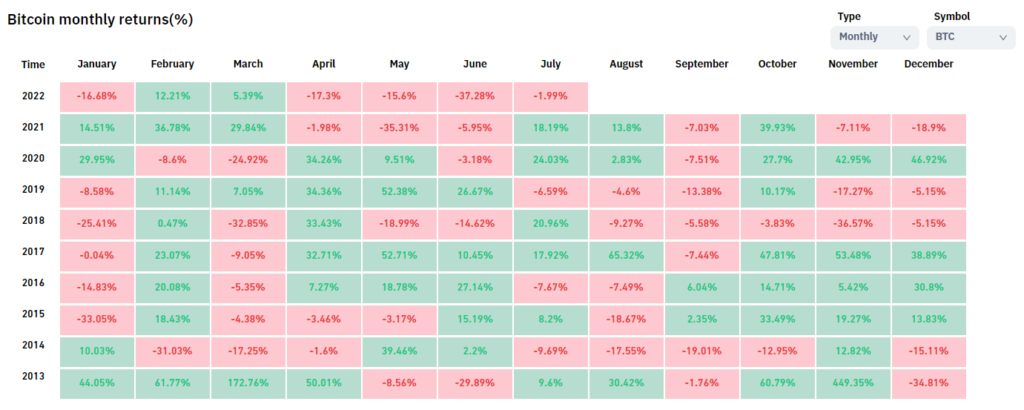
- Bitcoin fell 37.3% for the month. For the quarter (April–June) it was down 56%.
- Ethereum’s price in June dropped 44.8%, and for the quarter it fell 67.3%.


Narrative: The negative momentum caused by the Terra and UST collapse was exacerbated by problems at major players — Celsius, BlockFi and Three Arrows Capital (3AC). As Bitcoin price fell, these entities faced liquidity crises and appeared close to bankruptcy. Citing “extreme market conditions,” Celsius halted user withdrawals. The sticking point was large DeFi collateral loans and an inability to repay obligations.
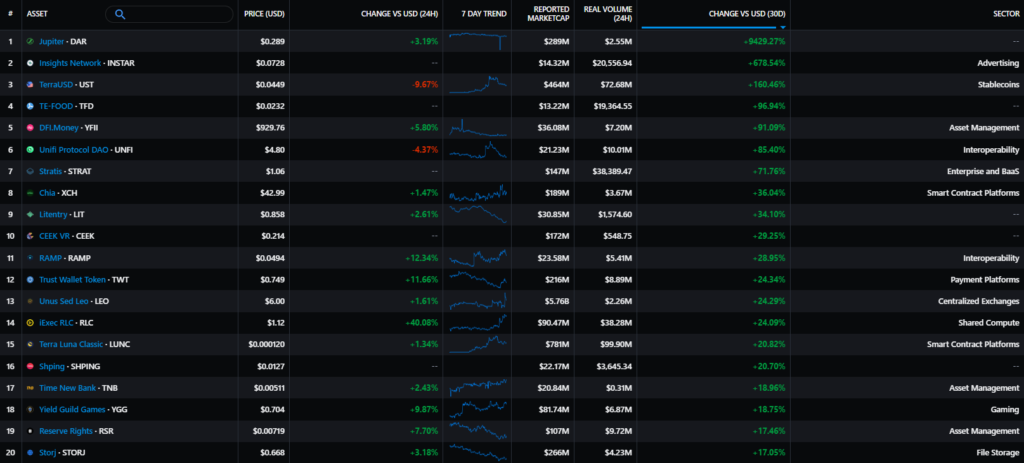
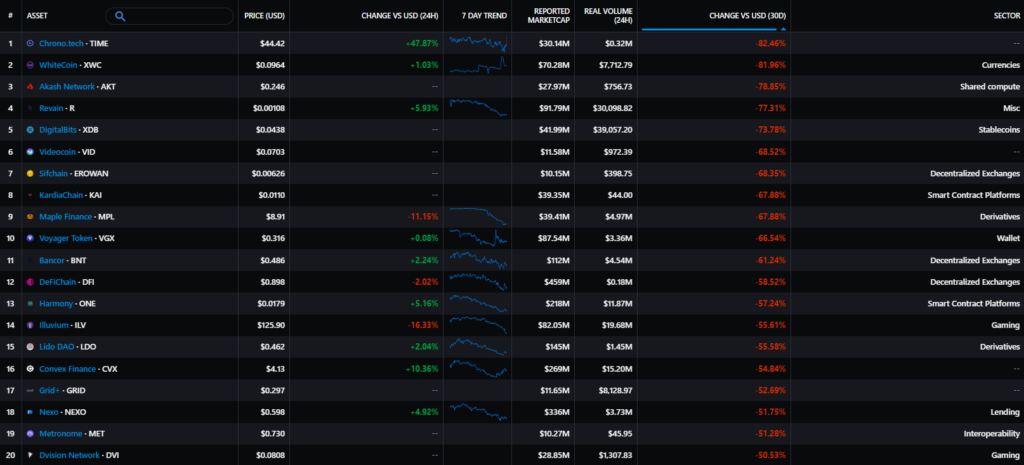
- Among mid-cap assets, Terra Classic (LUNC) and TerraClassicUSD (USTC), Stratis (STRAT), Chia (XCH), Trust Wallet Token (TWT) and Unus Sed Leo (LEO) from Bitfinex posted positive moves.
- The worst performers included Voyager (VGX), which lent the 3AC fund $655 million in BTC and USDC, and hacker-touched Harmony (ONE) and Convex Finance (CVX). The Lido protocol’s token LDO also declined, after the issuer lost its ETH peg on stETH.
Crypto-related company stocks
Voyager Digital (VYGVF):
-83.8%
Stock performance of mining companies
Canaan (CAN):
-14%
Ebang International (EBON):
-50%
Riot Blockchain (RIOT):
-42%
Hut 8 (HUT):
-48%
Marathon Digital (MARA):
-48%
JPMorgan heads note that liquidity-strapped mining companies could continue to exert downward pressure on Bitcoin in the third quarter if mining profitability does not improve. Public miners today account for about 20% of the network’s hash rate.
Bloomberg reported that some mining companies faced difficulties servicing loans backed by Bitcoin-mining equipment. The situation stems from weaker market conditions and the devaluation of ASIC devices. Loans worth about $4 billion were at risk of default.
Macro backdrop


- Following June’s meeting, the Fed raised the policy rate by 75 basis points to 1.5%–1.75%. Fed Chair Jerome Powell warned that July could see a move of 50–75 basis points. Futures assess the probability of the first scenario at 16.8%, and the second at 83.2%.
- The central bank is ready to fight high inflation by sharply cooling the economy. June macro data contained warning signals, but did not decisively point to a recession. That prospect could justify further Fed tightening in July and leave open the possibility of a 50bp rate hike in September.
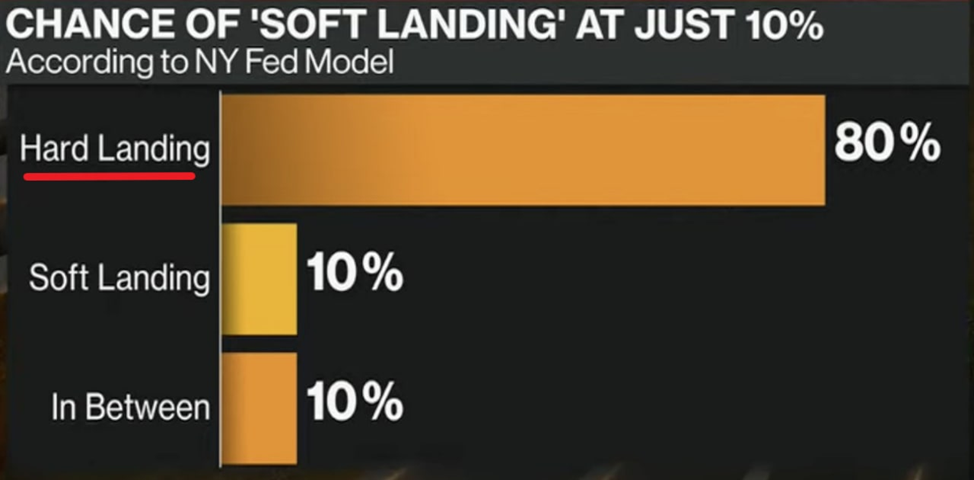
- The scenario of a transition to negative GDP growth is increasingly plausible. The New York Fed model raised the probability of a ‘hard landing’ to 80%. In Europe, economists foresee a recession by year-end.


- Historically, bear markets in US equities have coincided with economic downturns. A rebound could be aided by the Fed pivoting to a looser policy. However futures allow such a scenario no earlier than July 2023.
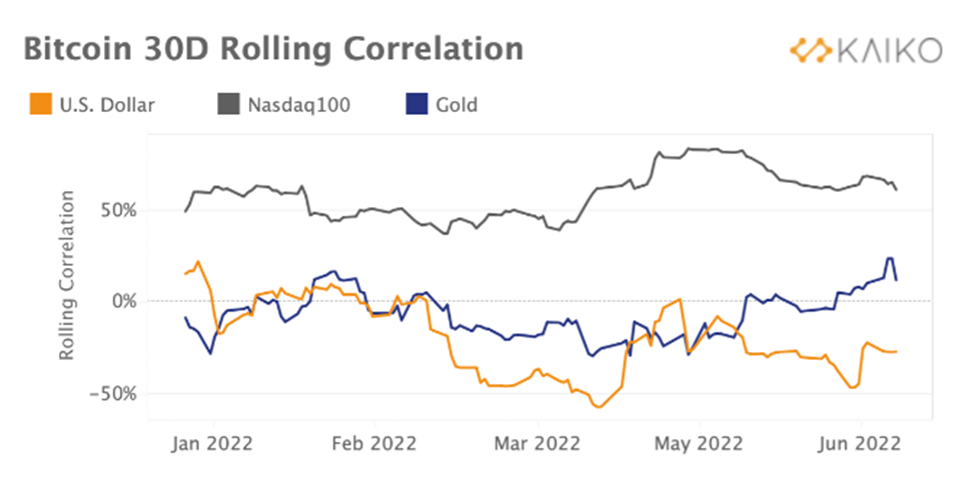
- Bitcoin’s positive correlation with Nasdaq-100 and negative correlation with the dollar have receded from extremes but still point to a close price interdependence of assets. By the end of Q2, the tech index had fallen by more than 20%, leaving room for a technical rebound. It could coincide with the start of a new quarterly earnings season.
Market mood, correlations and volatility


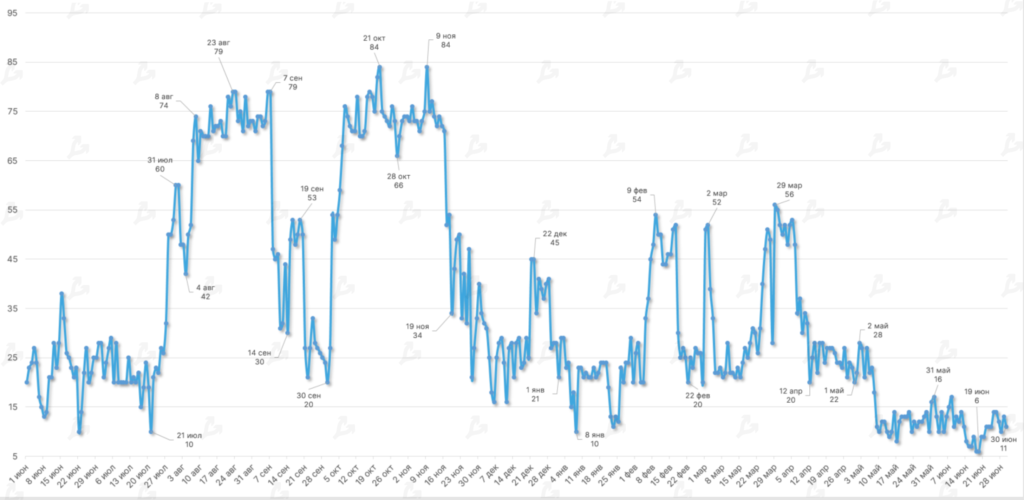


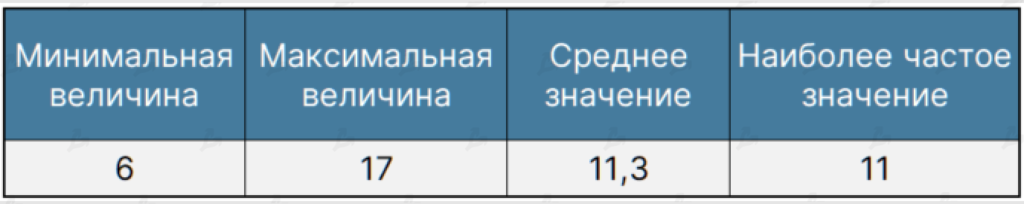
- During the month, the Fear & Greed Index remained at extremely low levels. On June 18, the indicator dropped to 6 — the first time since August 2019.
- Investor sentiment continues to be influenced by negative news and rumors about various crypto-industry participants. Some experts, for example Changpeng Zhao and Mike Novogratz, noted that bankrupting weak players and selling off collapsed assets would take time.


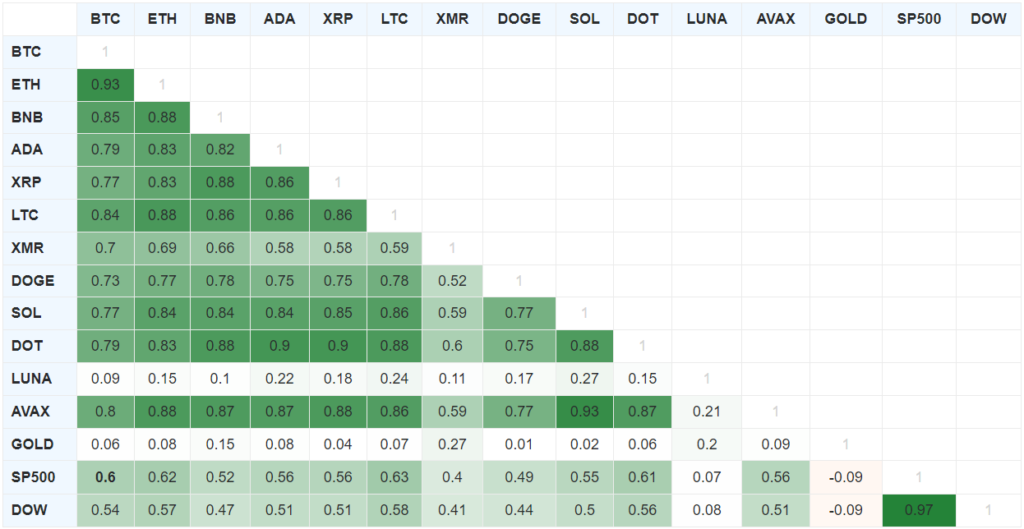
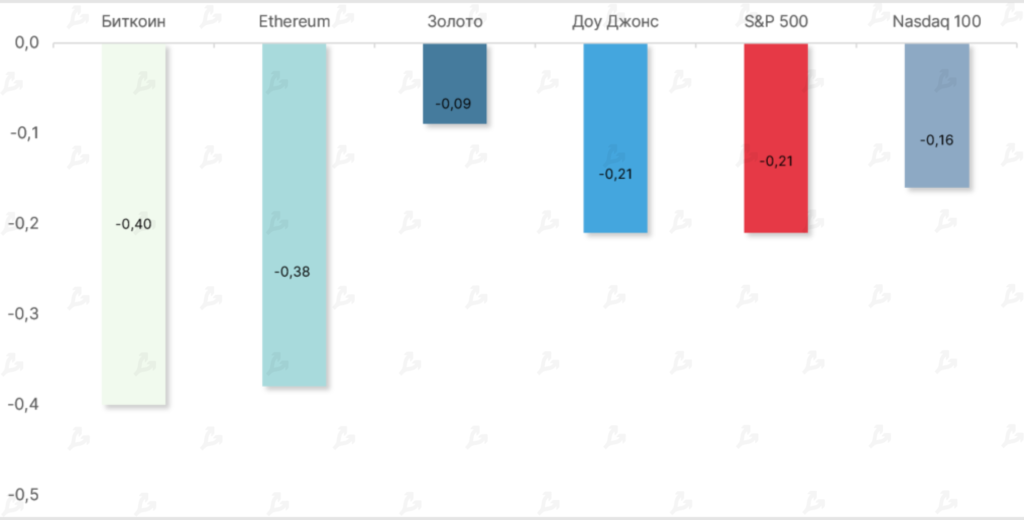
- In June, Bitcoin’s correlation with the US equity market firmed. The smoothed 90-day moving average for the S&P 500 was 0.6 and 0.54 for the Dow Jones.
- The positive correlation with gold remains, but the relationship is weak (0.06).
- By month-end, correlations among the two biggest digital assets had strengthened, signaling a strong market trend.
Market sentiment, correlations and volatility
- Throughout the month, the Fear & Greed Index stayed at unusually low levels. On June 18, the indicator dropped to 6 — the first time since August 2019.
- Investor sentiment remains influenced by negative news and rumours about various players in the crypto industry. Some experts, for example Changpeng Zhao and Mike Novogratz, noted that bankruptcy of weak players and liquidation of collapsed assets would take time.
- In June, Bitcoin’s correlation with the US stock market strengthened. The smoothed 90-day moving average for the S&P 500 stood at 0.6 and 0.54 for the Dow Jones.
- The statistical relation between Bitcoin and gold shifted to positive, but remained weak (0.06).
- By month-end, the correlation between the two largest digital assets strengthened, indicating a strong market trend.
On-chain data


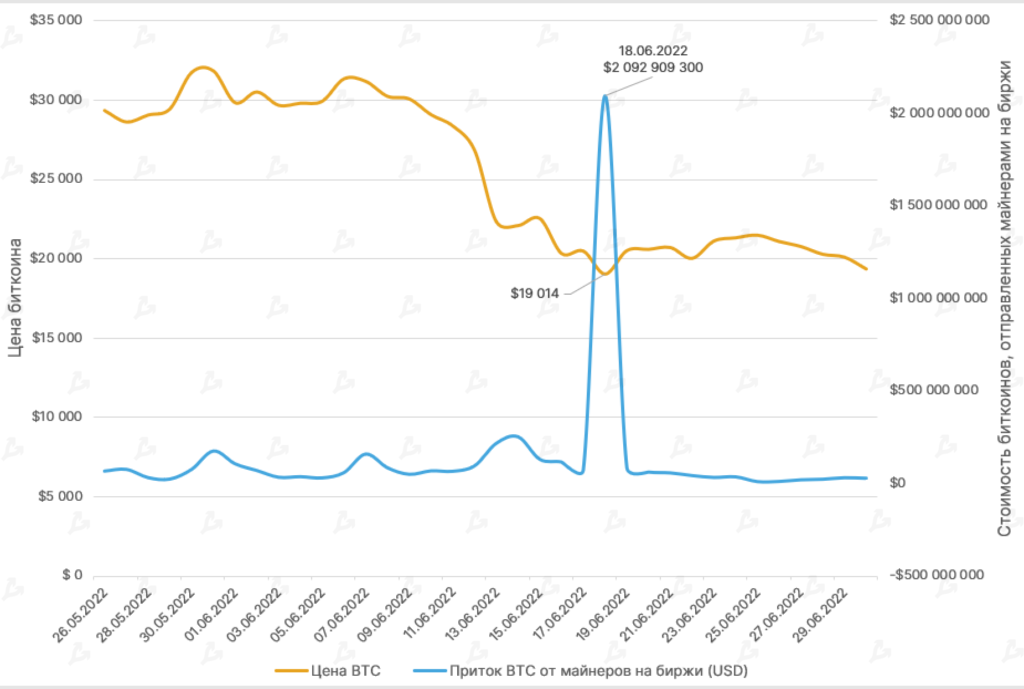


- Against the backdrop of a Bitcoin price drop, a significant inflow of cryptocurrency to centralized exchanges was registered. On June 18, miners sent to exchange addresses BTC worth more than $2 billion.
- Such dynamics indicate mass selling on the eve of and during the collapse, driven largely by lower mining profitability.
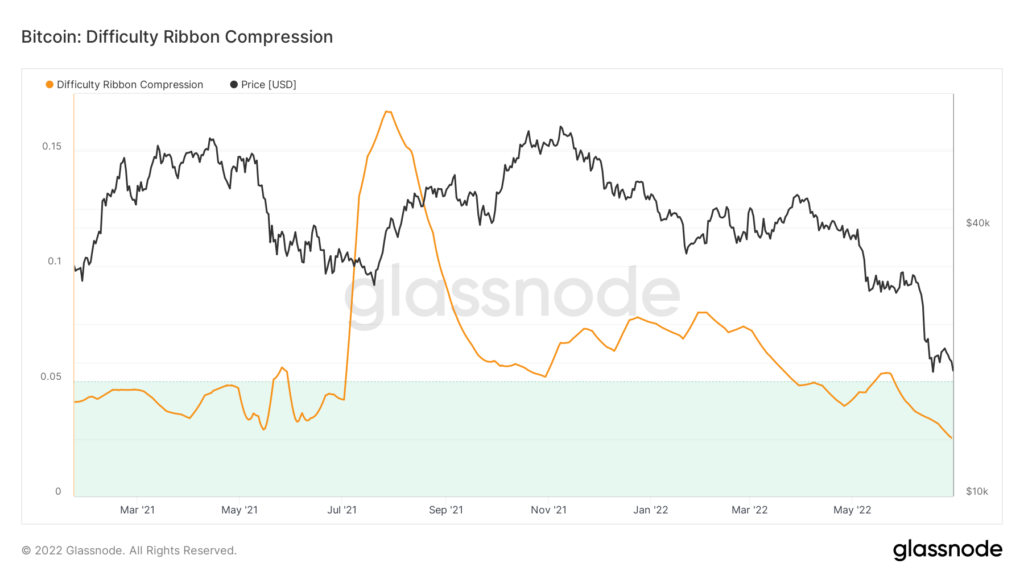
- The Difficulty Ribbon Compression indicator, based on the “Ribbon”, has signalled the onset of a favorable period to buy Bitcoin since late March. The “green zone” indicates compression of the Ribbon and implies a capitulation of some miners.


- In June the average 30-day on-chain volatility, the 30-day moving average of the Bitcoin price, stood at about 3.46%. This roughly matches the April level (3.58%).
- The 30-day average Sharpe ratio (excluding risk-free rate) for Bitcoin indicates that, when risk-adjusted, Bitcoin was among the worst-performing assets in June.
- For all instruments shown, the Sharpe ratio turned negative, signalling a global recession.
Ethereum


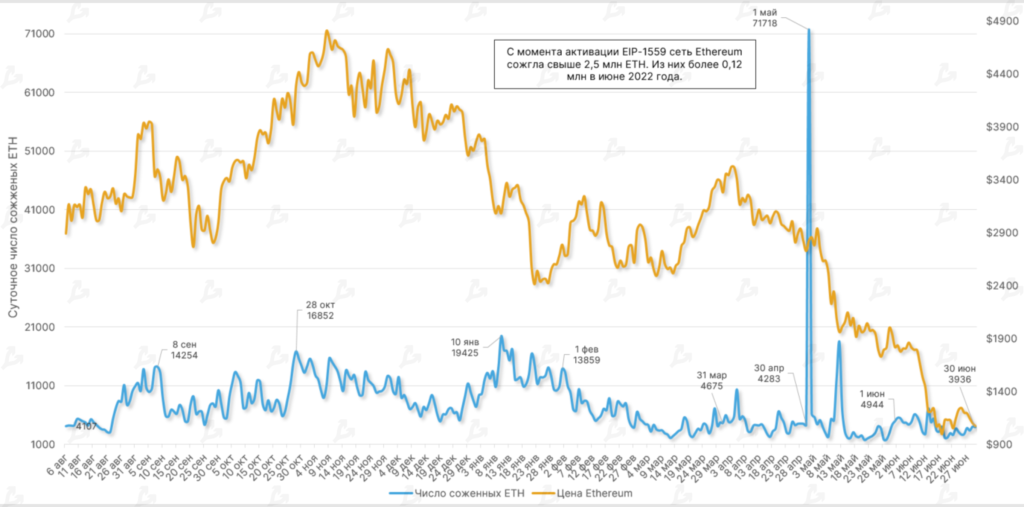


- Since the activation of EIP-1559 in August 2021, the network has burned more than 2.5 million ETH. Of these, over 120,000 were burned in June 2022.
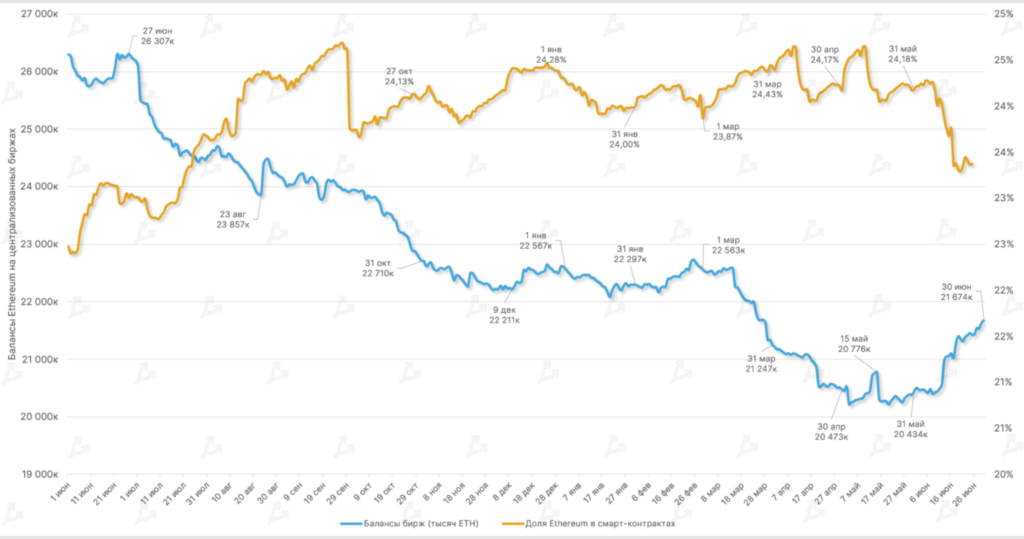
- Throughout the month, there was a net inflow of ETH to wallets on centralized exchanges, driven by macroeconomic crisis and the depegging of stETH from the original ETH.
- The share of ETH locked in smart contracts in DeFi slightly declined. At month-end, the figure was around 23%.


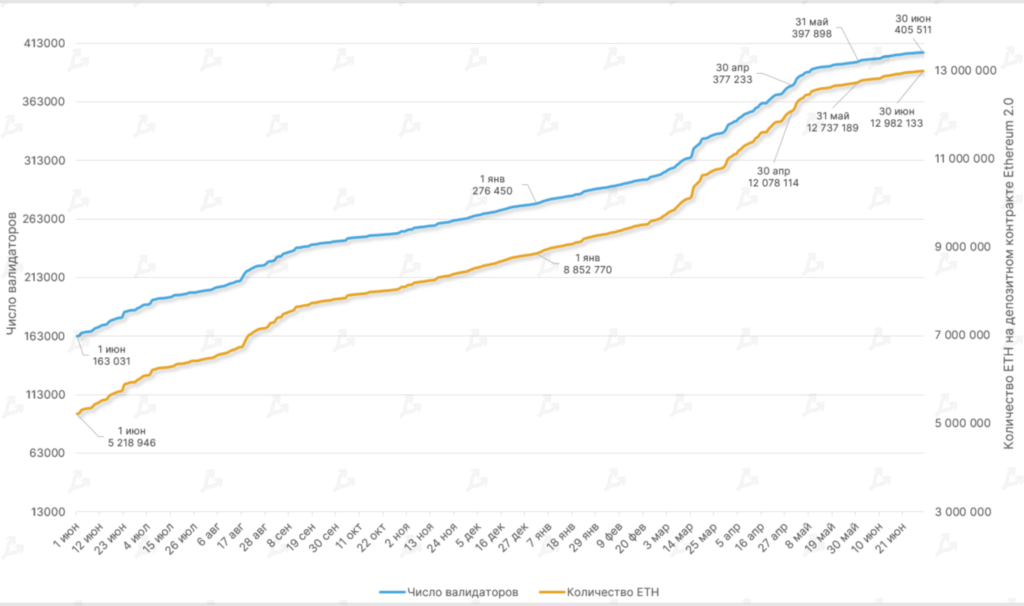


- At the end of June, the number of ETH on the Ethereum 2.0 deposit contract surpassed 12.98 million. The month saw a 1.9% increase; May had risen 5.4%.
- The number of validators on the Beacon Chain exceeded 405,000. In the month, the count of participants interacting with the second Ethereum iteration rose by 1.9%.
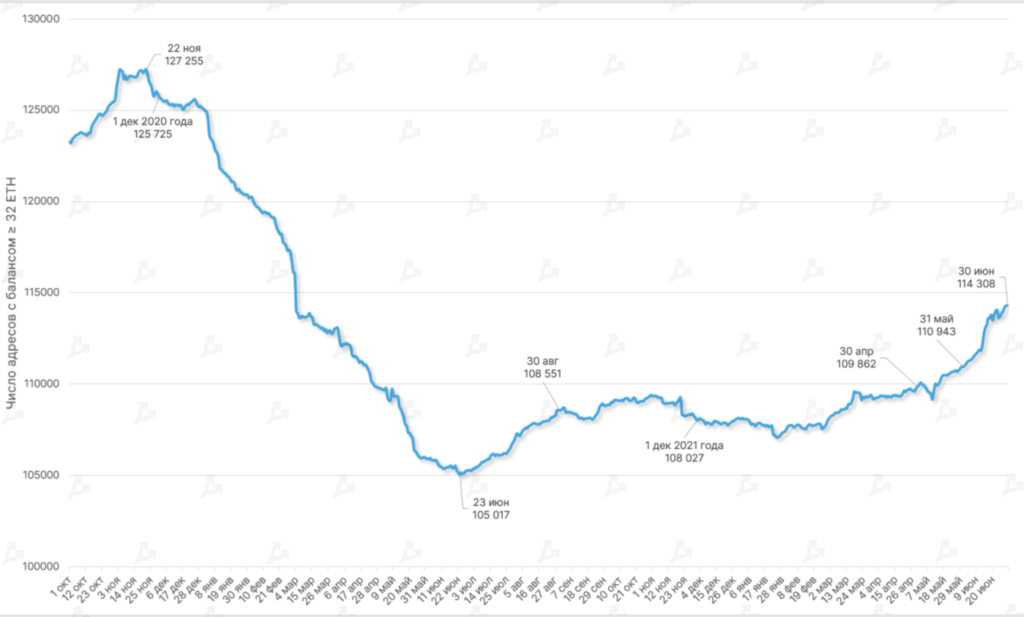
- The number of addresses holding ≥ 32 ETH grew through the month. By June 30 the figure reached 114,308.
Lightning Network
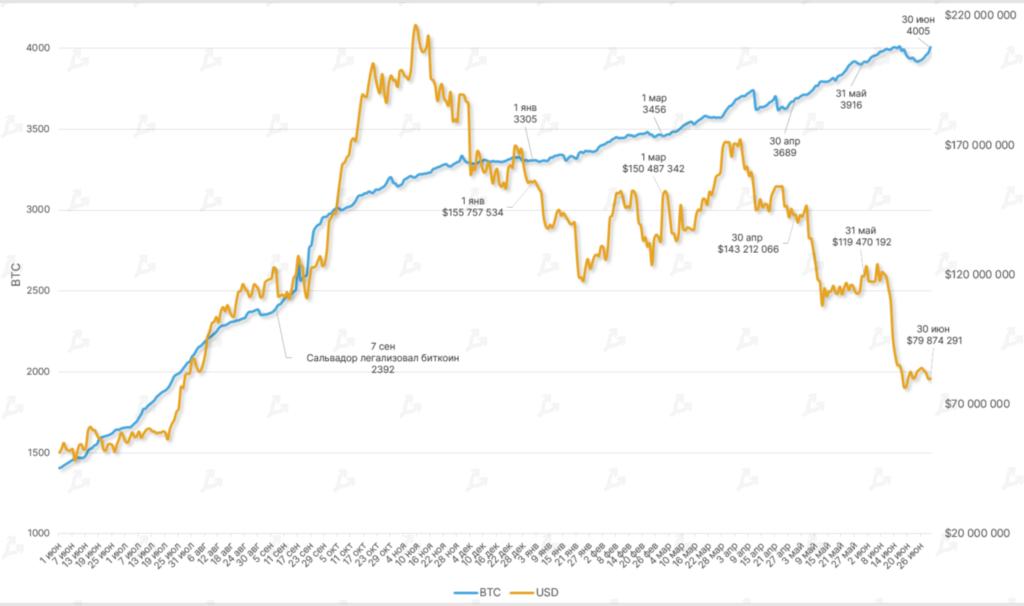


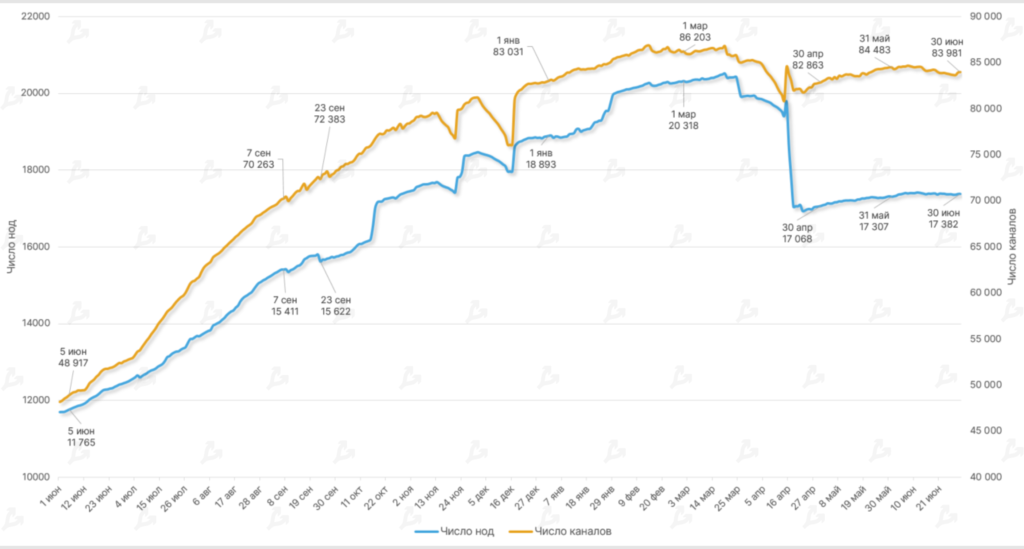
- In June the capacity of Bitcoin’s micropayment network Lightning Network (LN) continued to grow — by month-end it reached 4005 BTC (39316 BTC at end-May).
- The number of LN nodes and channels barely changed in June: 0.4% rise in the first metric and a 0.6% drop in the second.
Mining, hash rate, commissions


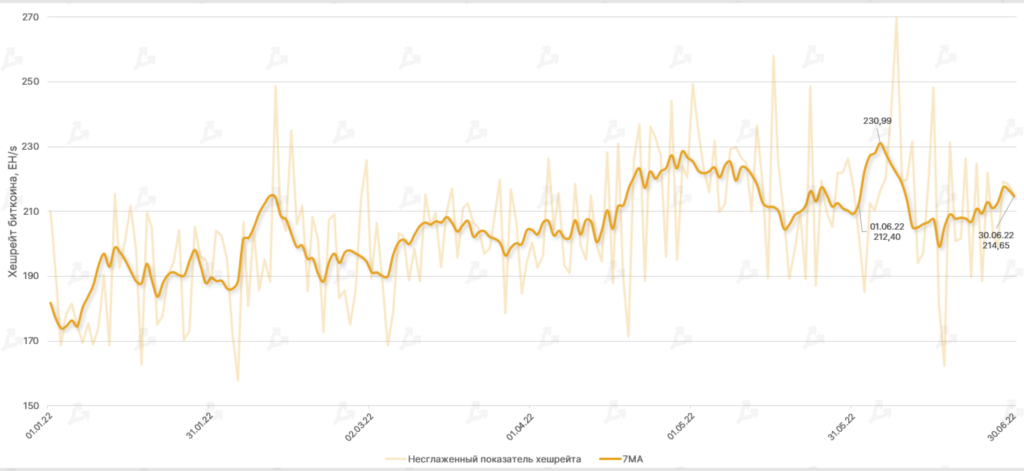


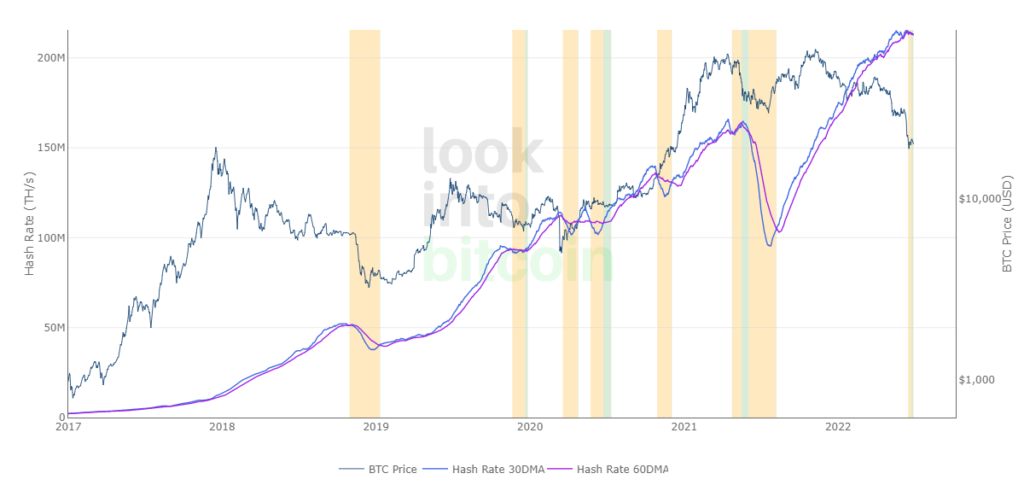
- In June hash rate hardly changed; the smoothed seven-day moving average rose just 1%, to 214.65 EH/s. Such a sluggish change is linked to the possible shutdown of lower-performance miners in a bear market.
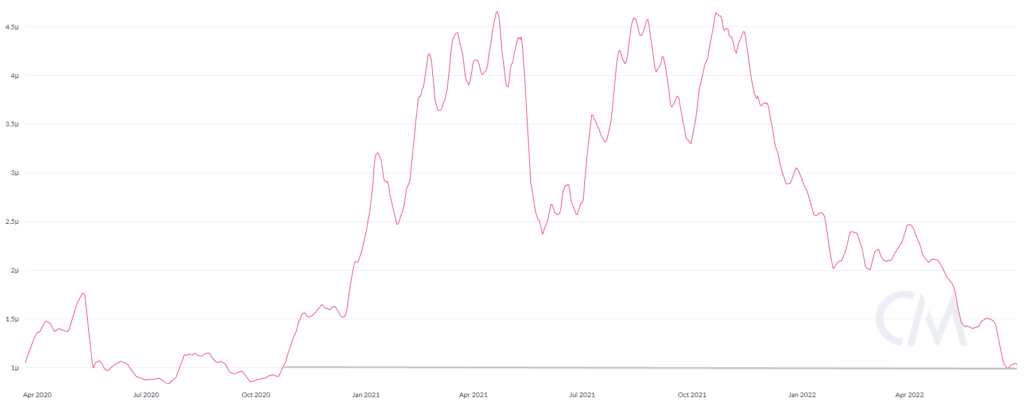
- Hash price fell to $0.09 per TH/s, matching levels from October 2020. In this scenario many miners must sell cryptocurrency to cover costs, putting downward pressure on the market.
- Arcane Research researchers estimate that the latest-generation Antminer S19 ASIC miner yields around $13,000 per mined BTC (at electricity cost of $40 per MWh). Old Antminer S9s are already unprofitable.


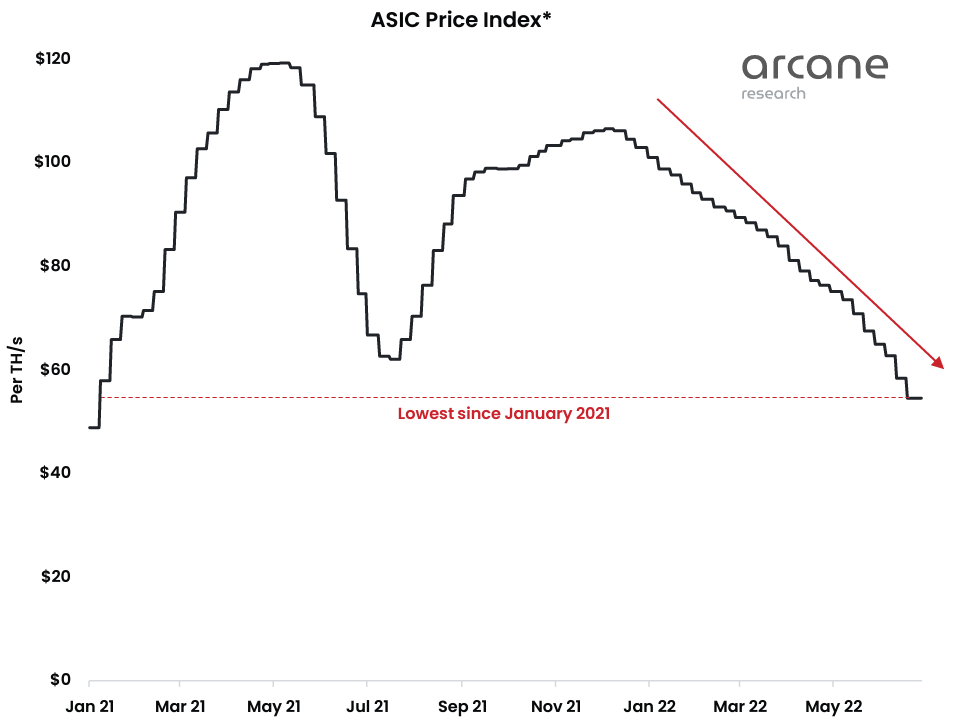


- The cost of equipment per terahash has fallen below $60, matching January 2021 levels. Current hash price is roughly half of what it was 18 months ago, signaling low ROI for ASIC miners.
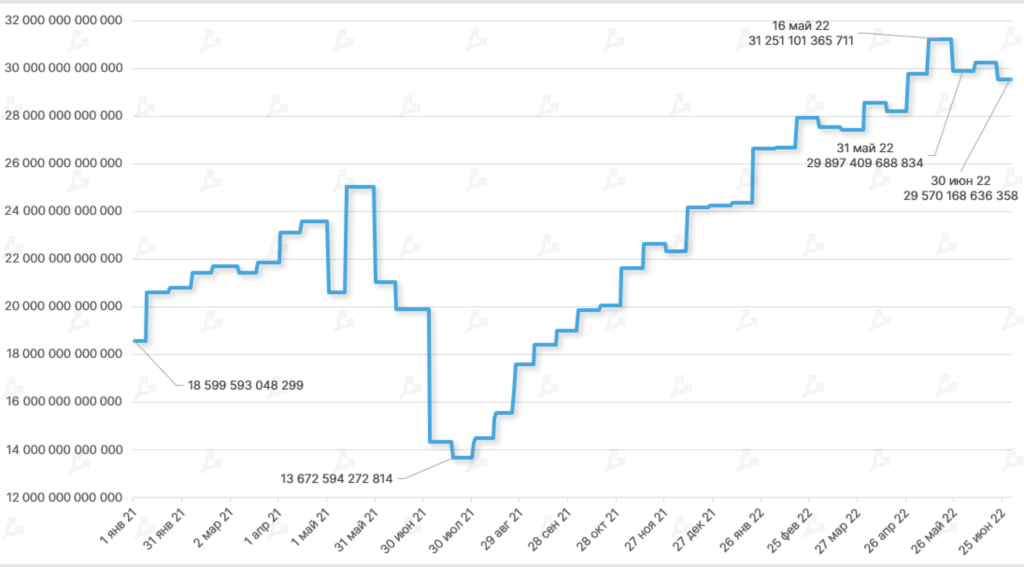
- The Bitcoin mining difficulty rose by only 1% for the month — to 29.57T. The metric sits near the level prior to the May sell-off.
- Relatively high difficulty against falling prices worsens miners’ position, reducing profitability and increasing costs.


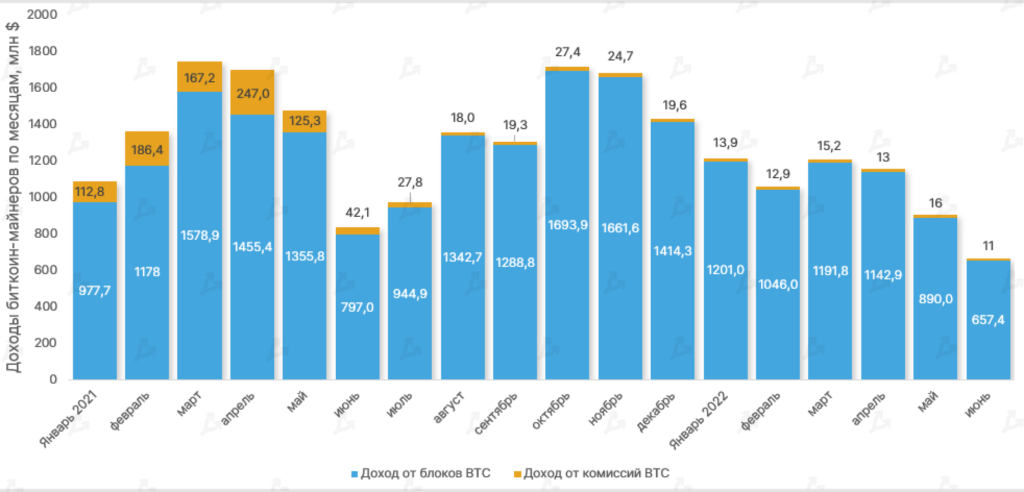


- In June, total Bitcoin miner revenues fell 26%, to $668 million, with a marked acceleration since March.
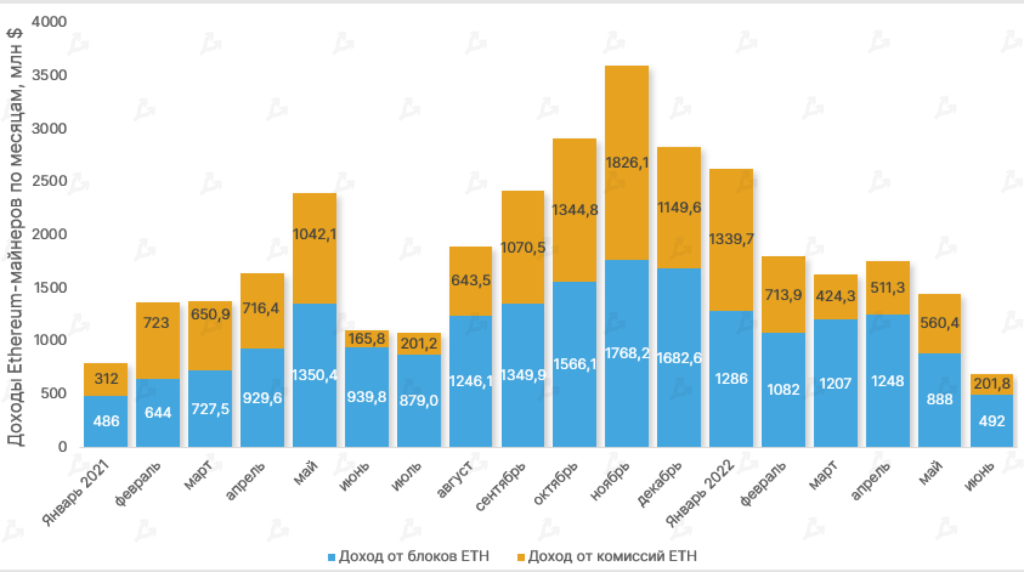
- Total Ethereum miner revenues fell 52% — Ether mined in the month totaled $694 million. This is below January 2021’s $798 million.
- These figures add to the case for miner capitulation and a possible market-cycle bottom.


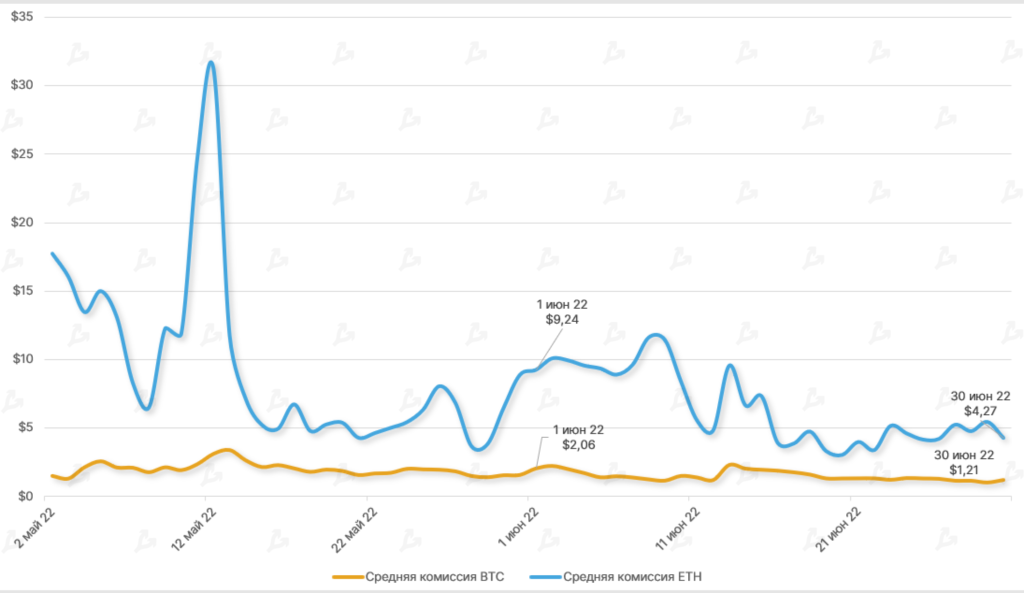
- Average on-chain fee per Ethereum transaction fell 53.7% month-on-month to $4.27, comparable to July 2021 levels.
- In the second half of June, the average fee per Bitcoin transaction did not exceed $2.
- The main reason for these low values is cooling on-chain activity amid bearish sentiment.
Trading volumes


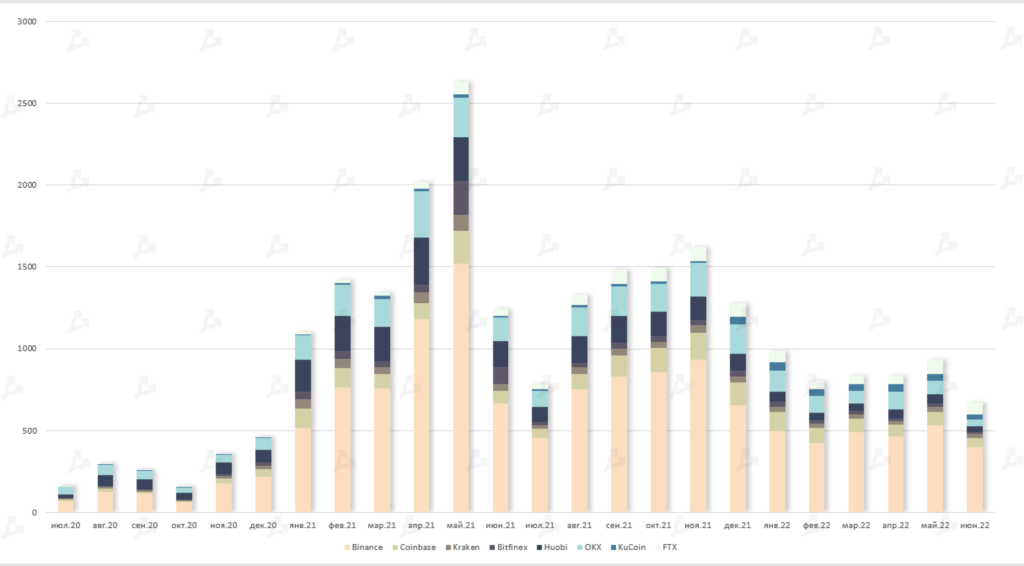
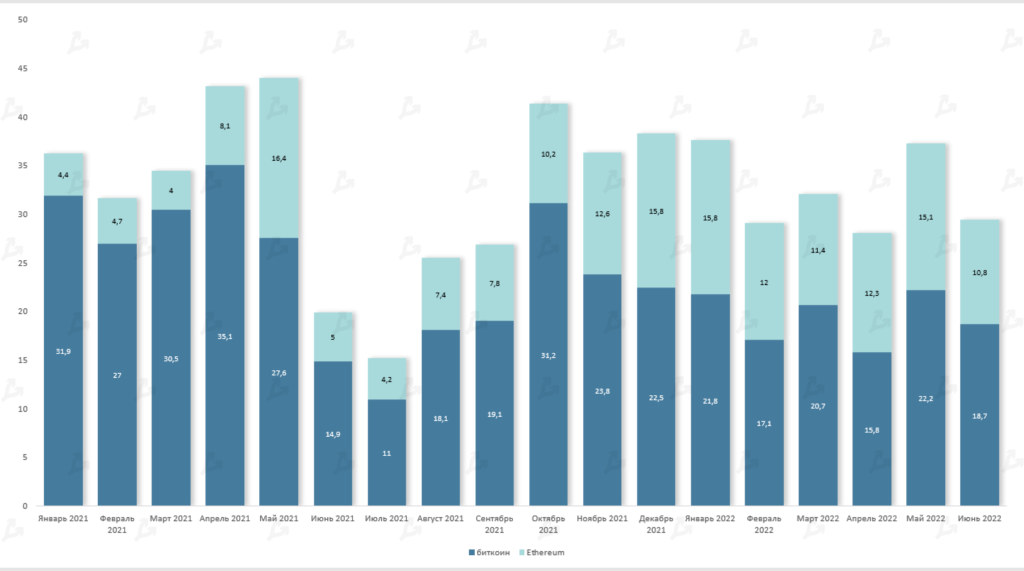
- In June trading volume on crypto exchanges reached a June 2020 low of $672 billion.
- By platform, Binance remained the leader with $398 billion. FTX again beat Coinbase and OKX — $72 billion vs $59 billion and $41 billion respectively.
Futures and options


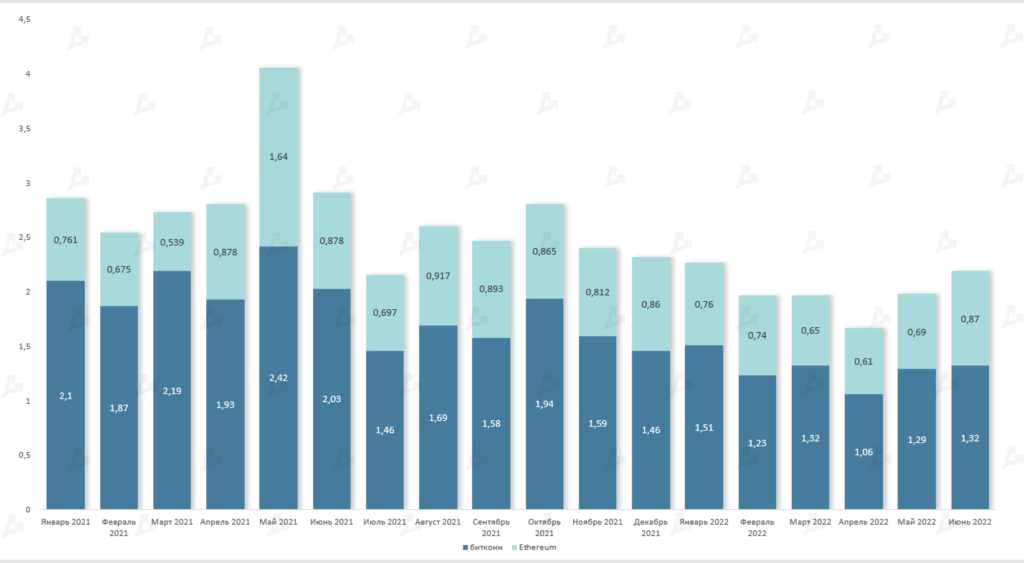


- In June investors showed strong interest in derivatives on Bitcoin and Ethereum. Futures trading volume was the highest in the quarter ($1.32 trillion for Bitcoin and $0.87 trillion for Ethereum).
- Open interest (total futures positions) declined during the month from $16 bln to $10.4 bln, while daily liquidations on June 13 exceeded $1 bln.
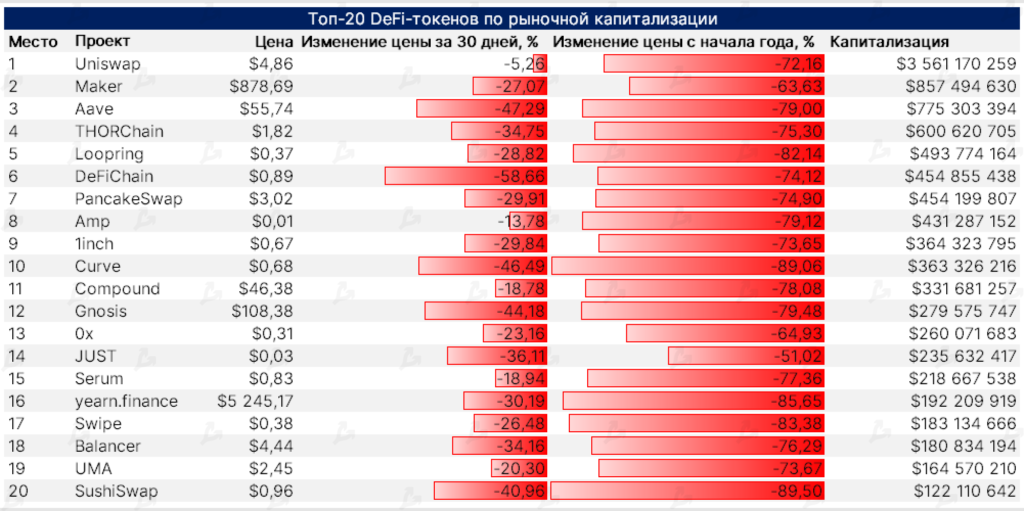
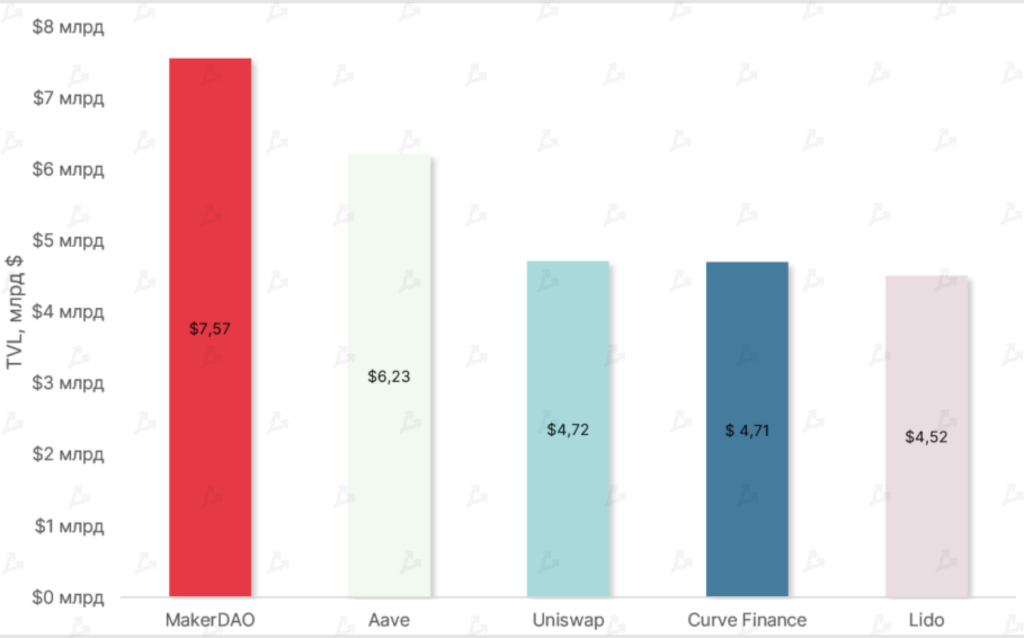
DeFi


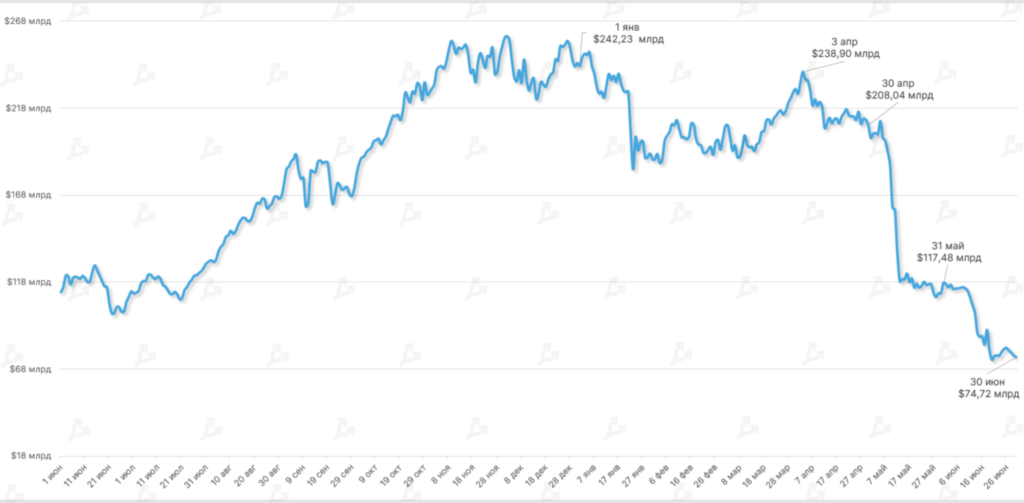


- In June the TVL of smart contracts in DeFi fell 36% to $74.72 billion. The downturn was driven by the macro market crisis and issues surrounding major industry players and stETH.
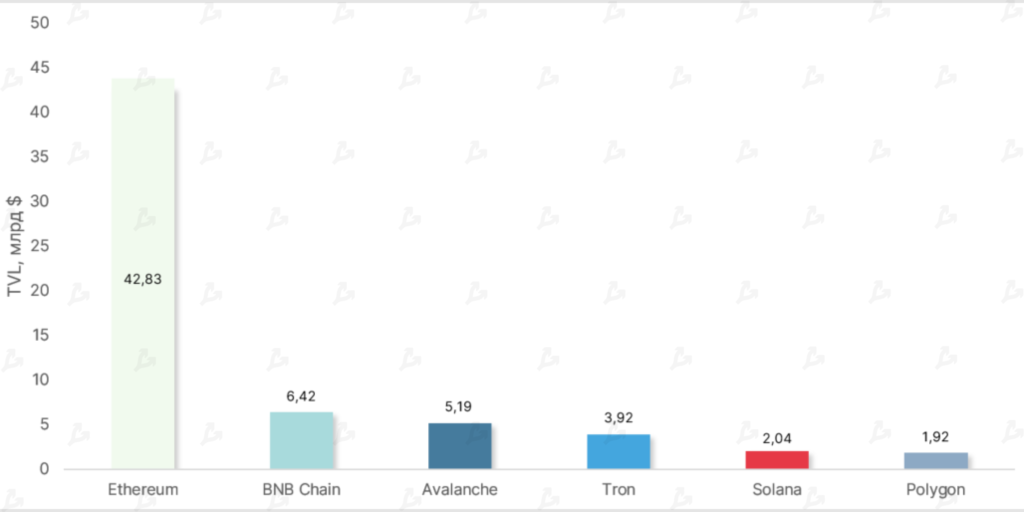
- Ethereum remains the undisputed leader, with TVL around $42.83 billion (down from $71.98 billion in May). Meanwhile, ETH-denominated TVL rose by 11% to 40.27 million from 37.74 million in May.
- The Avalanche ecosystem rose to third place in TVL terms. Inflow to Avalanche-based dApps for June amounted to 111.32 million AVAX (+53% vs. May), partly due to the cross-chain bridge launched with Bitcoin.