March 2022 in Numbers: Terra Rally, 19 Million Bitcoins M mined, and Russia Sanctions
Key Takeaways
- Bitcoin and Ethereum prices reached year-to-date highs.
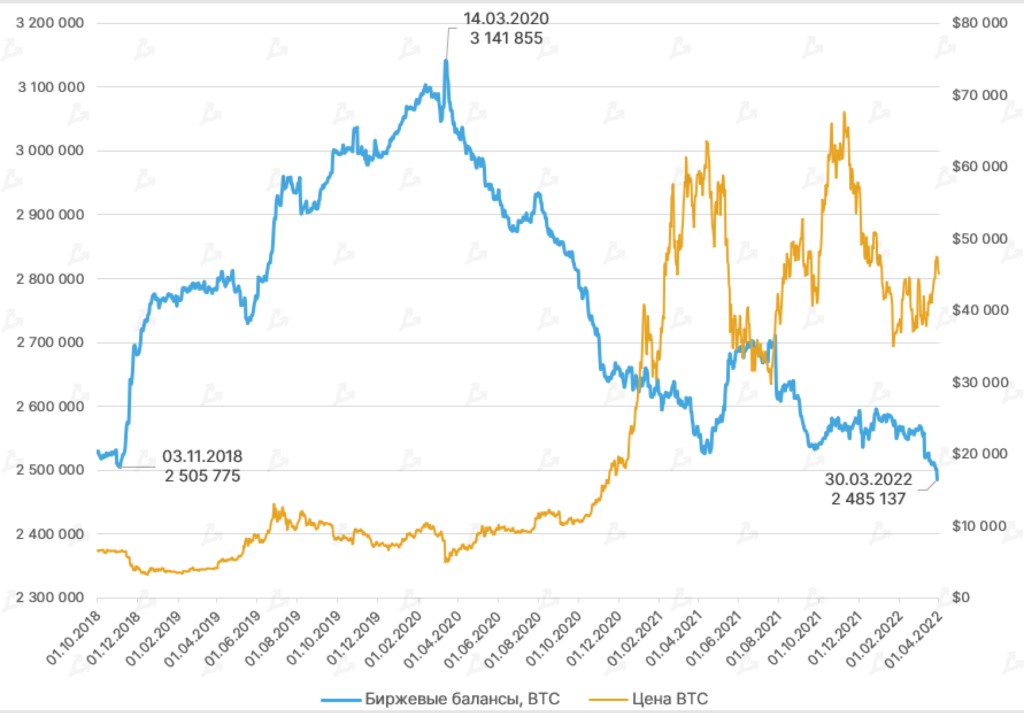
- The outflow of Bitcoin from centralized exchanges accelerated.
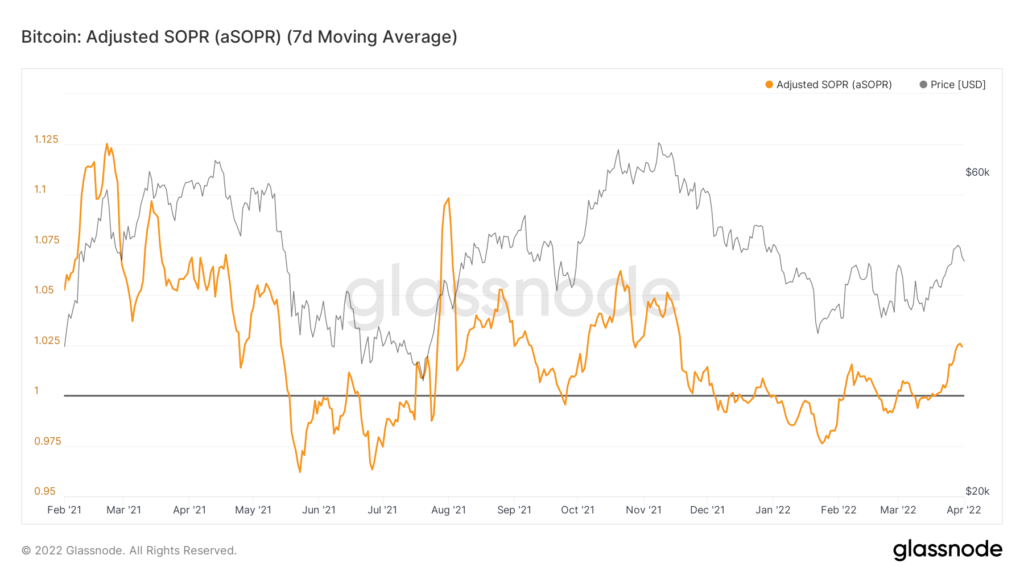
- On-chain indicators signal improving market sentiment.
- In February–March, the Ethereum protocol burned over 330,000 ETH.
- The 19,000,000th Bitcoin was mined.
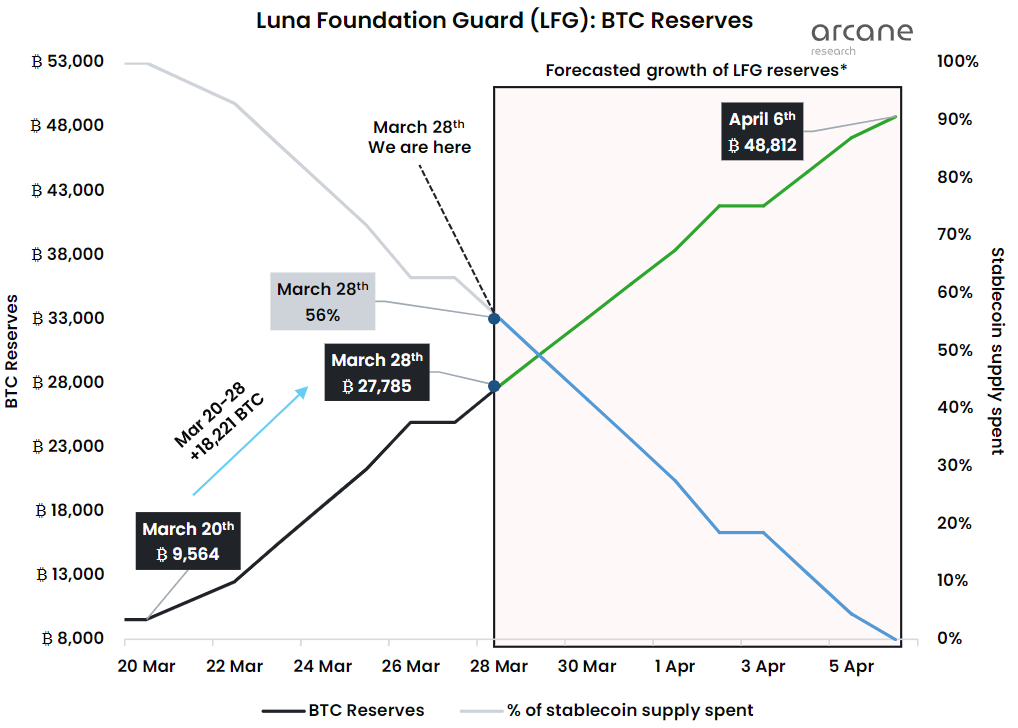
- The Terra ecosystem continues to grow rapidly. Luna Foundation Guard acquired more than 30,000 BTC.
- Stablecoins’ market capitalization reached $178 billion.
- Interest in NFTs is fading.
- The DeFi sector partially recovered after the global correction.
Movements in Leading Assets
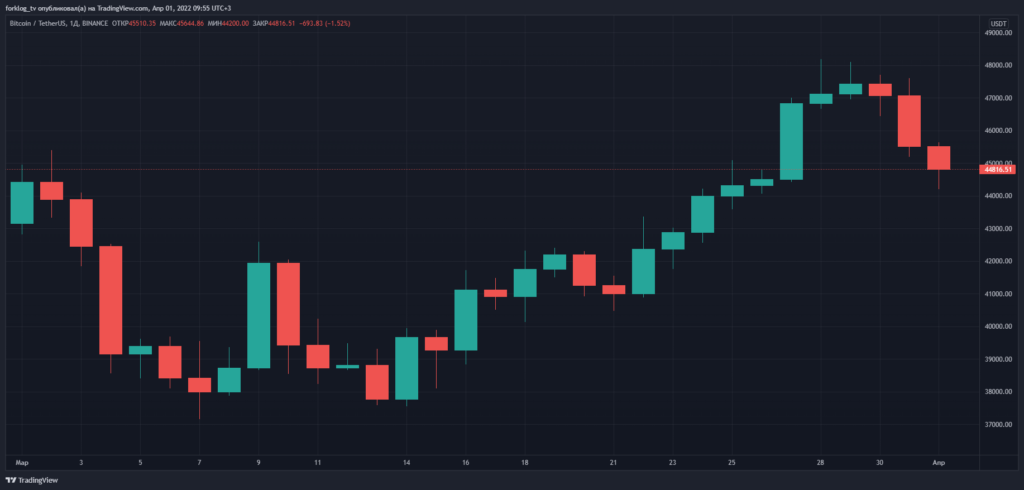
- After testing the $45,000 level at the start of the month, Bitcoin price returned to the consolidation range designated at the start of the year, where it traded for most of the month.
- Only on March 27 did quotes exceed $45,000 again — the next day saw the year’s high for 2022 at $48,189.
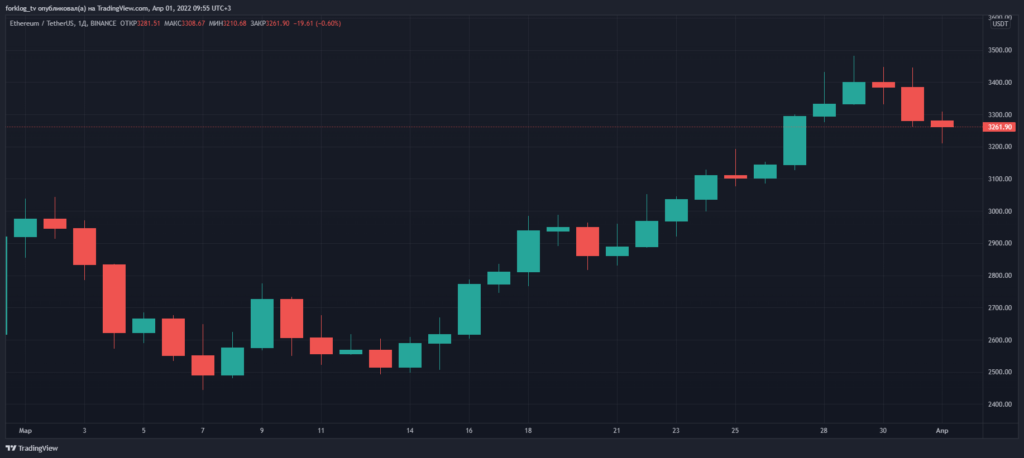
- Ethereum followed a similar trajectory — topping $3,000 and reaching a 2022 high of $3,481. The growth phase coincided with Bitcoin activity.
Media: Cryptocurrencies-Linked Stocks (as of 31.03 close)
Динамика ценных бумаг майнинговых компаний (на момент закрытия 31.03)
Canaan (CAN):
-1.27%
Ebang International (EBON):
-11.45%
Riot Blockchain (RIOT):
+16.38%
Hut 8 (HUT):
-15.6%
Marathon Digital (MARA):
+2.12%
Macroeconomic Backdrop
- By March 16–17, the Fed raised the federal funds rate by 25 basis points for the first time since December 2018 — to 0.25%–0.50%. Inflation’s forty-year peak prompted a forecast revision for this year to 4.3% (from 2.6%), and for next year to 2.7% (from 2.3%). A balance-sheet run-off could be decided at one of the next meetings.
- The futures market priced in an 68.8% probability of a 50bp hike at the May meeting, and 75.3% in June. By year-end the baseline scenario pointed to a 2.5%–2.75% target range, versus 1.9% currently.
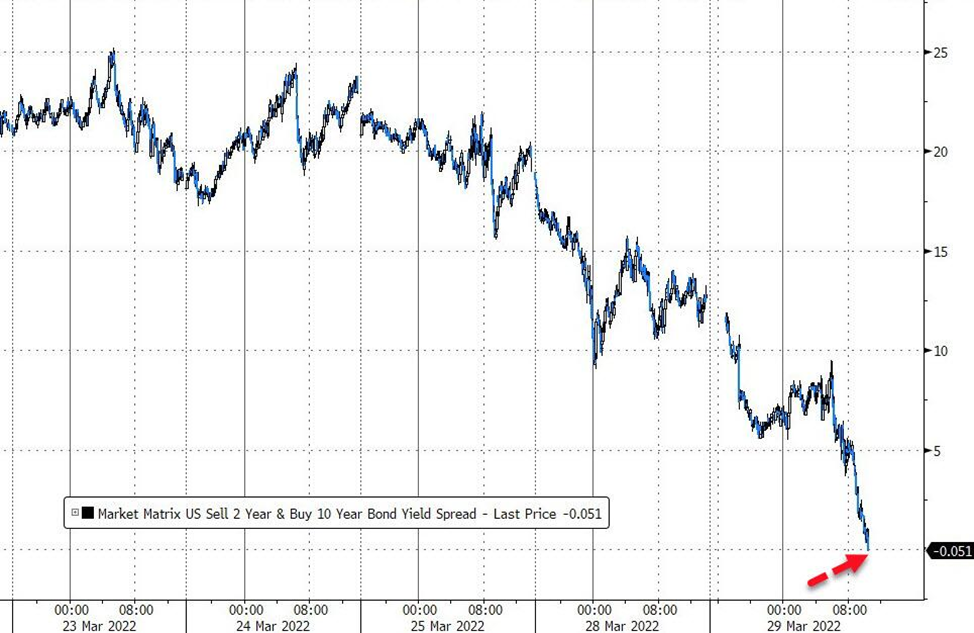
- The expected tightening of monetary policy could set the stage for an economic recession. The U.S. Treasuries market showed an inversion (two-year yields exceeding ten-year yields).
- According to Bespoke, in similar episodes the downturn tended to occur within a year with roughly a 2:1 odds, and within two years with a 98% probability.
- The Fed’s decision supported the U.S. equity market — the S&P 500 rose 3.6% last month. Investors did not rule out a 0.5% rate rise as early as March. In Jan–Feb the drawdown near the peak was almost 15%. The correlation between the “barometer of the U.S. economy” and Bitcoin dropped to levels seen at the end of 2020.
- Partly due to short liquidations on the derivatives market, Bitcoin’s outperformance occurred ahead of the curve. Sanctions on Russia may have contributed. At the same time, Glassnode analysts urged caution in declaring the bear market over.
Market Sentiment, Correlations and Volatility
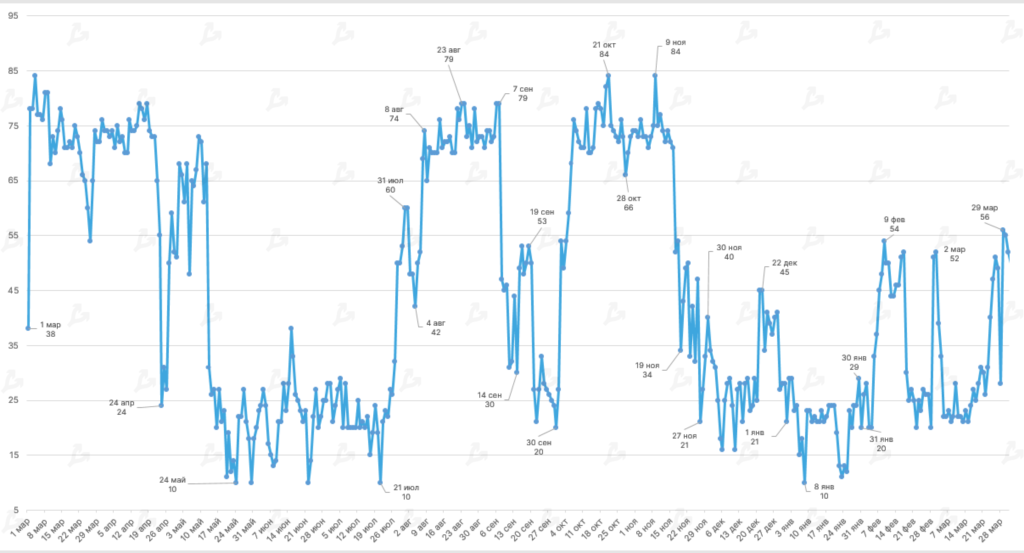
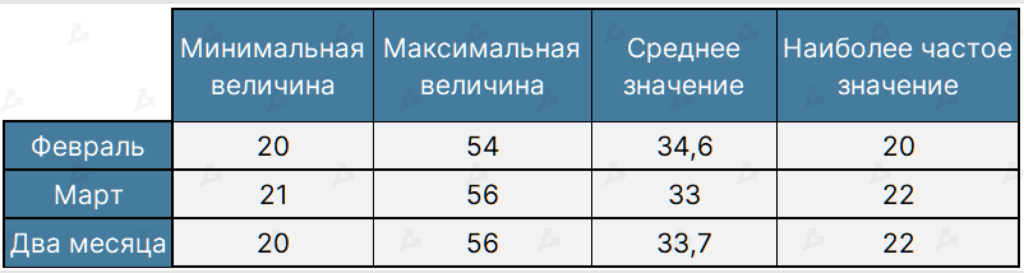
- In February–March the Fear & Greed Index stayed within a neutral range. The index fell to a two-month low (20) in February, while a high of 56 was reached in March.
- Following the Fed’s 17 March rate hike, the indicator strengthened by 25 basis points.
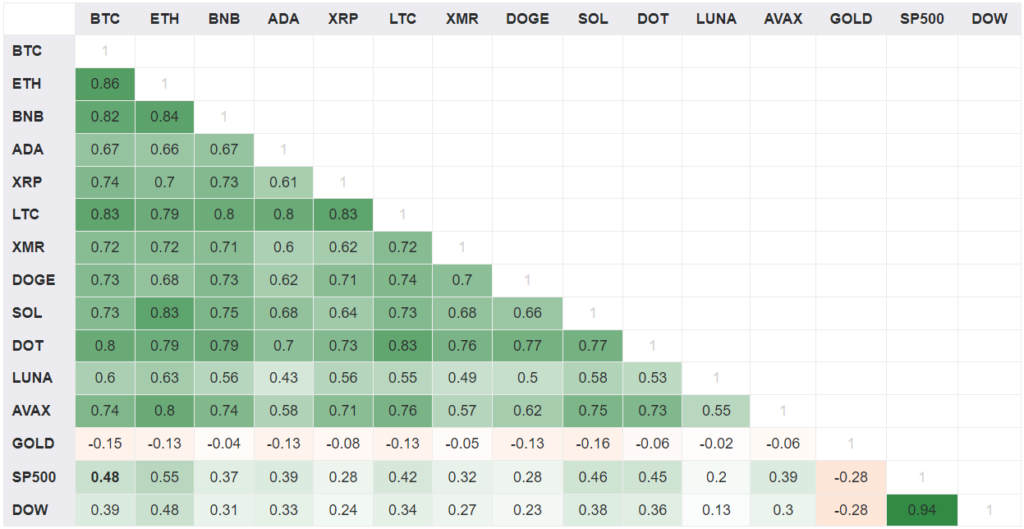
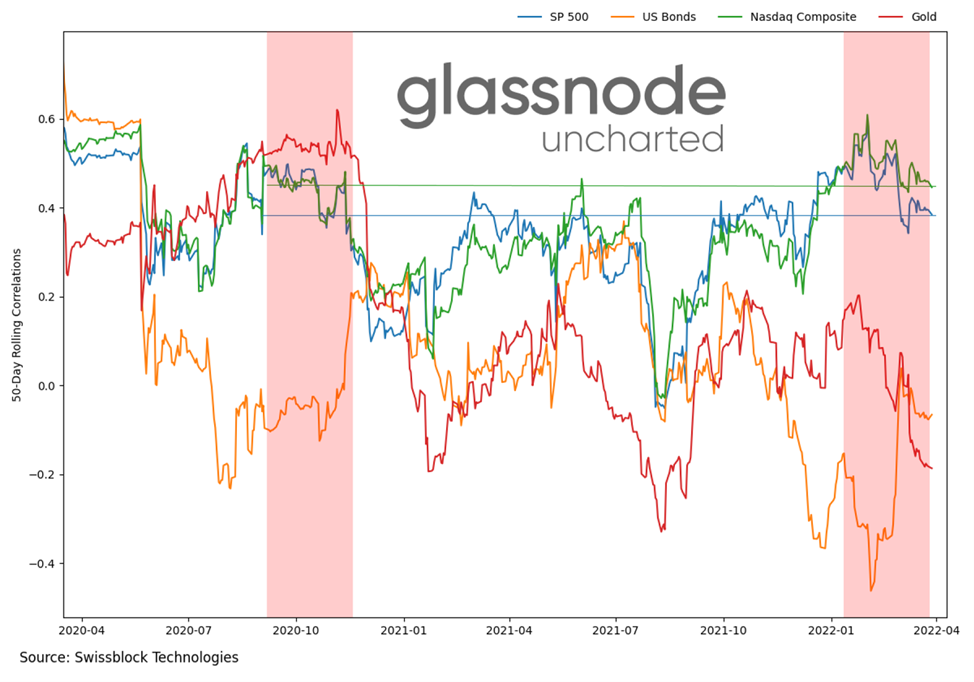
- Over the last two months, the statistical correlation between Bitcoin and the U.S. stock market strengthened, setting a new historical high. Correlation with the S&P 500 reached 0.48, with the Dow Jones at 0.39.
- Correlation with the stock market is more pronounced for Ethereum (SPX 0.55; DOW 0.48).
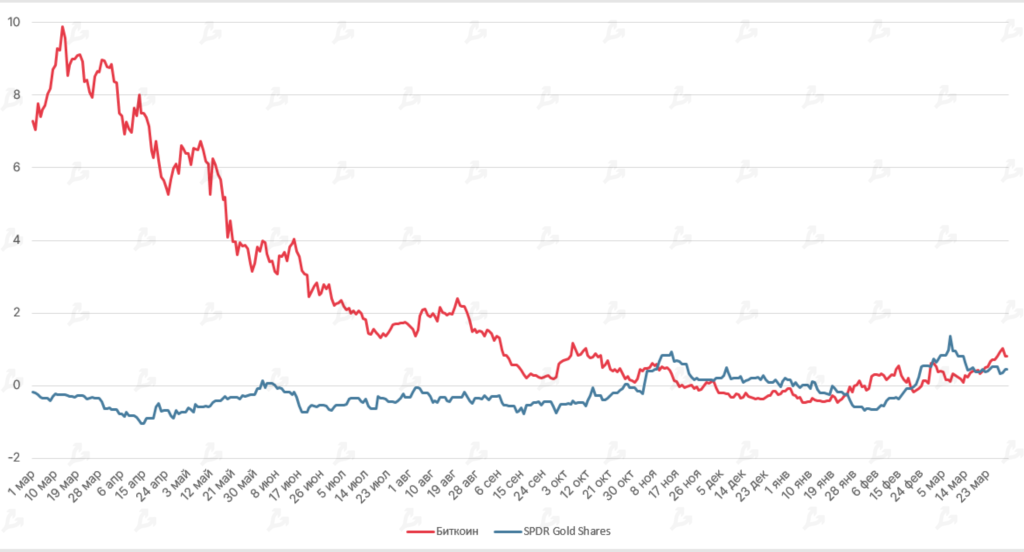
- Bitcoin price movements and gold moved in opposite directions (-0.15). Alongside stronger correlation between crypto and equities, this provides an opportunity to use precious metal for hedging.
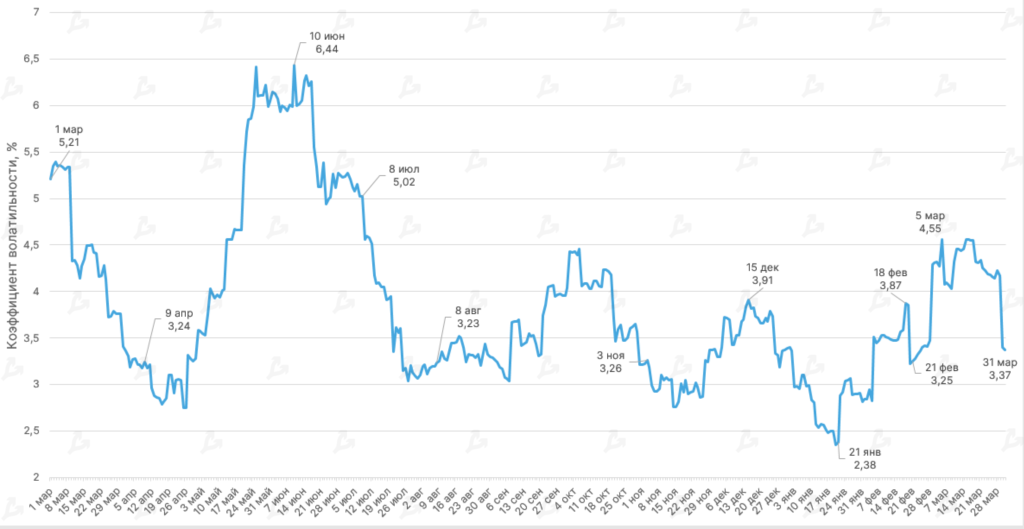
- In February–March Bitcoin volatility hovered between 2.81% and 4.50%. The two‑month average was 3.84% (3.39% in February, 4.25% in March).
- Volatility surged amid Russia’s invasion of Ukraine, as traders were unsure how the asset would react to geopolitical risk. At the end of March the average measure eased but did not return to January’s level (2.83%).
- The Sharpe ratio for Bitcoin (using the 2‑year U.S. Treasuries as the risk‑free proxy) suggested bitcoin risk-adjusted returns were higher than gold’s in mid‑March. The ratio remained positive.
- The share of Bitcoin that has not moved for over a year rose above 63%. The near‑historical high suggests most holders did not dump coins during two drawdowns of more than 50% this past year.
- Despite improving market mood after a prolonged decline, the MVRV Z‑Score does not signal strong oversold conditions. This implies the bear market may not be over yet.
Ethereum
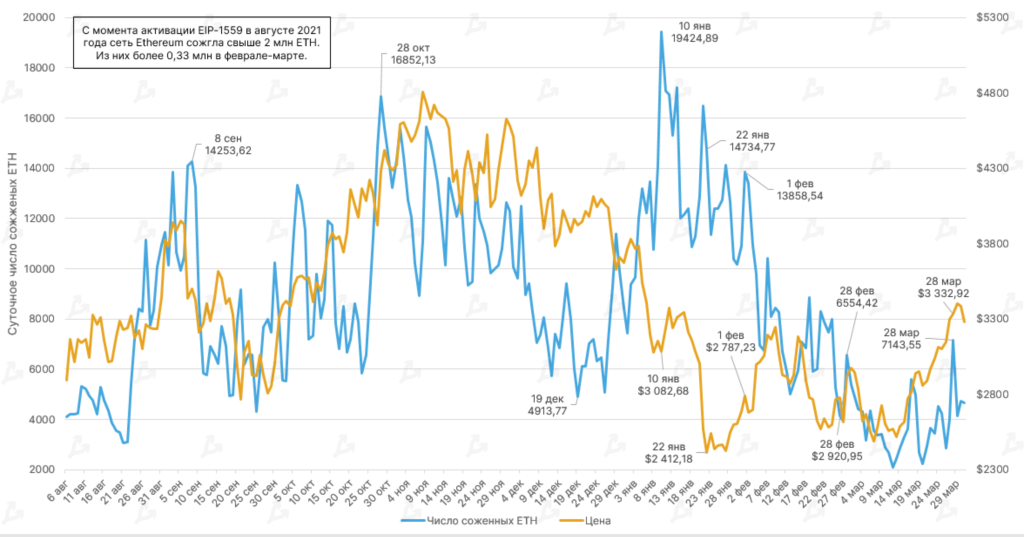
- Since the EIP-1559 activation in August 2021 the Ethereum blockchain has burned over 2 million coins. In February–March the protocol removed more than 330,000 ETH from circulation.
- Against a local decline in Ethereum prices, the burn rate slowed. The aggregate over the last two months did not exceed January’s level (more than 392,000 ETH).
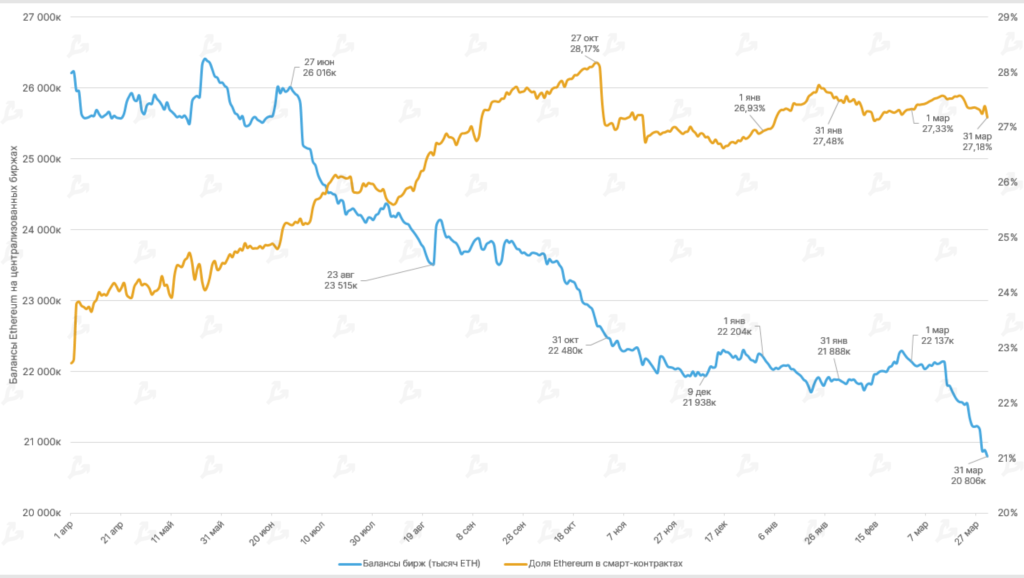
- During February–March there were withdrawals of Ethereum from centralized exchanges. By the end of the reporting period, ETH supply on CEX fell below 21 million, a fresh low since autumn 2018.
- At the same time the share of ETH locked in DeFi protocols remains high — by the end of March it stood at 27.18%, slightly lower than in January (27.48%).
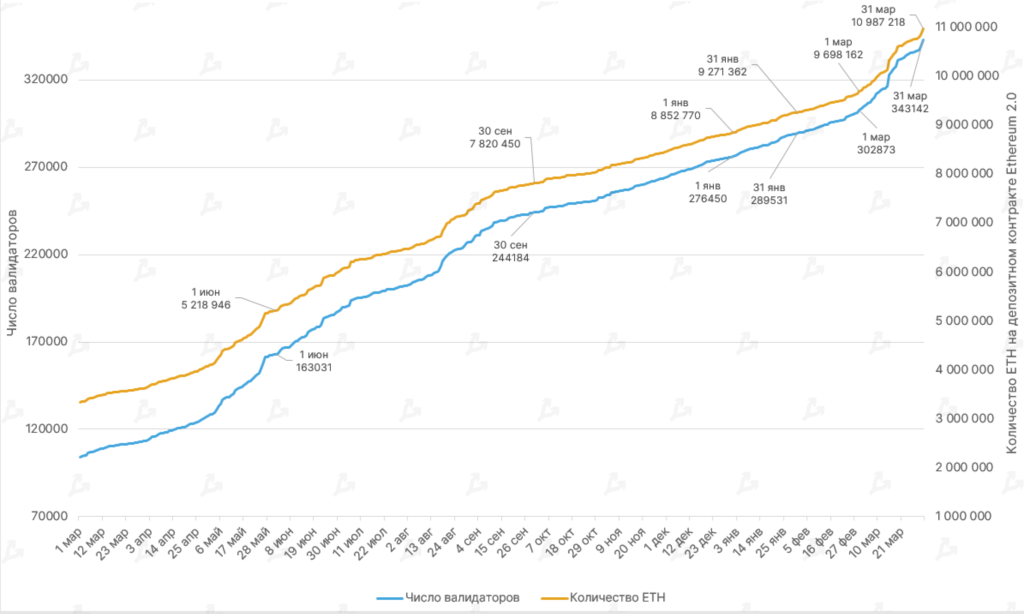
- By March the number of ETH on the Ethereum 2.0 deposit contract approached 11 million. Over the last two months the metric rose by 18%, with March showing stronger growth than February.
- The number of validators on the Beacon Chain exceeded 343,000. In February–March the number of participants interacting with Ethereum 2.0 rose by 18.5%.
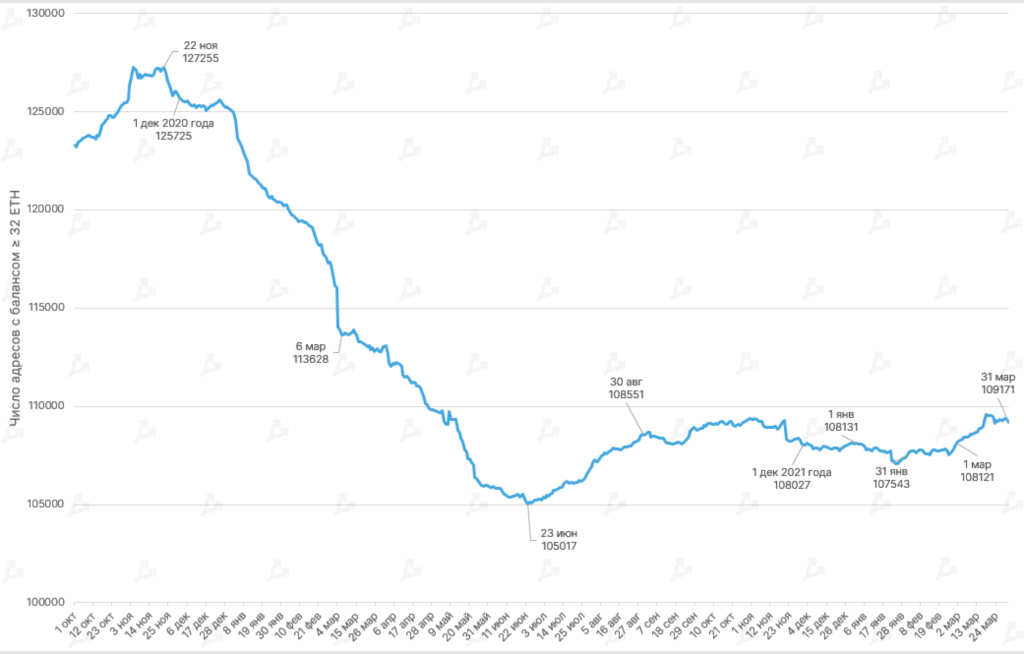
- After January’s decline, in February the number of addresses with balances ≥ 32 ETH again began to rise. By 31 March the figure reached 109,171.
Lightning Network
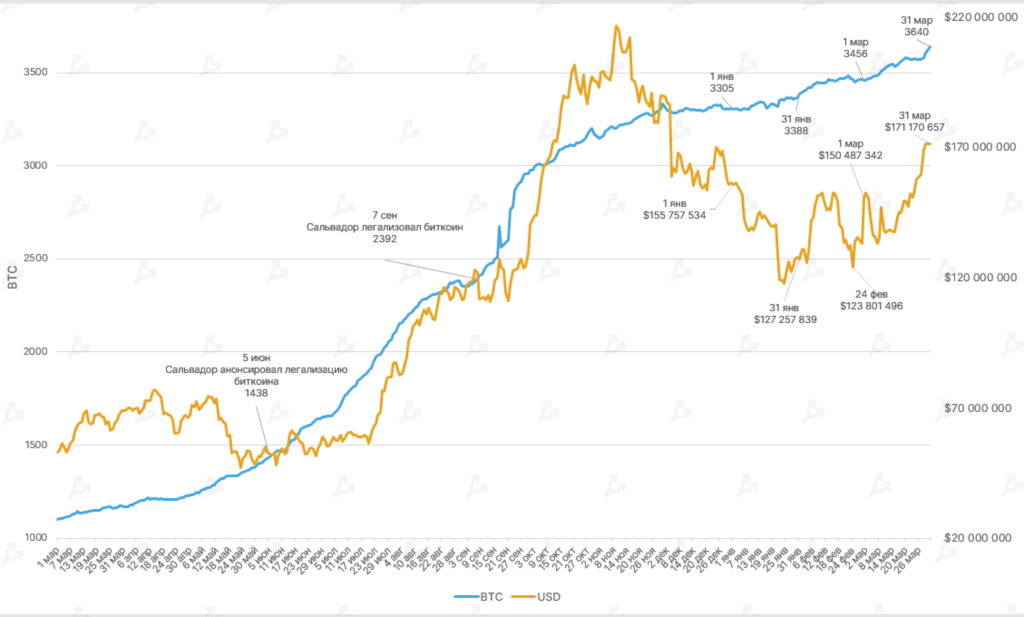
- Lightning Network capacity for micro‑payments continues to grow: in February it rose 2%, in March 5%. Over two months the metric reached 3640 BTC.
- Arcane Research noted that the ecosystem’s growth is outpacing capacity growth. This is mostly due to bitcoin’s legalisation in El Salvador.
- The number of Lightning Network nodes and channels slightly declined in March: the first metric fell 1.88% and the second 1.07% month-on-month. February had shown positive momentum.
Mining, Hashrate, Fees
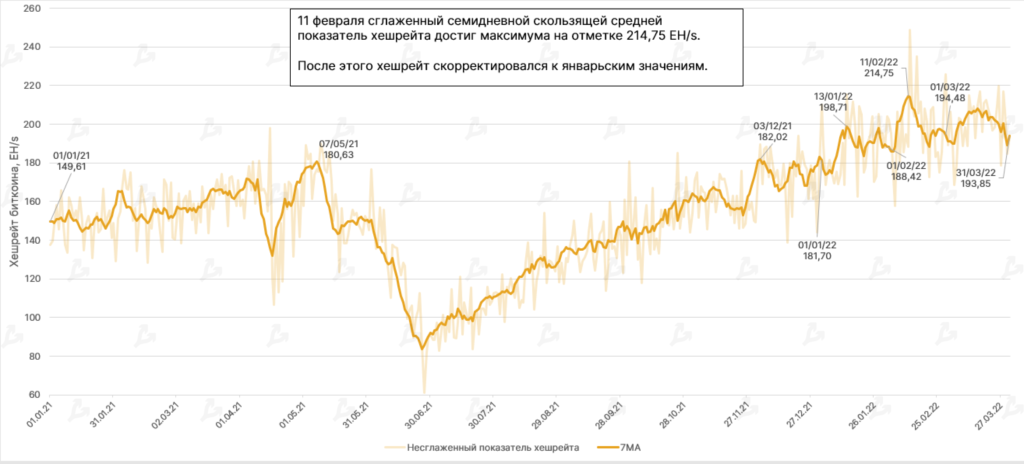
- 11 February the Bitcoin hashrate reached a historic high of 214.75 EH/s. It soon corrected to January levels slightly above 190 EH/s.
- For February–March total network hash power rose by 2.88% — from 188 EH/s to 193.85 EH/s.
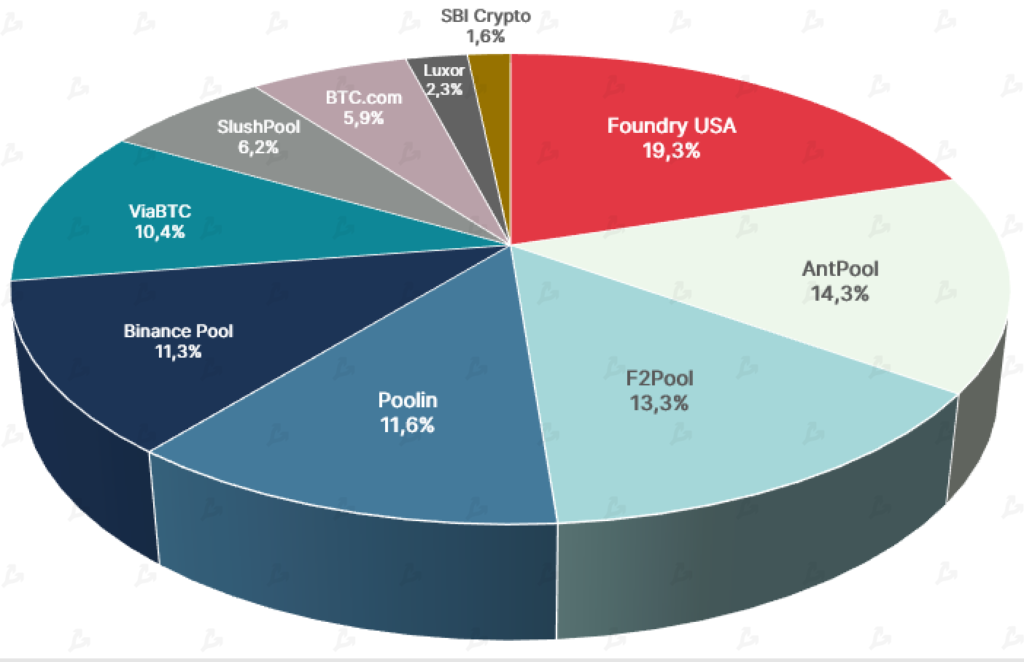
- The Foundry USA mining pool maintained leadership. On 1 February its share in total hashrate was 16.5%, rising to 19.3% by 1 April. It is followed by AntPool and F2Pool, contesting for the No. 2 spot.
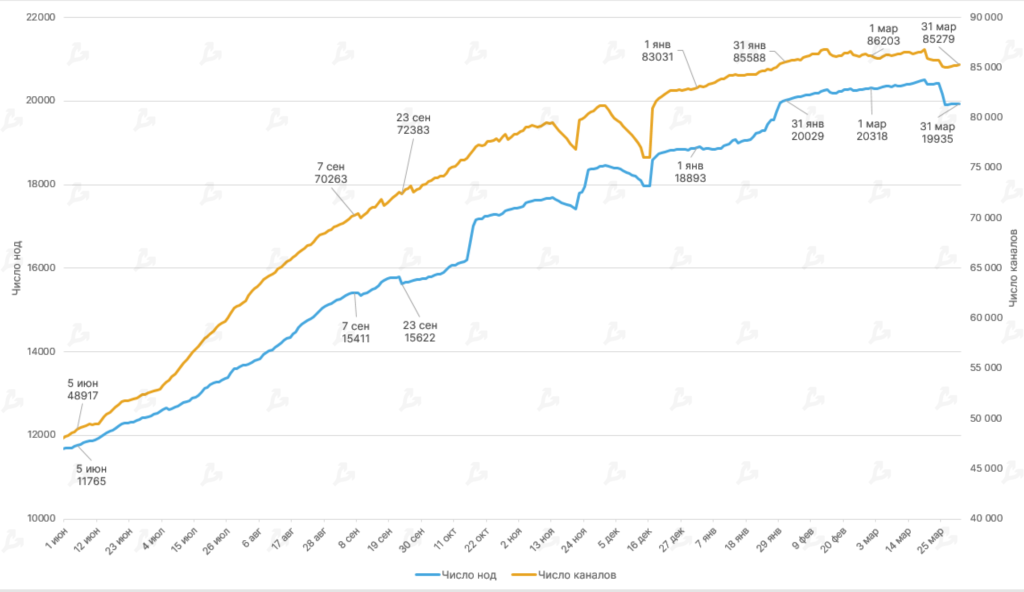
- As of 01.04.2022 miners mined 19,000,000 BTC. The remaining 2 million coins reserved by the protocol will take roughly another ~140 years to mine.
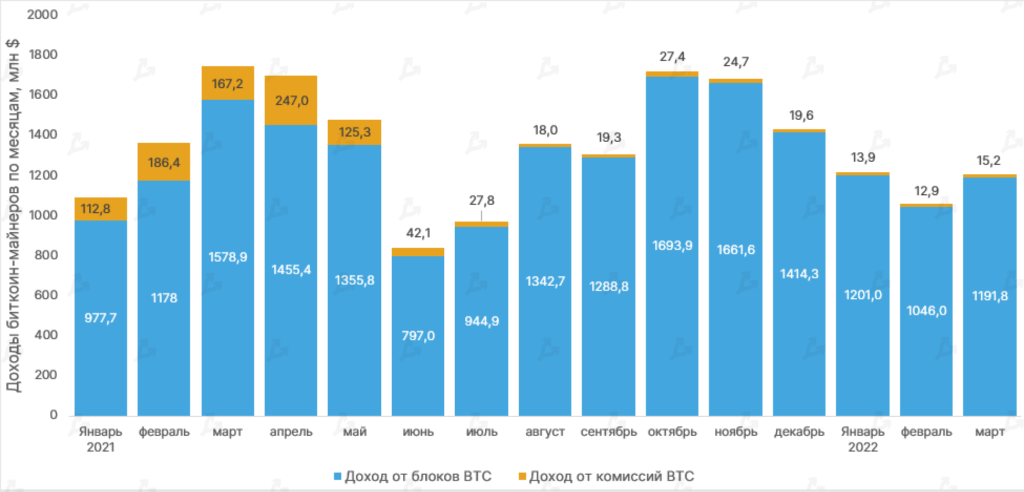
- In February Bitcoin miner revenue fell 13% versus the prior month as prices declined. In March proceeds from mining rose 14%, rebounding to January’s level (about $1.2 bln).
- As before, the share of fees in Bitcoin miners’ revenue remains just over 1%.
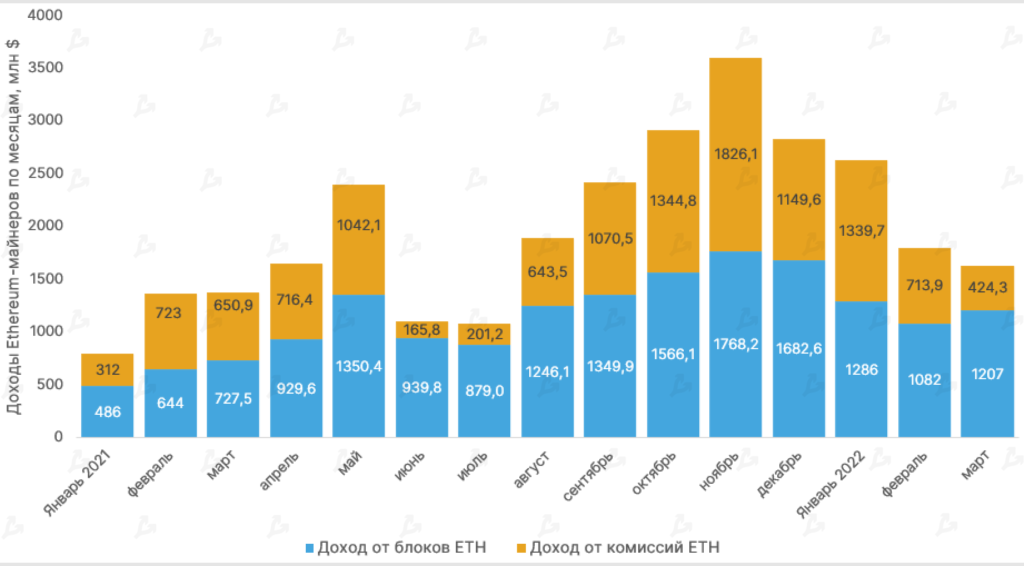
- In February Ethereum miner revenue fell 32% vs January. In the following month the trend continued — revenue fell 9% (to $1.63 bln).
- The share of fees in Ethereum miners’ revenue fell to 35.16%. This may reflect slower on-chain activity and gas cost in the second-largest cryptocurrency network.
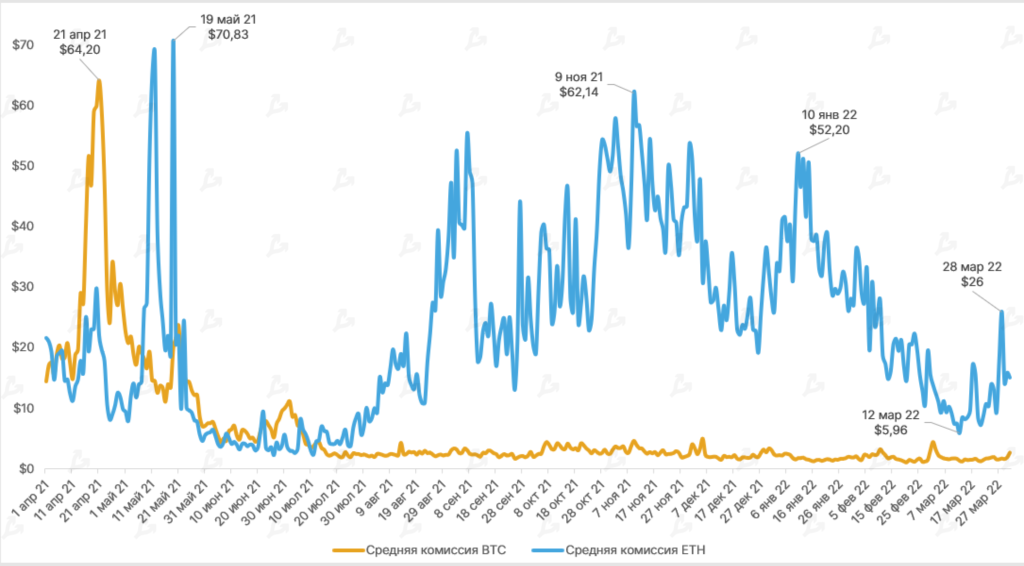
- In February–March continued the trend of falling transaction fees on the Ethereum network. On 12 March the average ETH fee dropped to $5.96, matching July 2021 levels.
- By the end of March the average fee per ETH transaction did not exceed $26.
- Corresponding bitcoin fees in the last two months remained in a persistently low range — $1.1 to $4.46.
Trading Volume
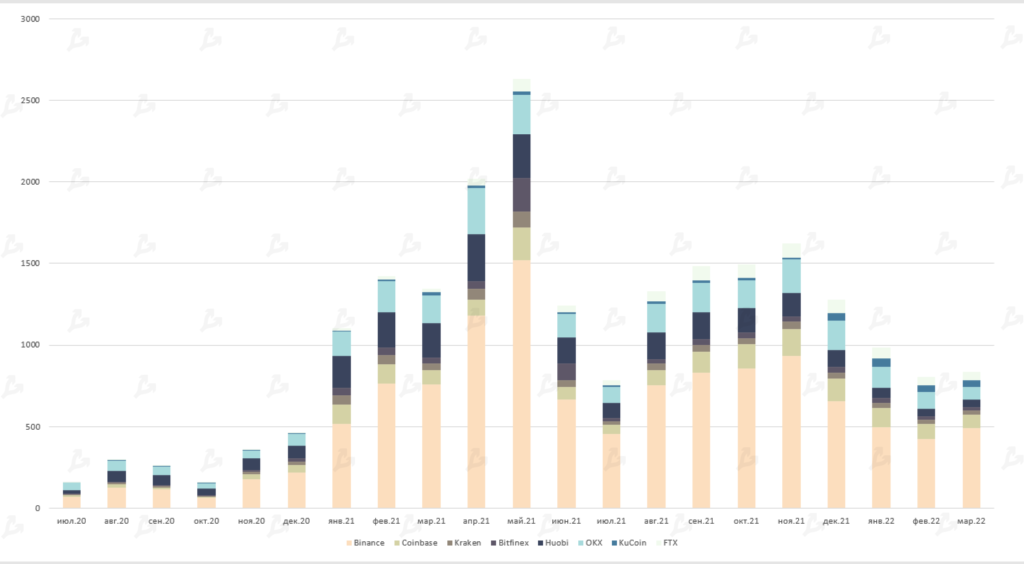
- In March total volume on leading crypto exchanges reached $838 billion.
- Binance maintained the lead with $490 billion. Coinbase: $82 billion, OKX: $76 billion.
Futures and Options
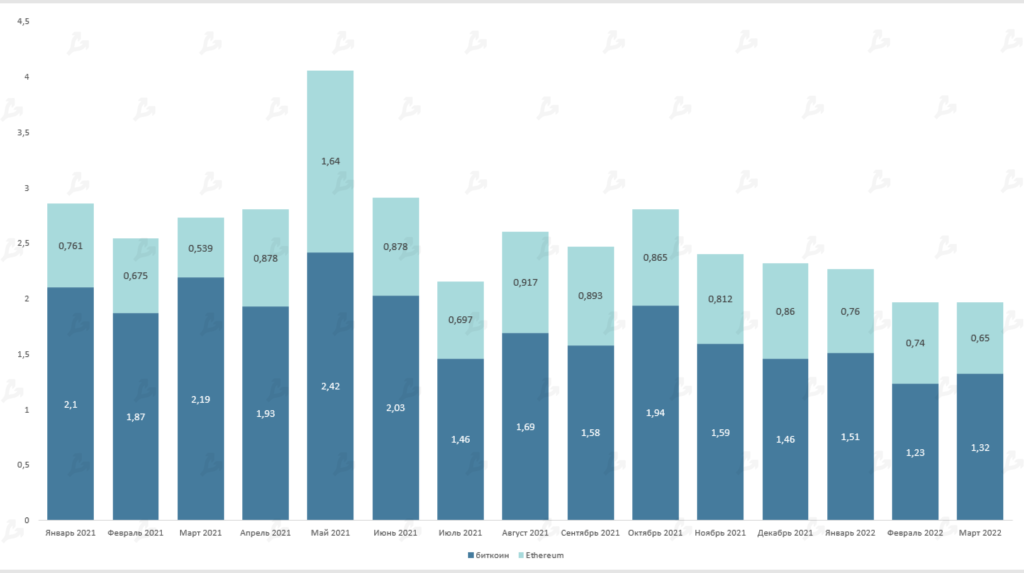
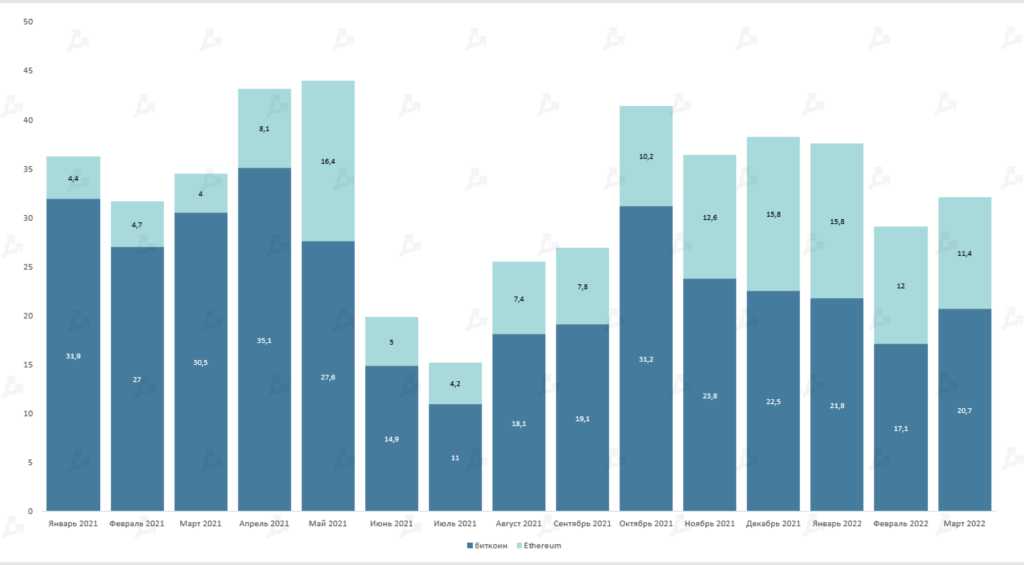
- The total futures volume on Bitcoin‑based products in March rose vs February to $1.32 trillion. Demand for Ethereum-based futures was lower — $650 billion (the lowest in 2022).
- The same pattern holds for options. Bitcoin options volumes rose slightly (to $20.7 billion), while Ethereum’s declined to $11.4 billion (from $12 billion in February).
DeFi
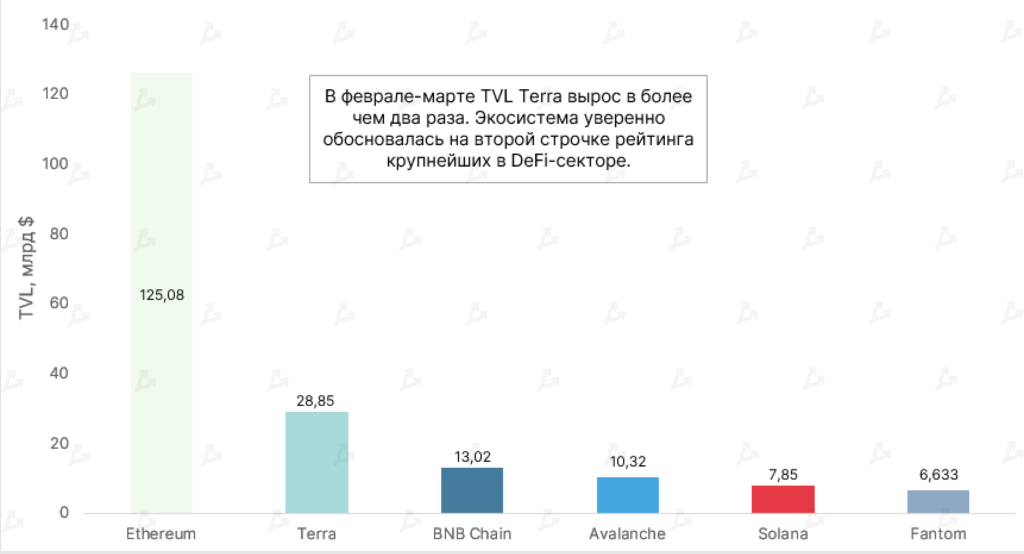
- DeFi sector is recovering after the TVL drop observed in January. Over the last two months the metric rose by 22%.
- The Ethereum ecosystem continues to dominate total TVL. Despite a 12% increase in dollar terms in February–March, the ETH-denominated value fell by almost 11% due to higher crypto prices and popularity of alternative solutions.
- Over the last two months Terra’s ecosystem TVL grew more than twofold, reaching nearly $29 billion. Since February, LUNA’s USD value rose only 3.5%, to 279.75 million coins. This dynamic coincides with the expansion of the LUNA supply as part of UST issuance, which in turn supports UST’s value and makes the asset deflationary over the longer term.
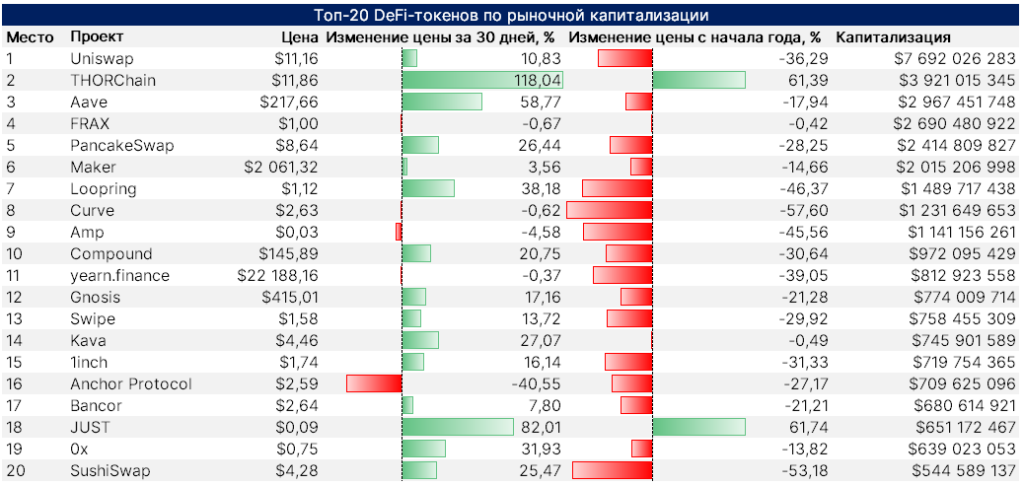
- After a global correction, DeFi tokens managed to recover most of the losses. In March nearly all top-20 assets were in the green.
- The standout was THORChain (RUNE). In March its price rose 118% to $11.86, and its market cap exceeded $3.9 billion. The growth driver was the launch of synthetic asset pools.
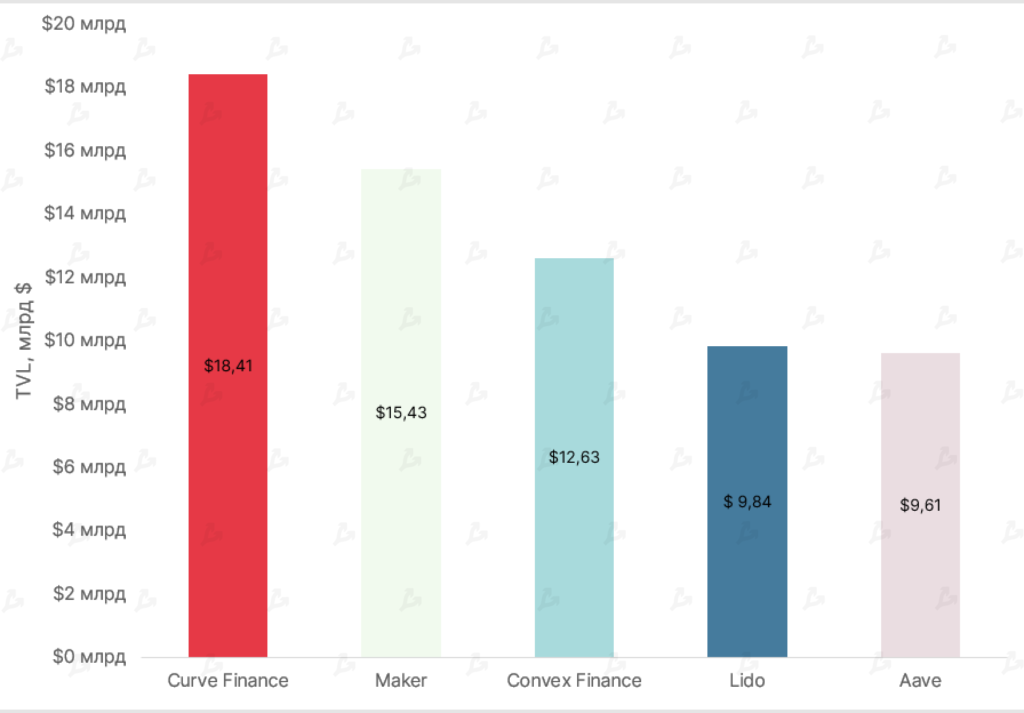
- In Ethereum-based projects, leadership by TVL shifted back to Curve Finance. In February–March its TVL rose 18.6% to $18.41 billion. MakerDAO fell to second with TVL of $15.43 billion.
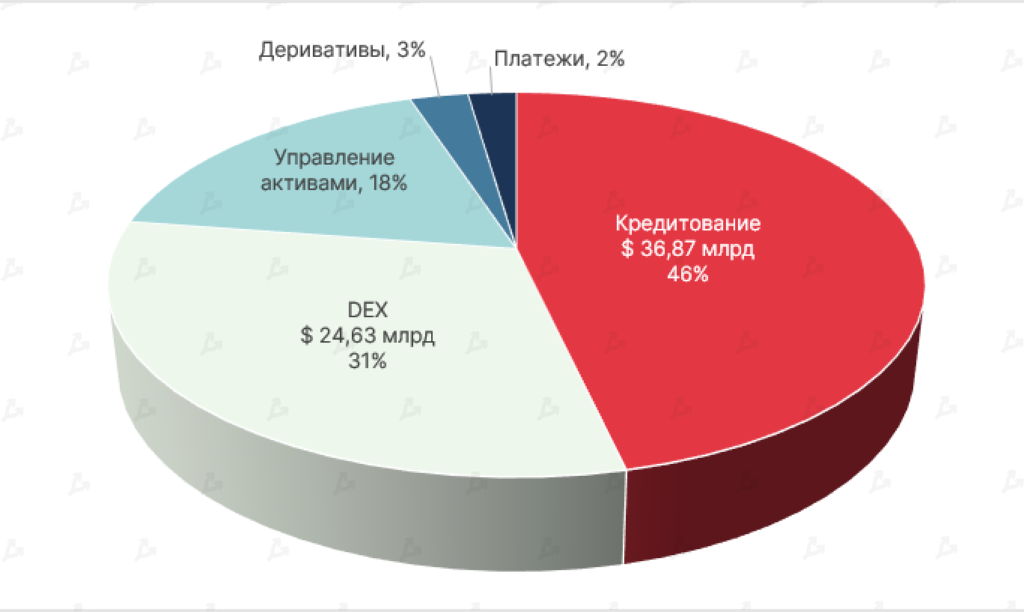
- Lampposts continue to dominate the Ethereum ecosystem — by March they accounted for 46% of the total blocked funds.
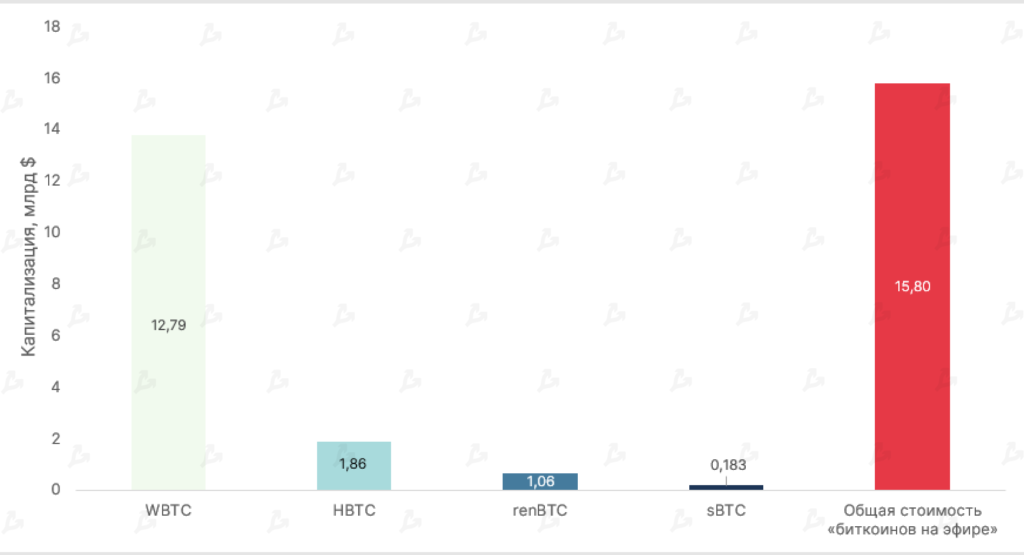
- For February–March the combined market cap of “Bitcoin on Ethereum” stood at $15.8 billion — up 22% since January. The leader in this segment remains WBTC with a market cap of $12.79 billion (dominance index above 80%).
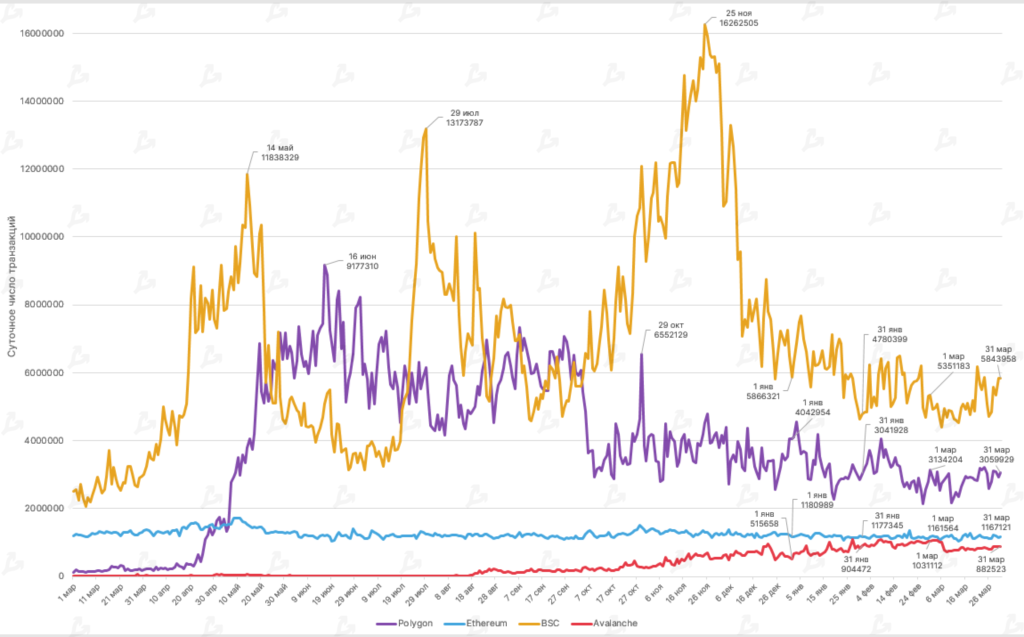
- In March the average daily transactions fell noticeably across most networks included here. Avalanche declined 12%, Binance Smart Chain 8.9%, Polygon 7.8%.
- On-chain activity in Ethereum remained largely unchanged — in March the metric dipped 0.7%. On average the network processed around 1,671,121 transactions per day.
DEX and L2

- Trading volume on decentralized platforms fell sharply from late 2021 peaks, reaching $66.85 billion in March.
- Uniswap remains the undisputed leader with $51 billion. For the second month in a row Curve surpassed SushiSwap — with $4.65 billion and $3.65 billion respectively.
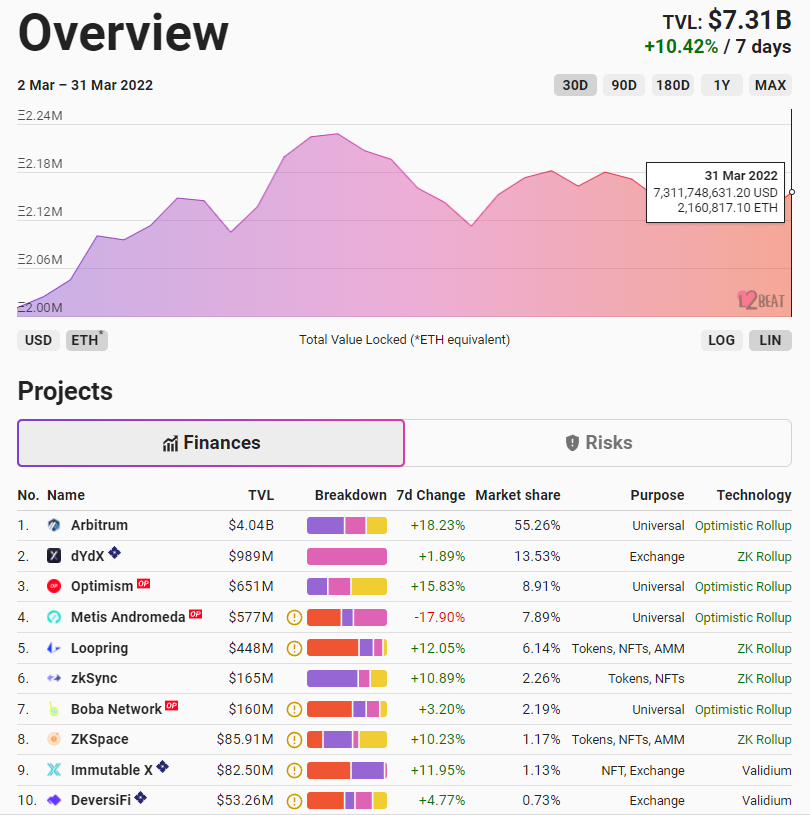
- During the month users interacted with various scaling solutions of Ethereum: 144,313 ETH were added to the ecosystem.
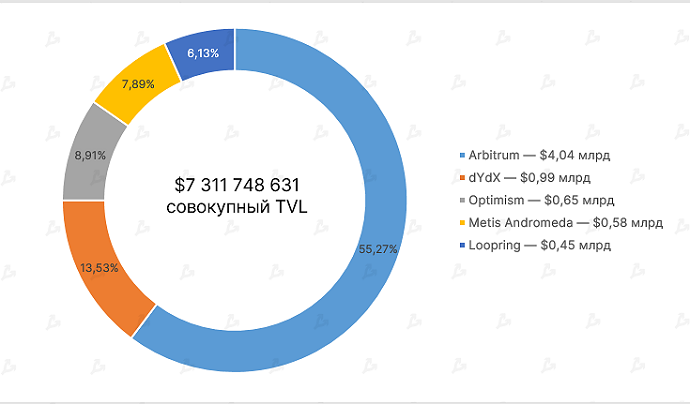
- Due to the rise in Ethereum’s price, the total TVL denominated in USD for Layer 2 protocols rose from $6 bln to $7.3 bln. The vast majority of these platforms recorded inflows, with Metis Andromeda and Sorare as exceptions.
- The leading TVL in the segment — Arbitrum — surpassed $4 bln.
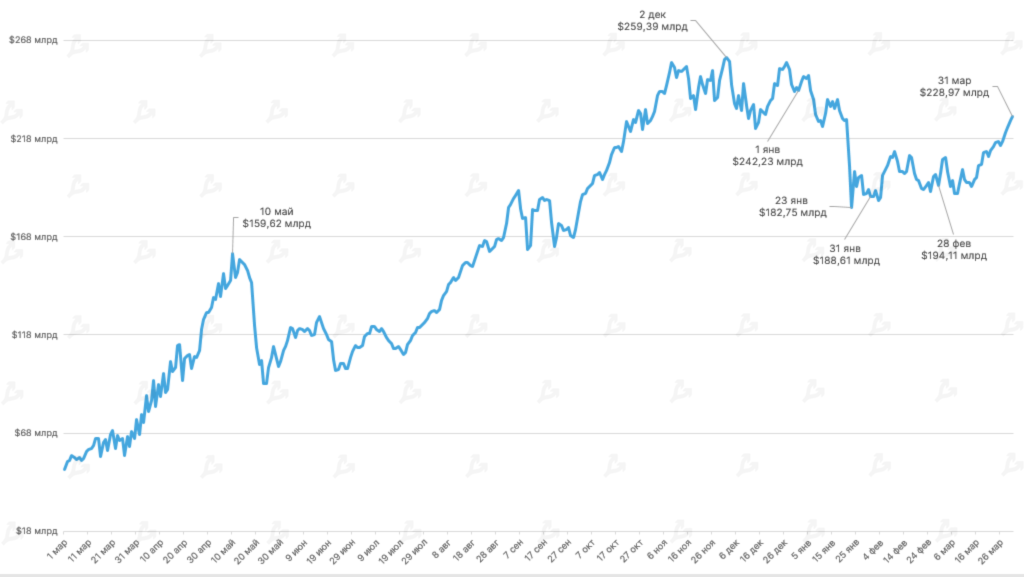
Stablecoins
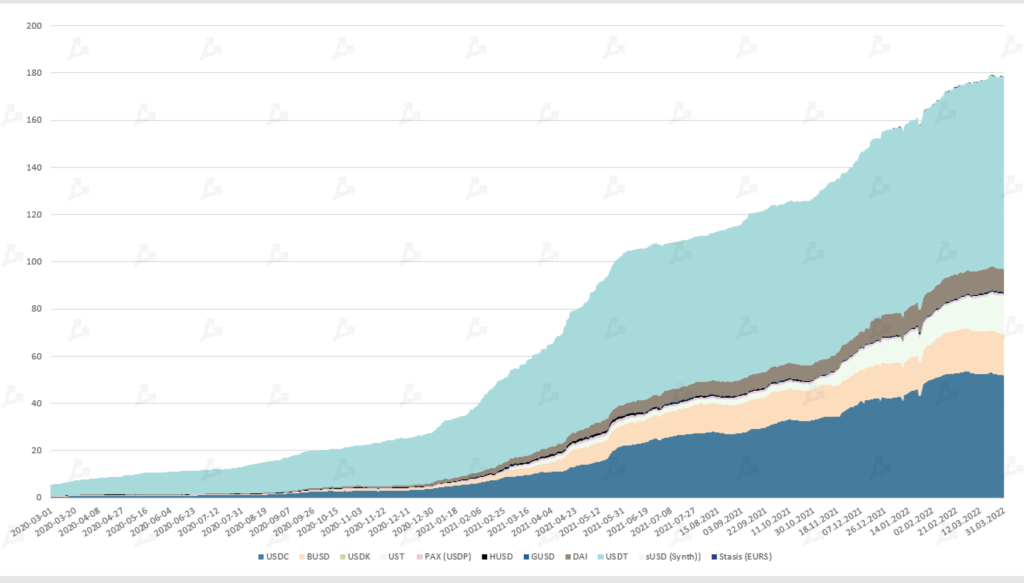
- Stablecoins’ market capitalization in March reached $178 billion.
- Unchanged leader in the segment — Tether’s USDT — surpassed $80 billion. Emission of the second most popular stablecoin, USDC, slowed and, in mid-March, contracted to $51.5 billion at month-end.
- The Terra ecosystem’s algorithmic stablecoin, UST, saw its market cap surge in March from $13 billion to $16.3 billion. Active issuance affects LUNA burning rates, which is a necessary condition for UST issuance. This makes the asset deflationary and, in the long run, supportive of LUNA’s price above $100.
NFTs and GameFi
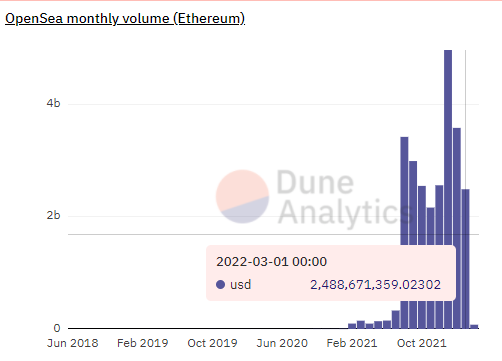
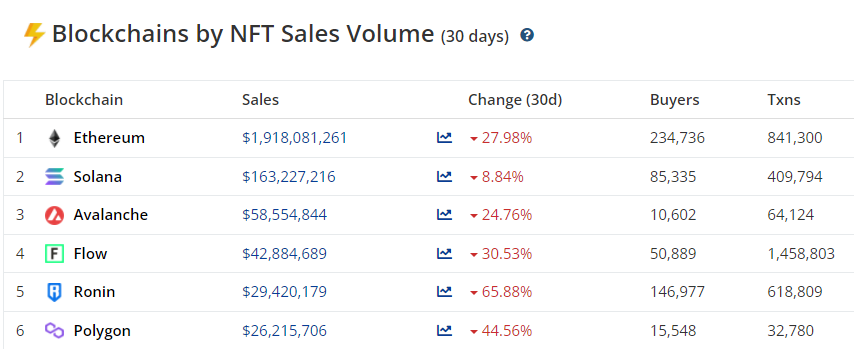
Interest in non-fungible tokens is waning. This is evidenced by Google searches for “NFT” retreating to levels seen in October last year, preceding the NFT and metaverse boom. These trends align with shrinking volumes on OpenSea and activity across blockchains.
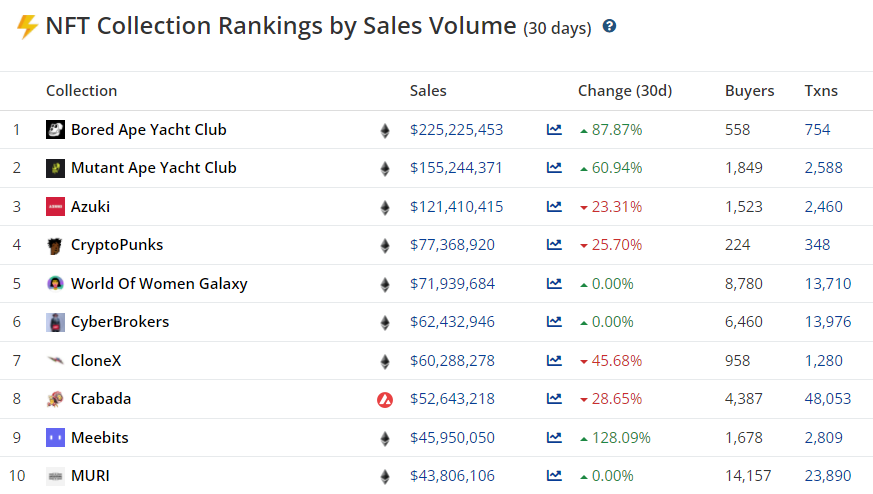
- Nevertheless, some collections posted a notable volume surge. The top-3 in March included Azuki, an anime-character NFT collection. In March a user sold one of the rare NFTs for 420 ETH.
- The surge in BAYC and Mutant Ape Yacht Club trades was driven by Yuga Labs’ launch of the governance token APE on March 16. 15% of the total 1 billion tokens were distributed via an airdrop to owners of the mentioned NFTs (as well as Bored Ape Kennel Club). The coin’s listing was promptly supported by major platforms. BAYC premium NFT holders received more than 10,000 APE. At market peak, its price exceeded $400,000.
Activity of Major Players
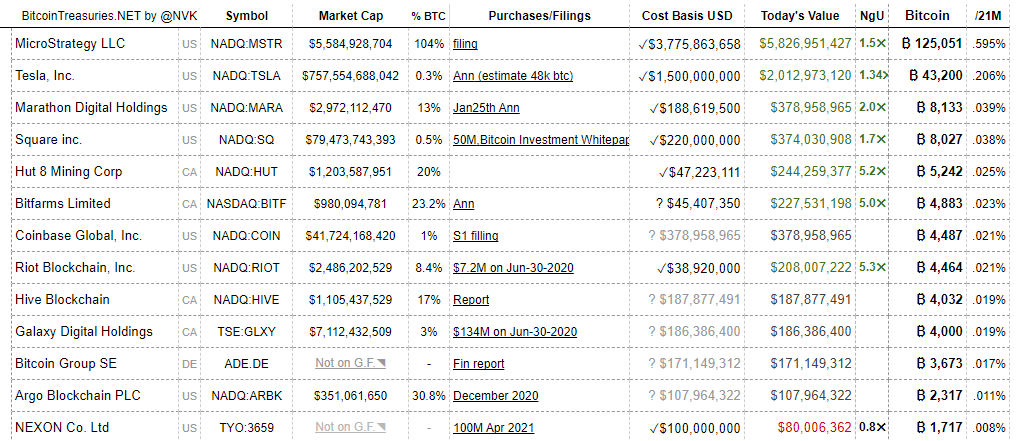
- Among public companies holding Bitcoin, MicroStrategy continues to lead by a wide margin. The value of Bitcoin on its balance stands at $5.82 billion as of 1.04.2022.
- In late March MicroStrategy’s MacroStrategy unit secured a $205 million loan backed by its crypto assets to purchase more Bitcoin.