


Recently, Bitcoin’s price has been rising faster than the number of active addresses. This is a sign of short-term market overheating and a likely correction, according to the on-chain metric Active Address Sentiment Indicator (AASI).
The chart below shows the yellow line crossing the upper boundary of the range for changes in the number of active addresses (the red dashed line).


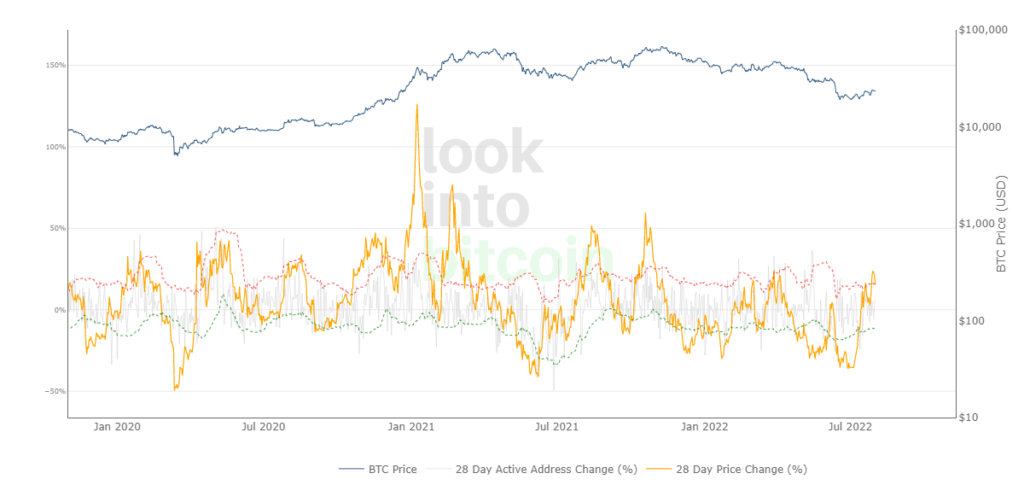
That is, according to the indicator’s description, a sign of short-term market overheating.
“In extreme market conditions, the 28-day price change (orange line) aggressively breaches the red and green dashed lines. This usually occurs during a market crash or in the final stages of a bull cycle,” explains LookIntoBitcoin on its site.
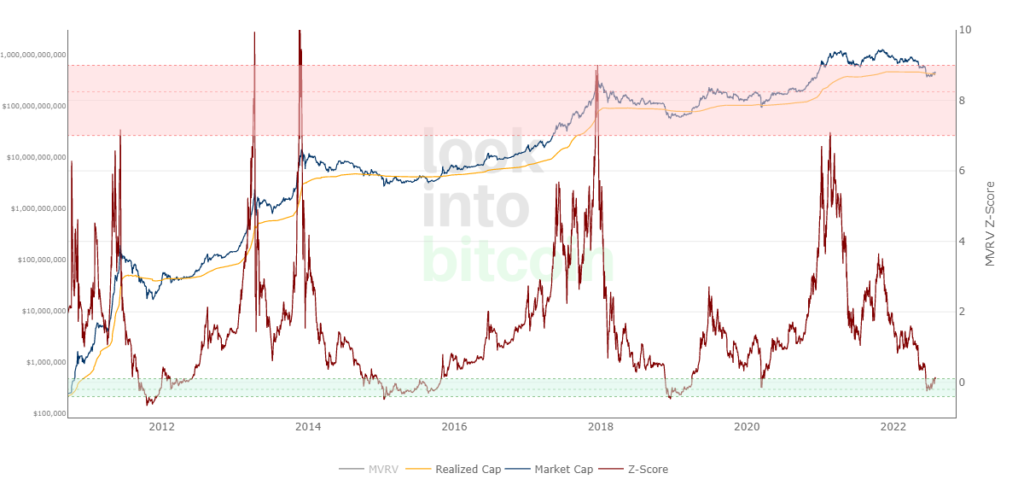
In contrast, the long-term oriented indicator MVRV Z-Score crossed the upper boundary of the deeply oversold zone at 0.1. This signals a probable bottoming of the market cycle.
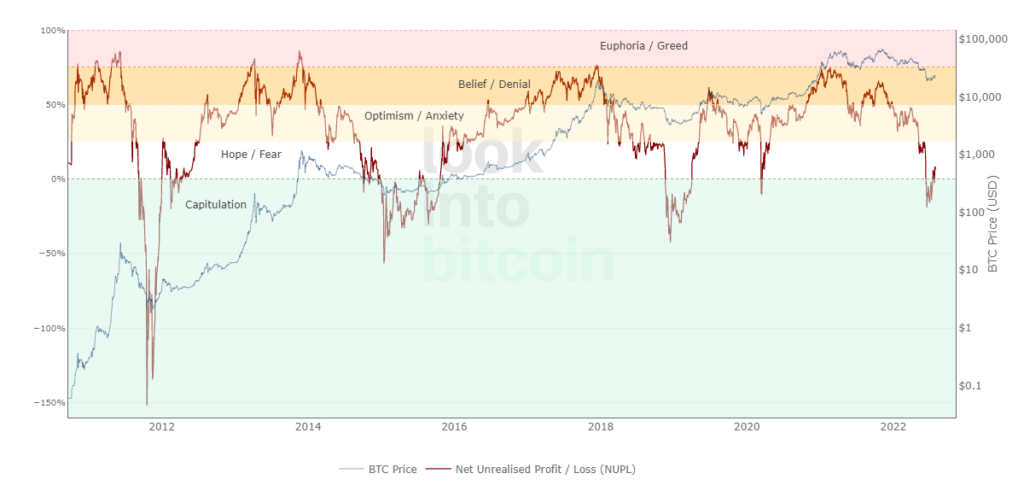
The sentiment among investors is also signalled to be improving by the Net Unrealized Profit/Loss metric (NUPL). The indicator has moved into the ‘hope/fear’ zone, heading toward ‘optimism’.
At the time of writing, Bitcoin trades around $22,770. Over the past 24 hours, the cryptocurrency price has fallen by 2.4%, according to CoinGecko.
Earlier, Glassnode concluded that a reversal in Bitcoin’s price would take some time.
Follow ForkLog’s Bitcoin news on our Telegram — crypto news, prices and analysis.