


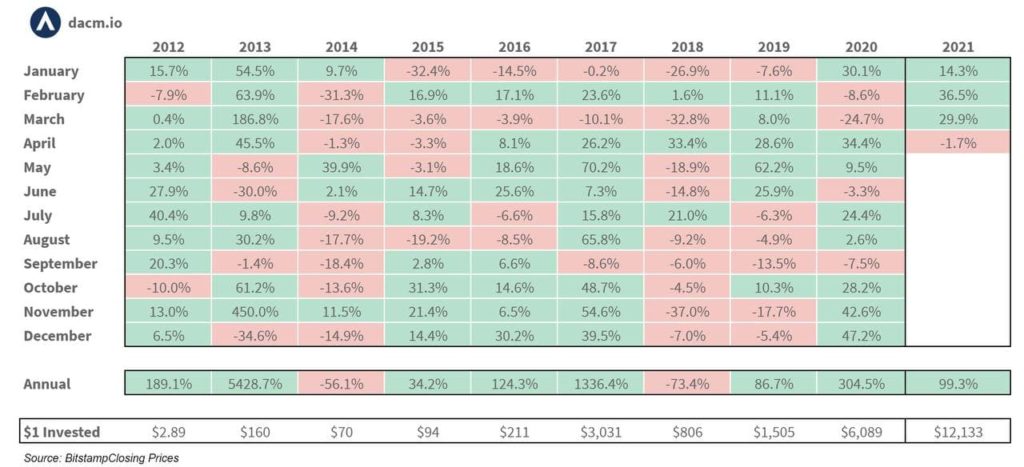
Only twice was it worse: Bitcoin fell 34.5% in May
May 2021 proved to be the third-largest percentage drop in Bitcoin’s price in the history of the premier cryptocurrency. BTC closed the past month down 34.5% at $37,340. In November 2018 the price of digital gold fell 37%, and in September 2011 by 40%.
The second-largest cryptocurrency by market capitalization demonstrated an unprecedented swing in price quotes ($1,730-$4,380). By the end of May, Ethereum was at $2,710, 2.5% below the April close. The long-running streak of rising monthly closes since October 2020 was broken.
Gold over the same period rose by 7.6% — the largest monthly gain since July 2020. Values of the S&P 500 index changed only marginally.
Bitcoin came under active selling amid Tesla’s announcement of halting cryptocurrency payments and new measures by Chinese authorities to curb illicit mining. The efforts of US regulators to set new “rules of the game” for the industry also played a role.
During the week of the correction’s acute phase, the total losses of Bitcoin holders exceeded historical levels.
Glassnode analysts determined that the exchanges received 1.2 million BTC with a loss of 5-25% since purchase and 120,000 BTC with a -25% return.
Because Ethereum’s pace outpaced digital gold, there were relatively few coins in the second category. The amount of ETH sold at a loss of 5-25% amounted to 22.5 million.
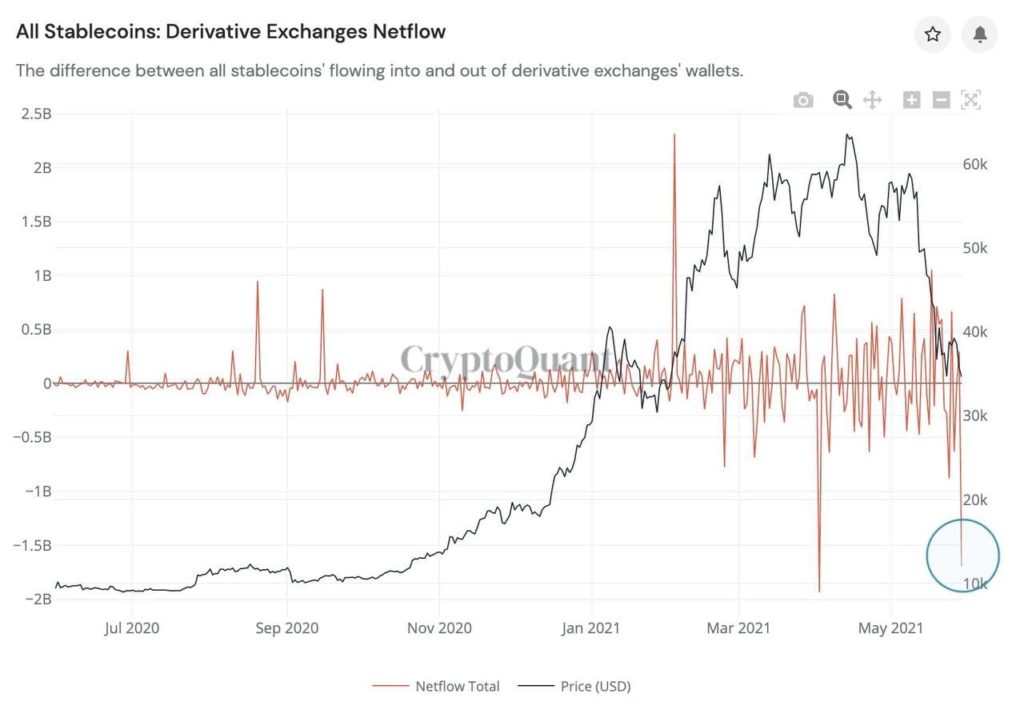
During the subsequent consolidation, investors withdrew $1.69 billion from derivative platforms — one of the largest volumes in 2021.
Analyst Lex Moskovski предположил that market participants plan to allocate capital more efficiently in another segment (perhaps spot), anticipating a short-term decline.
Analysts at Glassnode found that the May market crash triggered panicked selling by newly joined investors who bought coins during the bullish phase in Q1.
The #Bitcoin market consolidates after selling-off last week, as investors demonstrate unique spending behaviours on-chain.
We Assess
— Market pain points
— Spending patterns on-chain
— Analysis of sellers and hodlersRead more in The Week On-chainhttps://t.co/BJhhRNzKKx
— glassnode (@glassnode) May 31, 2021
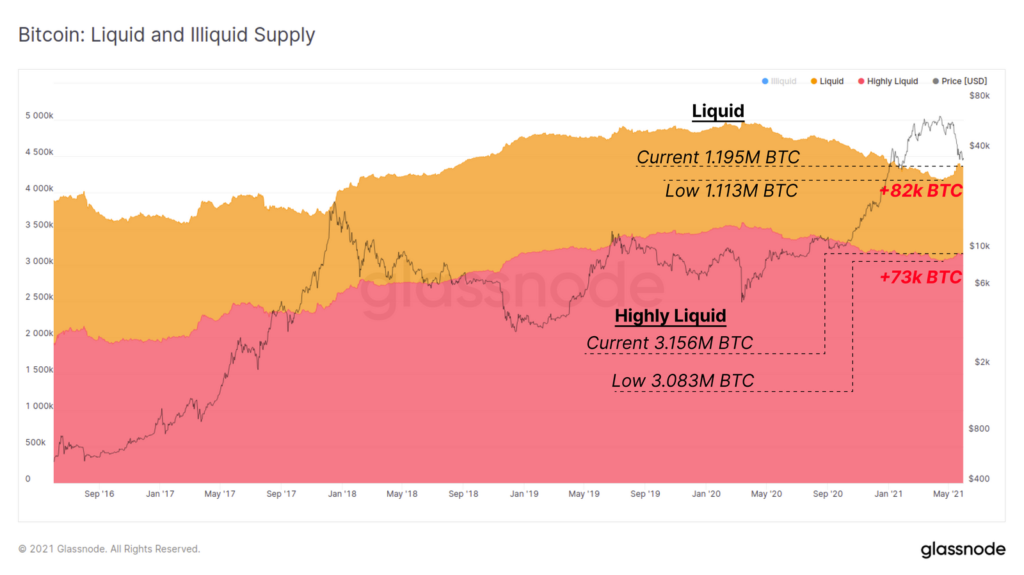
During May, a total of 155,000 BTC moved from wallets into the ‘liquid’ and ‘most liquid’ states (category had accumulated 58% of coins in circulation; this figure is assigned based on the cumulative inflows/outflows of coins at a given address), providing a supply overhang. This figure includes coins held by both short-term and long-term holders.
Comparing the on-chain cost basis relative to purchase price, analysts arrived at the following conclusions:
- Sales in recent weeks did not affect the spending dynamics of long-term investors. The “volatility” of the metric actually declined. This indicates that “hodlers” generally do not wish to liquidate coins at depressed prices;
- Short-term holders increased spending by more than five times. Peak spending occurred near the current local market bottom of around $30,000.
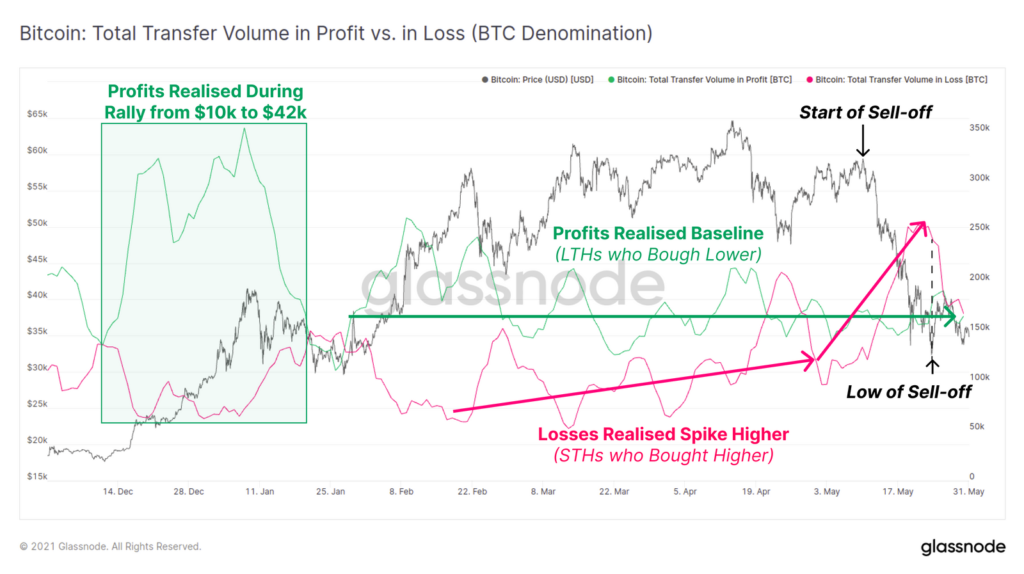
Analyzing the balances of various market participants, analysts noted that short-term investors sold a substantial amount of Bitcoin. At the same time, miners and long-term “hodlers” continued to accumulate on wallets.
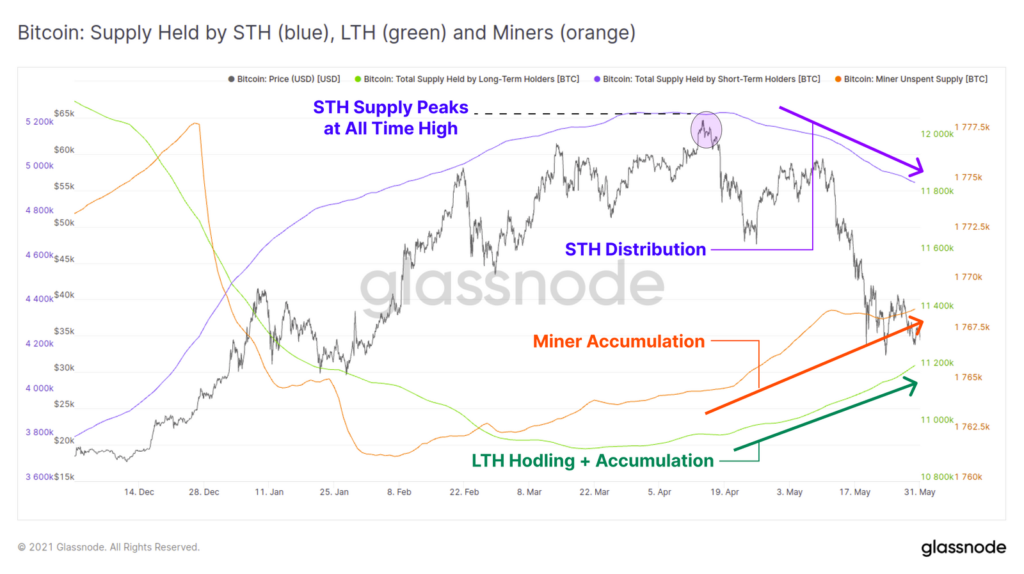
In May, Glassnode analysts counted that by the end of the correction hodlers had accumulated 58% of coins in circulation. In January 2018, this figure stood at 50%.
For expert opinions on the latest correction, read ForkLog article.
Subscribe to ForkLog news on Facebook!
Рассылки ForkLog: держите руку на пульсе биткоин-индустрии!