


Key points
- The Stock-to-Flow model estimates bitcoin’s price from the stock-to-flow ratio (SF). Its creator, the pseudonymous analyst PlanB, adapted it from his calculations for precious metals such as silver and gold.
- At its core, Stock-to-Flow argues that a good’s price rises as scarcity increases, driven by a higher stock-to-flow ratio.
- Experts criticise Stock-to-Flow for faulty calculations on the reference assets that underpin its forecast that bitcoin’s price will rise as halving makes it scarcer.
Who proposed the Stock-to-Flow model, and when?
The model was proposed by the anonymous analyst PlanB in a 2019 article, Modeling Bitcoin Value with Scarcity.
He says he was an institutional investor with 25 years’ experience and previously worked in finance and law. PlanB’s interests include investment strategies and on-chain analysis. In another publication he mentions managing multibillion-dollar assets. His identity remains unknown.
How does the Stock-to-Flow model work?
The model draws on an idea from Nick Szabo: precious metals and collectibles are persistently scarce because they are costly to produce. PlanB applied this approach to bitcoin.
For any asset, SF is calculated as the ratio of existing stock to annual flow. It is the inverse of supply growth. Stock is the total reserves; flow is yearly production or mining.
Consumables, base metals and consumer goods have low stock-to-flow ratios, while rarer items and precious metals have high ones.
Goods with low SF are not scarce: if their prices rise, producers can ramp up output and erase shortages. For scarce goods, boosting production is difficult or costly.
The author applies the concept to gold and silver, whose annual production then amounted to 1.6% and 4.5% of existing stock. Rising demand would therefore lift prices, since production cannot be expanded enough to meet it.
At publication, bitcoin’s outstanding supply was 17.5m, with annual flow from mining of 0.7m. The first cryptocurrency’s SF was 25. Flow is set by the block reward. It started at 50 bitcoin per block and halves every 210,000 blocks, or roughly every four years. This event is called halving.
Cutting the block reward determines flow and SF. PlanB computed monthly SF values for bitcoin from December 2009 to February 2019, producing 111 data points.


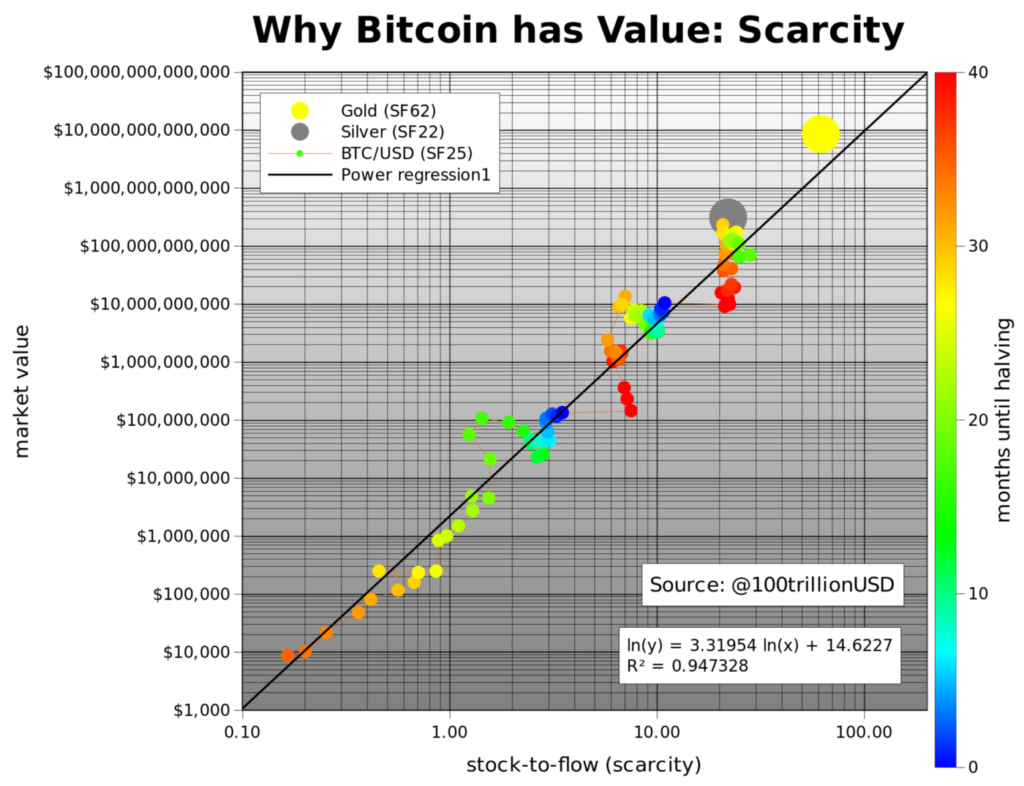
The chart uses a logarithmic scale to show values from $10,000 to $100bn. Time to the next halving is indicated by a colour gradient: dark blue marks the halving month; red the month after.
Based on the model, PlanB forecast that bitcoin’s market capitalisation would reach $1trn after the 2020 halving, with its price exceeding $55,000.
How do phase transitions complement Stock-to-Flow?
The author supplemented Stock-to-Flow with the concept of phase transitions, which abstracts from time. Substances undergo transformations that give them new properties—water, for instance, has four phases: solid, liquid, gas and plasma.
The US dollar has also undergone transitions: gold coin; gold-backed banknote; unbacked banknote. Its properties differed markedly across phases.
PlanB applied the concept to bitcoin. He compares bitcoin with water and the US dollar, which have different properties in each phase. Bitcoin’s perception and use cases changed over time.
Attitudes toward bitcoin shifted gradually, but PlanB distinguishes four phases:
- Proof of concept. This phase began with publication of the whitepaper and the network’s launch.
- Medium of exchange. It started when bitcoin crossed $1, after which it was gradually adopted as an online payment method.
- Digital gold. After the first halving, bitcoin’s price approached that of an ounce of gold, prompting a shift to phase three.
- Financial asset. Daily transaction volume exceeding $1bn after the second halving marked the move to phase four, characterised by wider adoption in the financial sector.
In another paper, PlanB identified four clusters on the Stock-to-Flow chart corresponding to these phases. His initial forecast envisaged a rise to $55,000.
When BTC’s SF equals that of gold, bitcoin would enter a fifth phase. He projected a price of $288,000 and a market value of $5.5trn, a scenario he suggested could play out by 2024.
How does the Stock-to-Flow Deflection indicator work?
A technical indicator, Stock-to-Flow Deflection, was later developed to show the ratio between bitcoin’s market price and its model-implied value. Values are calculated for the entire history of the cryptocurrency.
If Stock-to-Flow Deflection is below 1, bitcoin is undervalued. If it is above 1, a price decline is anticipated.
Some traders use the indicator: they buy when price is below the model value and open short positions when, per the indicator, bitcoin is overvalued.
Why is the Stock-to-Flow model criticised?
Several years after publication, the concept has not fully played out. Strix Leviathan’s chief investment officer, Nico Cordeiro, argues that Stock-to-Flow is fundamentally flawed because it uses arbitrary inputs for gold and silver in calculating SF.
He suggests PlanB may have selected data to best fit the model, yielding a linear relationship in log coordinates for gold, silver and bitcoin. He points to a lack of any link between the dollar-denominated capitalisation of commodities and precious metals and their production growth.
Cordeiro calculated gold’s SF over the past 115 years and found no relationship between its market value and SF. The value of all gold reserves ranged from $60bn to $9trn while SF stayed almost constant at around 60.
His study notes that gold’s price has risen mainly when the US dollar’s purchasing power has fallen. Since 1915, inflation has reduced the dollar’s value by 25 times, which explains gold’s appreciation.
According to Cordeiro, Stock-to-Flow is built entirely on historical data. As an indication, its projections imply that by 2045 a single bitcoin would be worth more than $235bn.
Analysts at Huobi have also criticised the model, arguing that it ignores macroeconomic factors such as Federal Reserve policy normalisation and interest-rate increases.
What future for the Stock-to-Flow model?
PlanB did predict a rise in bitcoin’s price to $55,000 and later refined his model. While S2F has been proposed for assets beyond cryptocurrencies, most of them have low SF.
By 2022 many professional crypto analysts had stopped using Stock-to-Flow. Even Ethereum’s creator, Vitalik Buterin, joined the criticism, saying the model was performing poorly at the time. In his view, models that posit inevitable price appreciation are harmful.
Both the model’s author and its supporters agree that bitcoin’s exponential price ascent will end. PlanB concedes the model may become less relevant, yet still expects bitcoin to appreciate owing to undervaluation and scarcity.
Further reading
What is Bitcoin?
What is dollar-cost averaging?
What is a moving average and how is it used for cryptocurrencies?
What formats do Bitcoin addresses have?