Key
- Bitcoin hit a two-year low, once again failing to hold above $20,000.
- Market capitalisation slipped below $900 billion amid FTX’s bankruptcy.
- Users showed notable interest in decentralised exchanges and non-custodial wallets.
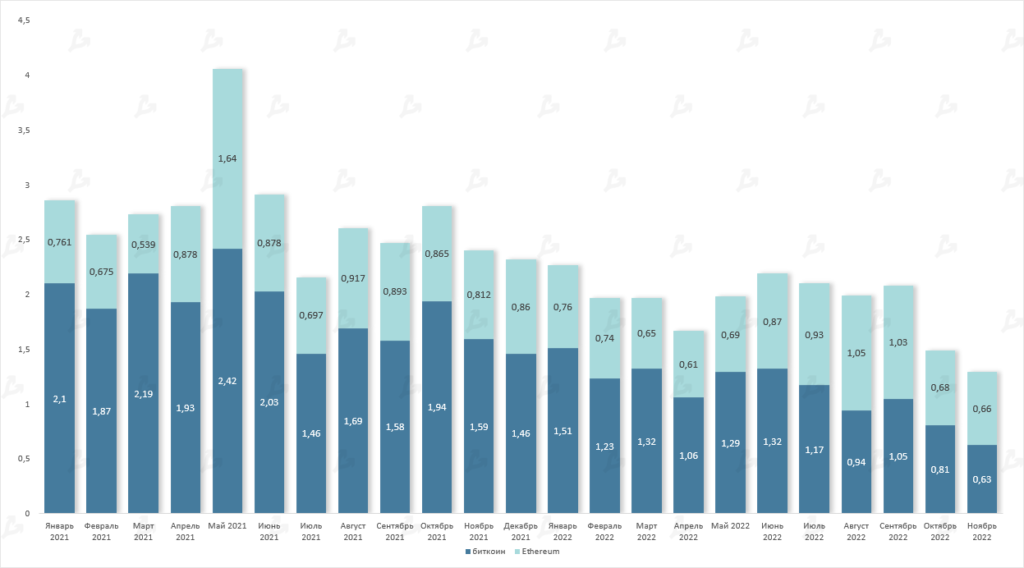
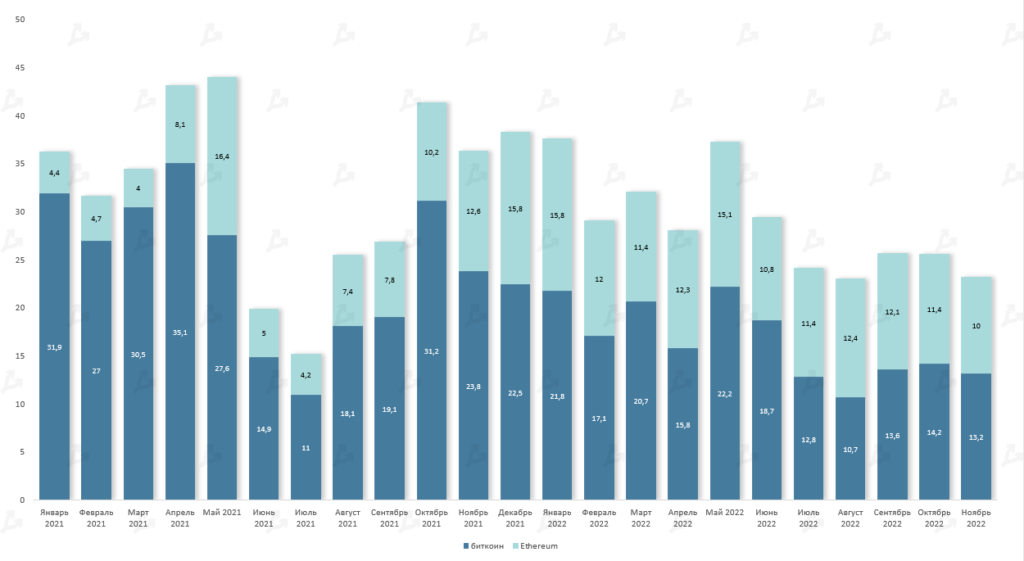
- Ethereum futures volume for the second time in history surpassed that of Bitcoin.
- Total ETH across centralised exchanges declined by 15%.
- November saw the fourth-largest capitulation by Bitcoin investors.
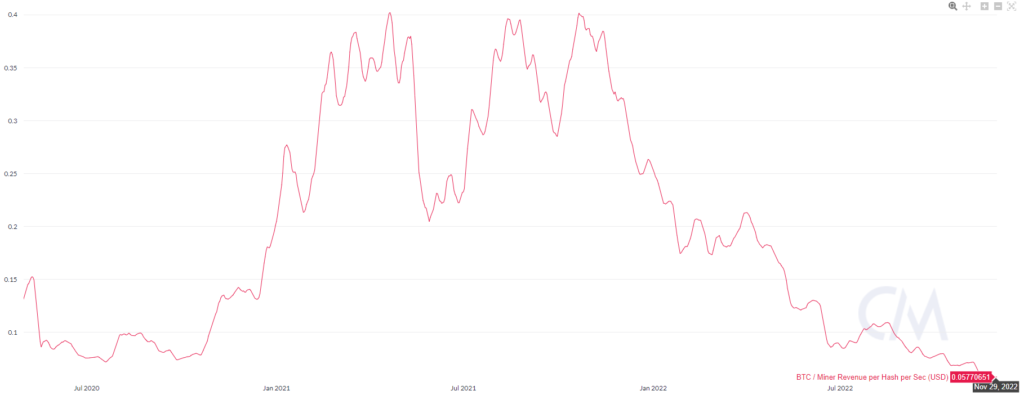
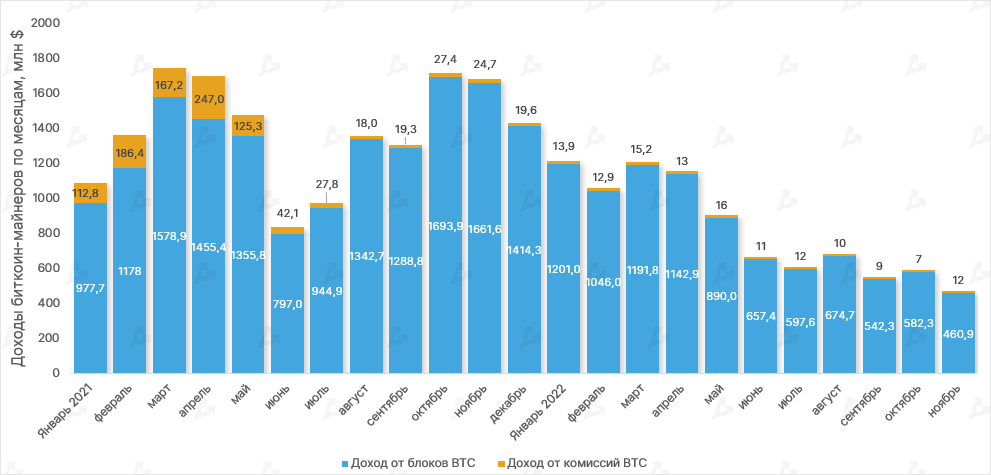
- The miner crisis worsened markedly — equipment is being shut down and crypto reserves are being sold.
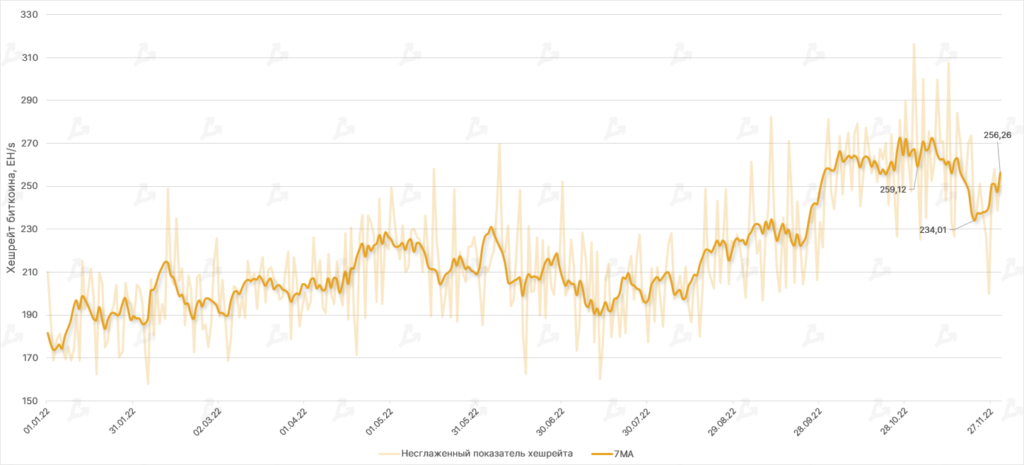
- Bitcoin mining output fell by 20% in November.
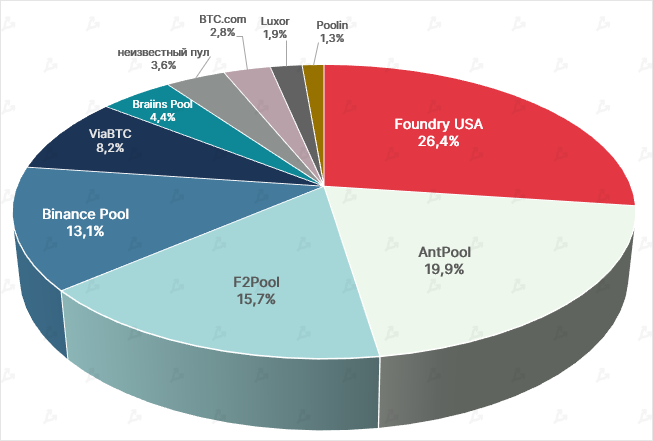
- Foundry USA’s share of Bitcoin’s hashrate rose above 26%.
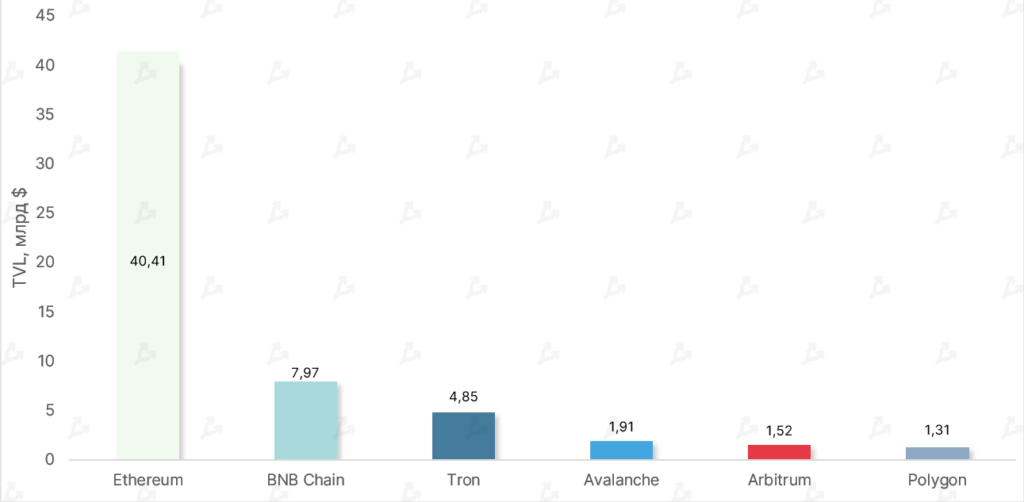
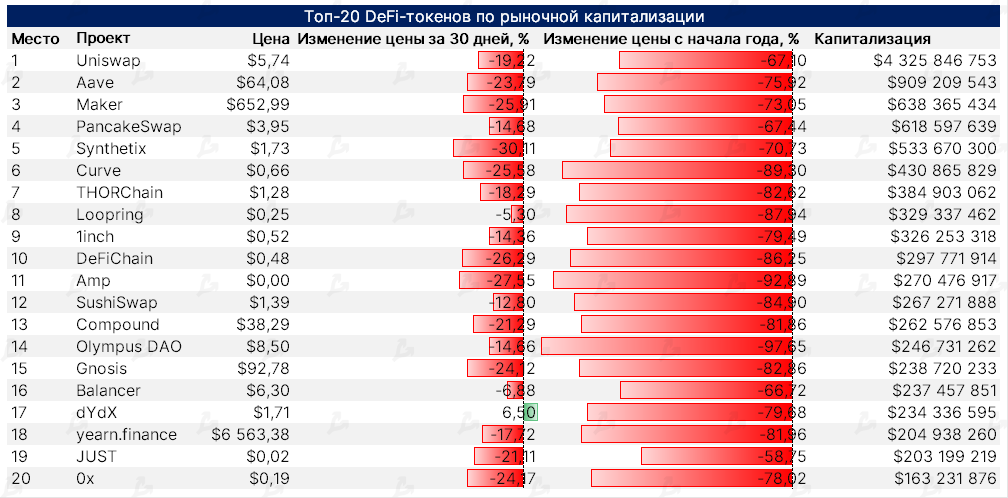
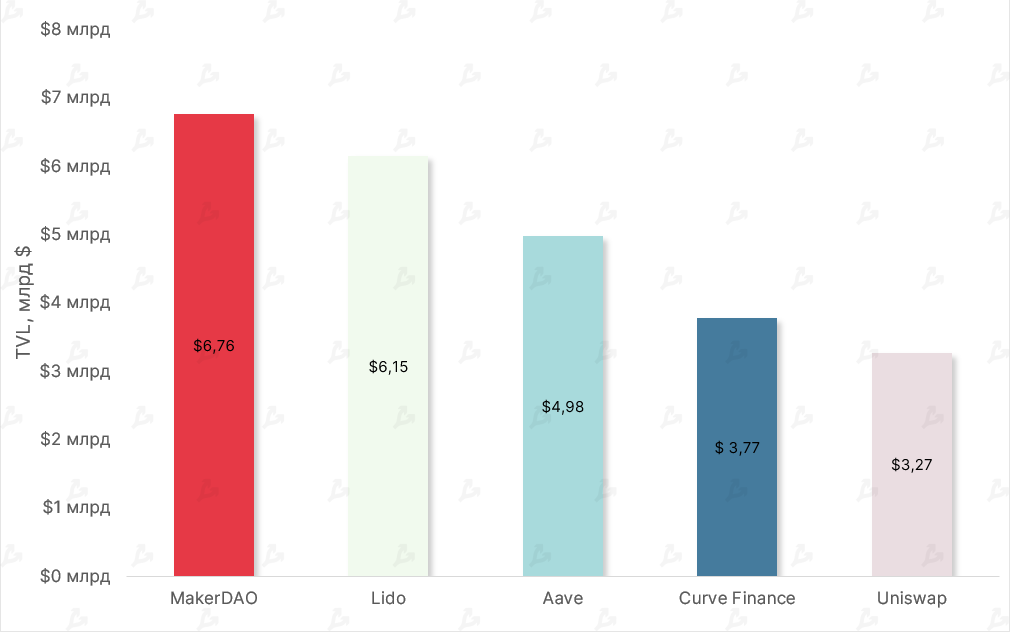
- TVL of DeFi apps fell 22%. Solana’s metric collapsed by 70%.
Chronicle of the FTX crash
6 NovemberBinance CEO Changpeng Zhao stated his intention to divest from the FTX Token (FTT), which together with BUSD totalled about $2.1 bln as the company exited its portfolio investment in FTX. Alameda Research CEO Caroline Ellison said she was prepared to buy FTT at $22 per unit.
8 NovemberFTT price fell sharply. Investors rushed to dump the utility token and other assets tied to FTX and Alameda (Solana, Serum). In the evening, FTX founder Sam Bankman-Fried reassured that user funds were safe despite withdrawal complaints. It later emerged that $6 bln had been withdrawn from the platform within 72 hours. Binance CEO Changpeng Zhao announced that FTX had approached the firm for help and that a potential takeover was being discussed. Bitcoin price dropped to about $17,000.
9 NovemberCoin Metrics analysts named a possible cause of the FTX crisis — the exchange lent Alameda Research FTT worth $4.19 bln. In the evening Binance refused to acquire the exchange, citing significant balance discrepancies. FTT price fell below $2.50. Tron founder Justin Sun said that he and FTX are working on a rescue plan for the company.
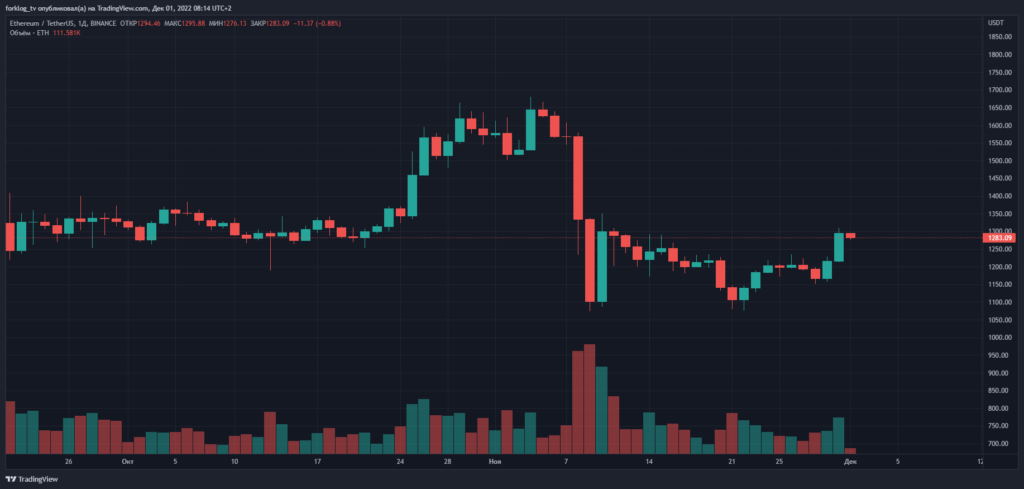
10 NovemberBitcoin tested the $16,000 level, and Ethereum fell below $1,100. In a joint decision with Justin Sun, a limited withdrawal of funds in TRX, JST, BTT and other Tron ecosystem assets became available.
11 NovemberFTX affiliates around the world began closing. The balance-sheet hole was estimated at $4–8 bln, while Bankman-Fried was seeking $10 bln. The company filed for bankruptcy. At the same time, unknown entities withdrawn more than $400 mln from FTX.
Dynamics of leading assets


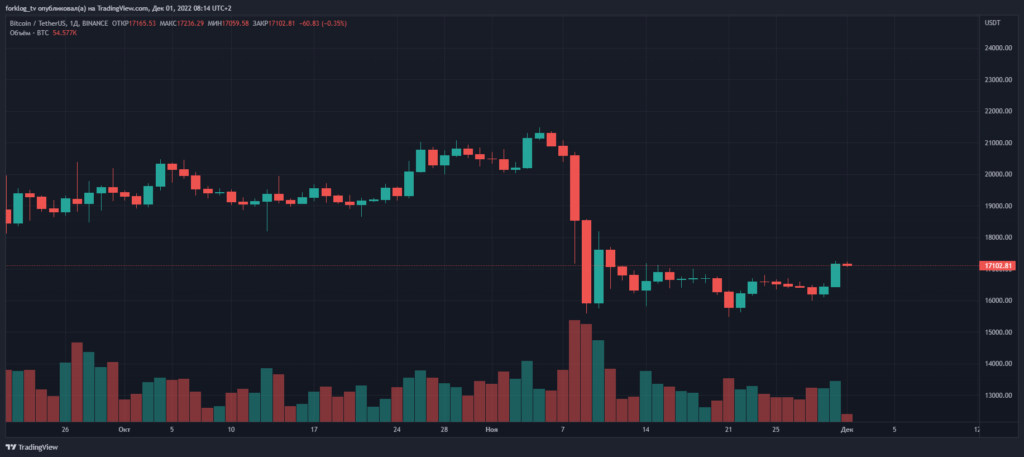


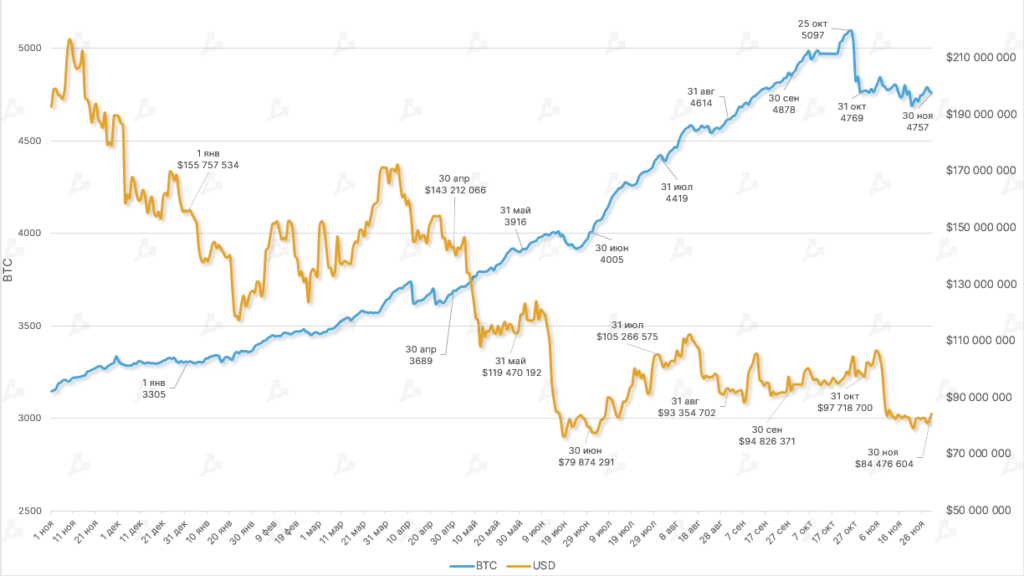
- Bitcoin reached a November low not seen since late 2020, briefly dipping below $20,000. For the month, it fell 16.2%. It has been exactly one year since Bitcoin established an all-time high of $69,000.
- Ethereum managed to hold the $1,000 level. It corrected by 17.6%.
- Total market capitalisation dipped below $1 trillion again, reaching $850 billion by December 1 (intraday below $800 billion).


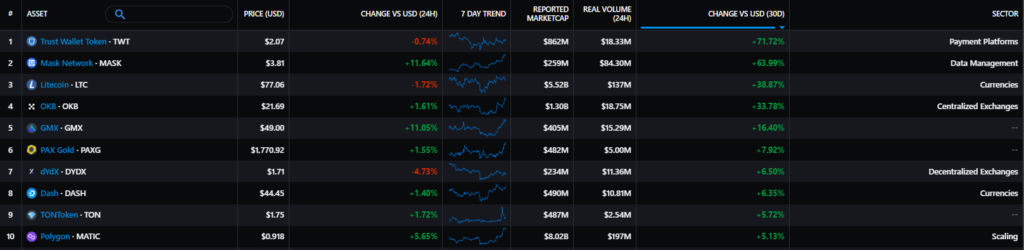


- Among mid-cap assets, Trust Wallet Token (TWT), Mask Network (MASK) and Litecoin (LTC) showed the strongest gains. TWT’s rise was driven by centralised exchanges’ attention to non-custodial wallets amid the FTX crisis and other players. Early in the month, MASK from the Mask Network protocol entered the Binance Bluebirds index. The project is a browser extension enabling encrypted messaging, crypto transfers, and other Web3 operations without leaving social networks. The community speculated about integrating the token with Twitter, given its surname match with the platform’s new owner — Elon Musk. LTC’s rise was linked to the forthcoming halving in eight months.
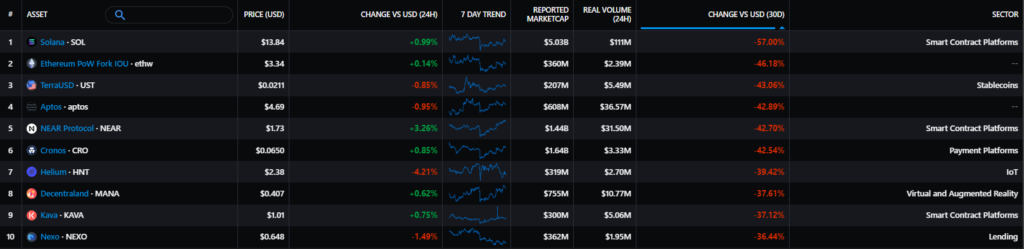
- Among the underperformers were projects backed by FTX and Alameda Research — Solana (SOL), Aptos (APT), Near Protocol (NEAR). With rumours of trouble at another US platform — Crypto.com — its CRO token also fell.
Equities of crypto-related companies
Mining-equipment firms’ stock performance
The crypto-linked company crisis and the public miners became more visible — all ForkLog-tracked structures posted double-digit losses in November. Miners’ troubles are exacerbated not only by falling crypto prices but also by macroeconomic factors, forcing them to offload equipment at steep discounts.
After Core Scientific faced bankruptcy threats last month, and Compute North filed for bankruptcy, Iris Energy joined the list. After notice of default, the company was forced to power down part of its equipment. Canaan’s quarterly profit plunged by 90%.
But not all was bleak. Foundry Digital entered into an agreement to buy two Compute North mining facilities, and Riot Blockchain and Marathon Digital reduced quarterly losses.
Macro backdrop


- Headline CPI in the US in October slowed from 8.2% to 7.7%, with core CPI easing from 6.6% to 6.3%. This was better than expectations of 7% and 6.5%, respectively.
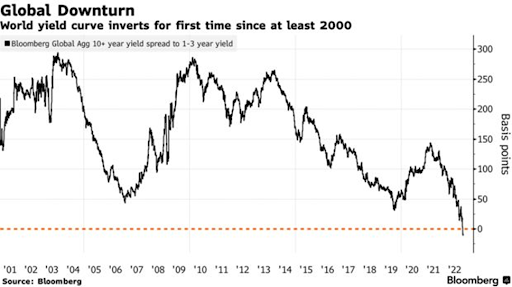
- For the first time since data collection began in 2000, Bloomberg Global Government Bond index components formed an inverted yield curve. This signal points to a coming recession in the global economy.
- FTX collapse sparked a wave of deleveraging and bankruptcies, erasing the price correlation between digital assets and the stock market. The stock market, supported by expectations of a softer monetary-policy path, nearly recovered August–September losses (as shown by the S&P 500).
Market moods, correlations and volatility


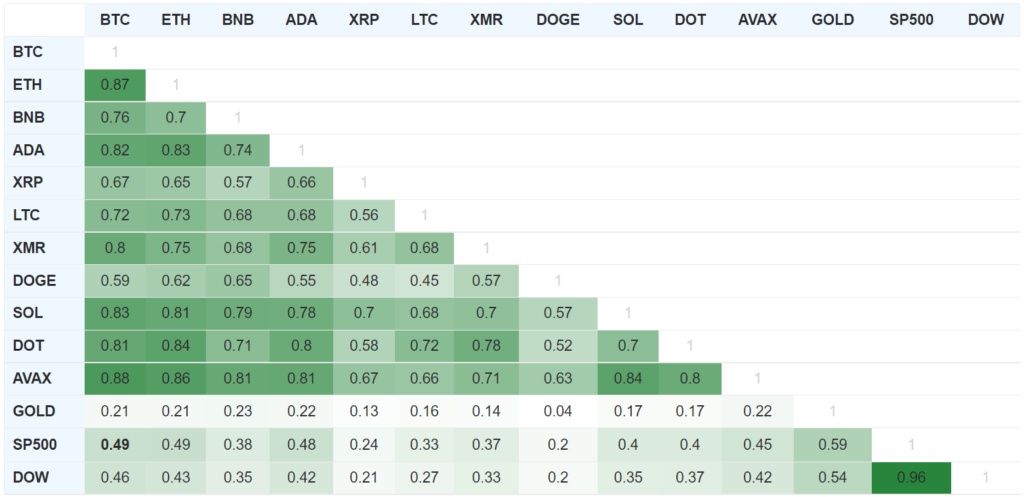


- Despite the FTX collapse, the statistical correlation of Bitcoin with the US equity market changed little in November. The 90-day moving average stood at 0.49 for the S&P 500 and 0.46 for the Dow (vs 0.54 and 0.47 in October).
- Such dynamics suggest macro factors continue to have significant influence on digital assets.
- The correlation of Bitcoin with gold continues to rise (0.21 vs 0.19 in October). By comparison, in November 2021 the figure stood at 0.02.
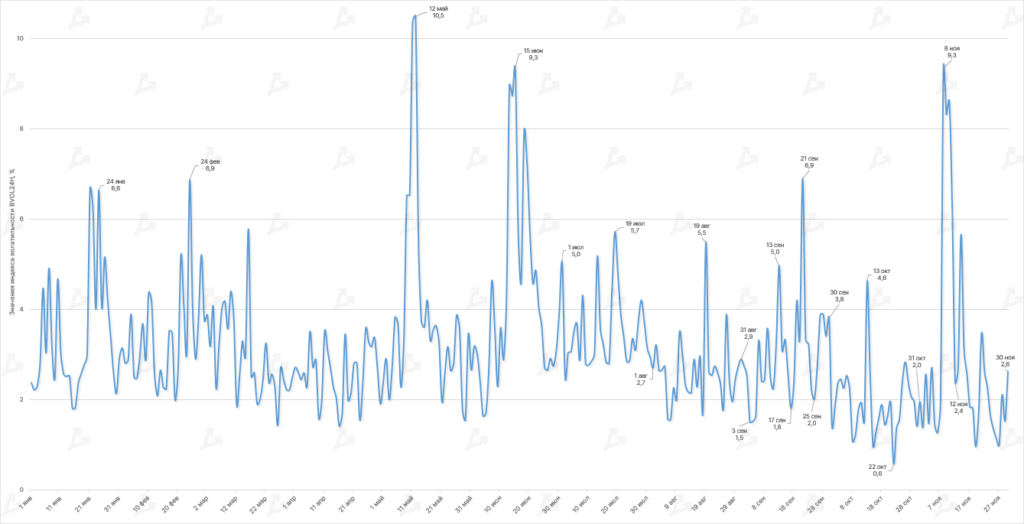
- The average value of the Bitcoin intraday volatility index (BVOL24H) was 2.9% (1.9% in October). At the peak the indicator reached June’s reading (9.3%). The extreme occurred on 8 November — precisely when much of the community learned of Sam Bankman-Fried’s companies’ problems.


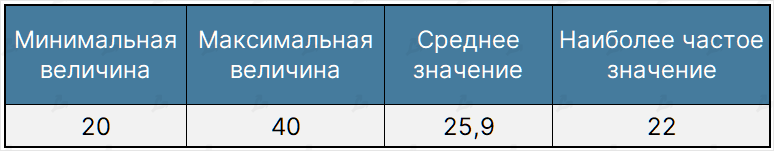
- In October, the Fear & Greed Index left the ‘extreme fear’ band, but in early November it returned to that zone. The average reading was 25.9 (24.4 a month earlier).
- FTX and Alameda Research problems undermined investors’ confidence in the digital-asset industry. Additional pressure comes from unstable macroeconomic and geopolitical conditions, as well as the US Federal Reserve’s tightening stance.
On-chain data


- Of all investor types, the aggregate realized losses stood at 56% of Bitcoin’s market cap. In prior bear cycles the figure also exceeded 50%.
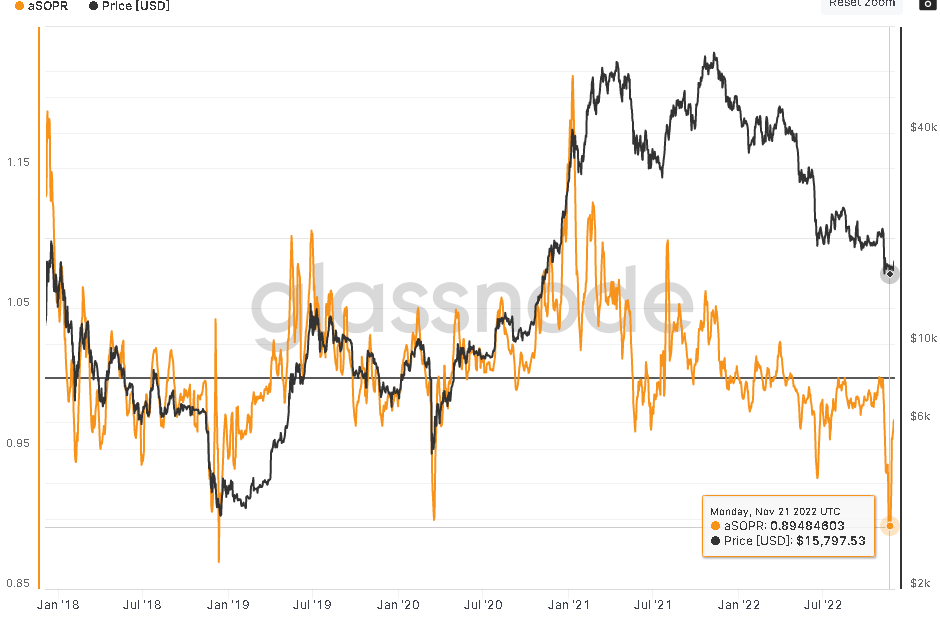
- The value of on-chain indicator aSOPR has fallen to December 2018 levels. Such lows indicate mass selling at a loss and market pessimism.
Ethereum


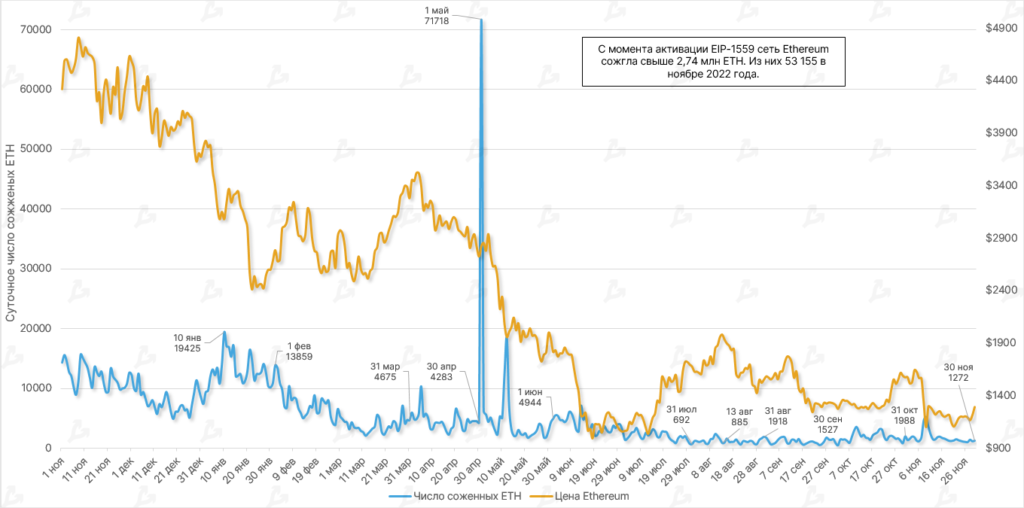


- Since the activation of EIP-1559, more than 2.74 mln ETH have been burned. In November 53,155 ETH were burnt (58,115 in October).
- According to Glassnode, since Ethereum’s shift to Proof-of-Stake, net issuance amounted to only 2,317 ETH. Of the validators, 131,464 ETH are staked, and 129,137 ETH were burnt.
- Ultrasound Money shows that in November the largest burner by number of burnt coins was the Uniswap v3 protocol — 4,493 ETH burnt for its activity.
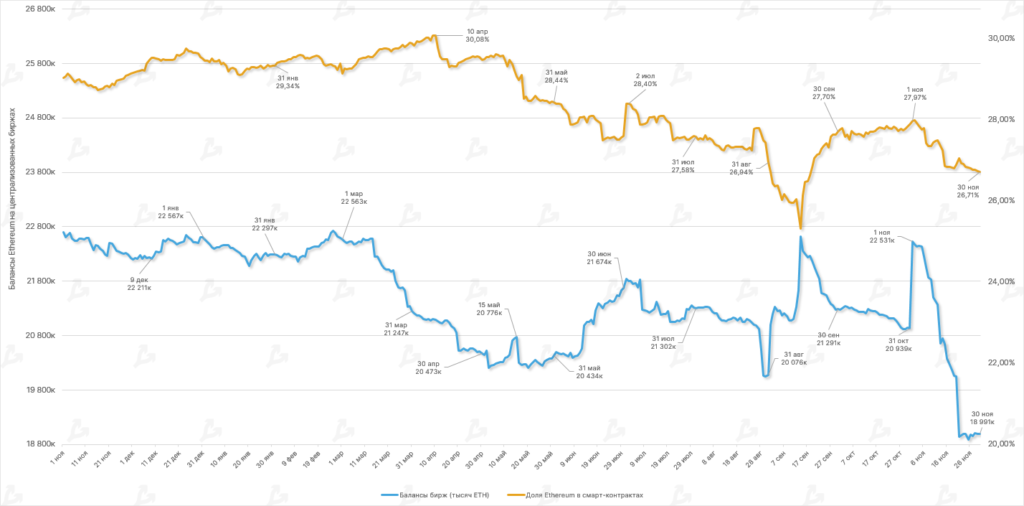
- Second place by this metric was user-to-user transactions (3,255 ETH). The trend is connected, among other things, to Ethereum withdrawals from balances on centralised exchanges amid the FTX collapse.
- By end-November, total ETH on centralised-exchange wallets fell by 15% — more than 3.5 million ETH left.
- The share of ETH locked in DeFi smart contracts stood at 26.71% (27.97% in October).

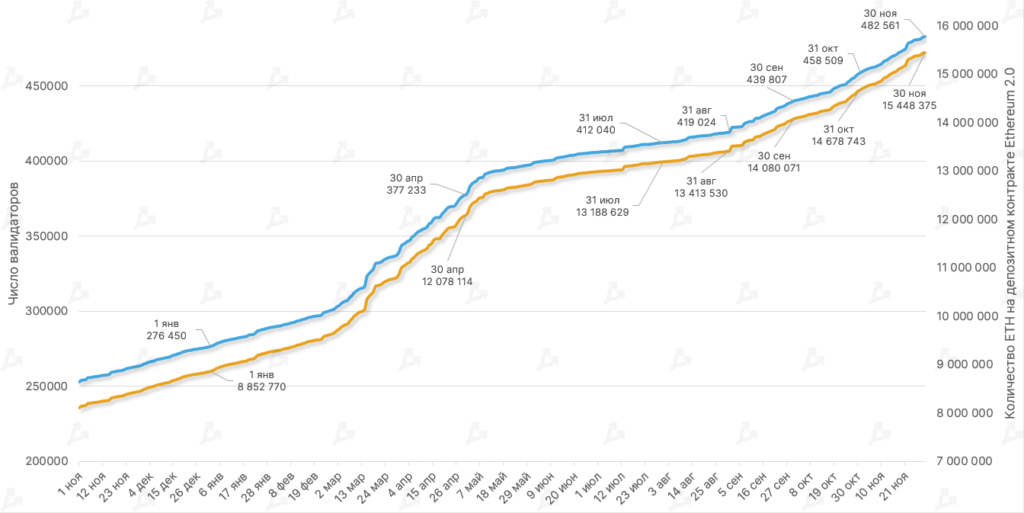
- By November, total ETH staked exceeded 15.44 million. The monthly rise was 5.2%, higher than October’s 4.25%.
- The number of unique ETH addresses staking 32 ETH or more reached 482,561. These wallets can validate transactions and earn rewards in the cryptocurrency.