

HODL or Earn? How Crypto Indexes Are Changing the Game
How crypto indices help in a bear market
Market gauges such as the Dow Jones Industrial Average (DJIA), devised more than a century ago, and the later S&P 500 remain relevant. They still serve as tools for macro assessments of market dynamics and offer a comprehensive approach to analysis.
Derivatives built on them for investment via institutional ETF vehicles and for trading crypto indices allow investors to assemble portfolios flexibly and balance exposures by sector and theme. Thanks to blockchain and programmable tokens, indices have gained new functionality and accessibility in Web3.
In this piece, ForkLog charts the rise and fall of the first aggregated equities, surveys crypto-index platforms, explores “NFT containers” for DIY portfolios, and looks at automated yield strategies for a bear market.
Newspaper arithmetic
Over the past decade the crypto market has changed markedly: patterns such as the four-year cycle and the liquidity rotation from bitcoin to Ethereum and then into smaller-cap assets no longer work.
Early in 2026, bitcoin joined the protracted decline in small-cap crypto assets. At that point, hunting for compelling projects demanded a different approach and deeper knowledge of market behaviour and instruments—among them indicators from traditional finance created more than a century ago.
In the late 19th century, employees of Dow Jones & Company realised they were spending too much time compiling daily exchange reports on the prices of the largest companies’ shares.
In 1884 Charles Dow, a future co-founder of The Wall Street Journal, presented the Dow Jones Transportation Average, expressing the state of the railway sector—the backbone of that era’s economy.
In 1896, together with Edward Jones, he released the expanded industrial DJIA, an arithmetic average of the share prices of 12 leading enterprises. In 1928 the number rose to 30 blue chips, a standard that endures. The only firm in the basket from the start—General Electric—left in 2018, a symbol of the end of the industrial age.
After the DJIA strengthened the foundations of market analysis, the financial world recognised the need for more precise and diversified tools.
In 1950 the Nikkei 225 appeared. It became an emblem of Japan’s economic miracle and of the late-1980s bubble. It included 225 of the largest companies across more than 30 sectors of the economy.
In 1957 Standard & Poor’s launched the revolutionary S&P 500, representing all major sectors. Its key innovation was a methodology based on market capitalisation rather than share price. A capitalisation-weighted approach later became standard across popular benchmarks. Today the S&P 500 is the barometer of America’s stockmarket and a yardstick for most funds worldwide.
In 1971 the NASDAQ Composite (more than 3,000 organisations) arrived, largely capturing the fast-growing technology sector.
The 1980s brought the Russell 2000 to track small-caps, the “elite” NASDAQ 100 excluding banks and financials, as well as Germany’s DAX. Later, in 1998, the EU’s “basket of giants” under the EURO STOXX 50 ticker joined the list.

Until the 1970s indices were only guides—you could not buy them directly. In 1975 the entrepreneur John Bogle founded Vanguard and created the first index fund. Wall Street initially scoffed at the idea of “buying everything at once”, but later embraced institutional ETFs based on composite metrics, joined by derivatives built on futures and options. The first ETF—SPDR S&P 500—was launched in 1993.
Strategies and opportunities
Investors seeking diversification across industries and regions welcomed the new solutions. But many, as ever, were undone by shortsighted calculations in pursuit of returns.
It took the Nikkei 225 thirty-four years to top its 1989 record. At the peak many believed Japan would outrun America. A generation of buyers of the index ended up retiring with losses.
The NASDAQ during the dot-com bubble of the 2000s and the misreading of risks in mortgage derivatives during the 2008 crisis delivered bitter lessons. In both cases the figures carried into charting models did not reflect reality. Inflated metrics of unprofitable internet firms and artificially high ratings of mortgage-sector financial institutions triggered avalanches.
Today’s market offers ample warning signs tied to breakthrough technologies.
According to Slickcharts, on March 3, 2026, the combined weight of the ten largest S&P 500 companies was ~36.6%.

An AI-fuelled reading can create an illusion of healthy growth: if the giants hit trouble, the index will not be rescued by the vast majority of other constituents. According to Tema ETFs, in 2000, at the dot-com peak, the figure did not exceed 27.1%.

These tools let investors respond quickly at moments of high volatility. Consider the outbreak of hostilities in Iran.
On February 28, 2026, a joint US–Israeli military operation began against the leadership of the IRGC. Given that events were unfolding in a region of the world’s largest oil and gas output, analysts expected energy to rally even before markets opened on March 2.
Early in the week, in its response, the IRGC launched rockets and kamikaze drones at Gulf states. The world’s largest refinery, owned by Saudi Aramco, was among the targets. The company had to shut the plant entirely, materially affecting fuel supplies.

Given the closure of the Strait of Hormuz—a vital artery for transporting energy—stockmarket quotations reacted as expected. Leading equities declined, offset by gains in the US dollar and oil and gas.
In this situation indices spared traders the guesswork of which specific energy company might rally fastest in a supply squeeze, allowing them to choose a composite exposure instead.
Brent crude, produced offshore, is the base for much of the “black gold” shipped through the strait. Any news of shipping blockades or refinery strikes instantly lifts its price.

On March 3, 2026, Brent traded around $80–85, up 17% since the Middle East flare-up began. With Qatari LNG and Saudi plants halted, analysts predicted a push above $100 in the coming days.
Given these inputs, consider a hedging portfolio for a short-term investor built on March 2, 2026. Its delta neutrality is maintained by two equal halves for escalation and for a peaceful resolution.
A maximally simplified hypothetical portfolio to illustrate the method:
- if a peaceful settlement (50%). S&P 500, NASDAQ — 35% (rally on de-escalation and a return to tech); DAX, Nikkei — 10% (on a recovery in global logistics); bitcoin — 5%;
- if the conflict escalates (50%). Gold — 20%; Brent crude index — 15%; US dollar index (DXY) — 10% (strength amid perceived resolve and a shift toward US energy); bitcoin — 5%.
Such a mix would have yielded about 3.3%.
This example shows what indices can do. In practice, strategy design can take many forms and combine unlimited positions at custom weights. Rebalancing at preset thresholds would also play a key role in final results.
Crypto in play
By 2013 bitcoin had already caught the eye of TradFi. Early pioneers tried to graft traditional mechanics onto new digital assets. The first crypto index was CoinDesk’s Bitcoin Price Index (XBX), which appeared that same year.
When bitcoin was around $100, CoinDesk launched XBX to give the market a volume-weighted reference price sourced from several major venues of the time (Mt. Gox, Bitstamp and CampBX).
A year later the Gemini exchange’s co-founders, the Winklevoss brothers, introduced Winkdex (Winklevoss Bitcoin Index). It used a volume-weighting formula to shield quotes from manipulation on small exchanges and was aimed at professionals.
In May 2015 the NYSE Bitcoin Index (NYXBT) appeared, marking legal and psychological recognition of the asset. The exchange applied to bitcoin the same stringent standards it used for S&P 500 equities, prompting institutions to view crypto as a serious instrument.
A decade on, crypto indices have taken a different shape: with expanded functionality, they have become a pillar for Web3 enthusiasts.
CoinDesk 20 (CD20), launched in January 2024, answered funds’ demand for more than a coin list: a truly liquid, investable product. The model selects the largest assets using a strict filtering methodology.
A year later CoinMarketCap introduced CMC20 for investment. Unlike early versions, it is not merely a statistic but a fully tradable on-chain token. It is listed on DEX venues such as PancakeSwap and Aster.

CMC20 tracks the 20 largest cryptocurrencies, filtering out stablecoins and wrapped assets. Thanks to automatic monthly rebalancing via smart contracts, the token lets buyers own “the whole market” with one transaction.
In January 2026 ARK Invest founder Cathie Wood announced two index funds based on CD20. One will track CoinDesk 20; the other, delta-neutral, will pair long index futures with short bitcoin.
The trend has been embraced by firms that made such tools their calling card: Glider, Cryptoindex, Index Coop, GMCI, Phuture. They offer baskets of sector leaders: RWA, L1 networks, AI, DeFi and memecoins.
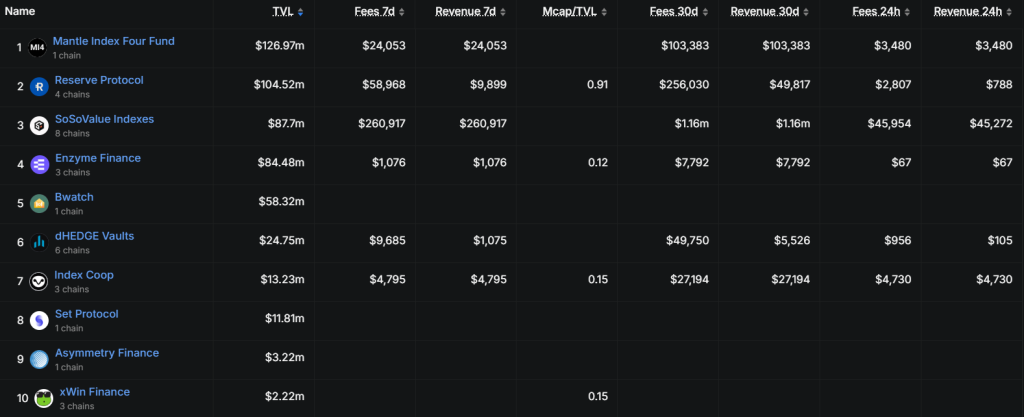
According to the platform’s dashboard SoSoValue, the most profitable aggregated solution was ssiCeFi, focused on exchange tokens (BNB, CRO, MNT, ASTER). At the time of writing, its annual return versus bitcoin was above 39%.

Given the negative market backdrop, the only asset in the green over the month was ssiRWA, which includes tokenisation-of-real-assets coins (SKY, ONDO, PENDLE). At the time of writing it was up about 4%.
Focused on institutions, Kaiko by 2026 had become an official benchmark administrator operating under EU standards. Its products prioritise liquidity and compliance. The main families include:
- “Blue chips” — Kaiko’s flagship gauges. They track the most reliable and largest assets passing strict filters. Kaiko 5 (KT5) — a conservative five-component basket (BTC, ETH and the three strongest altcoins); Kaiko 10 (KT10) — a direct rival to CoinDesk 20 but with tougher requirements for constituent exchanges; Kaiko 15 (KT15) — an expanded set for those seeking more mid-caps;
- thematic, specialised indices. One is the Kaiko Tokenization Index (KSTKNZ), which tracks RWA-related projects;
- regional indicators. Kaiko Eagle was created specifically for the US market’s ETF providers, counting only assets and venues fully aligned with American regulatory requirements.
Over the past year the best performer in the line-up was the Kaiko AI Index (KSAI). It outpaced bitcoin’s yearly move by about 18.3%.

A proliferation of new Web3 solutions helps not only to ride out a bear phase with gains but also to self-custody a whole set of assets in a single token as an NFT.
Wrapped NFTs (wNFTs) have turned what was once a narrow niche of digital pictures into dynamic “smart wallets”. They are the premier league of programmable finance, demanding deeper know-how but offering a high level of decentralisation and investment control.
Some protocols let users “wrap” into an NFT virtually any cryptocurrency—from BTC and Ethereum to their versions in staking—enabling secondary use of coins in DeFi mechanics.
For example, with the Envelop platform, a single wNFT can bundle an entire investment portfolio with time locks and the ability to transfer or sell it to others.
Another technology—vaults—allows assets in the container not just to sit idle but to earn yield.
Solv Protocol uses the semi-fungible token (SFT) standard ERC-3525 to create financial “vouchers” that represent complex positions in smart contracts.
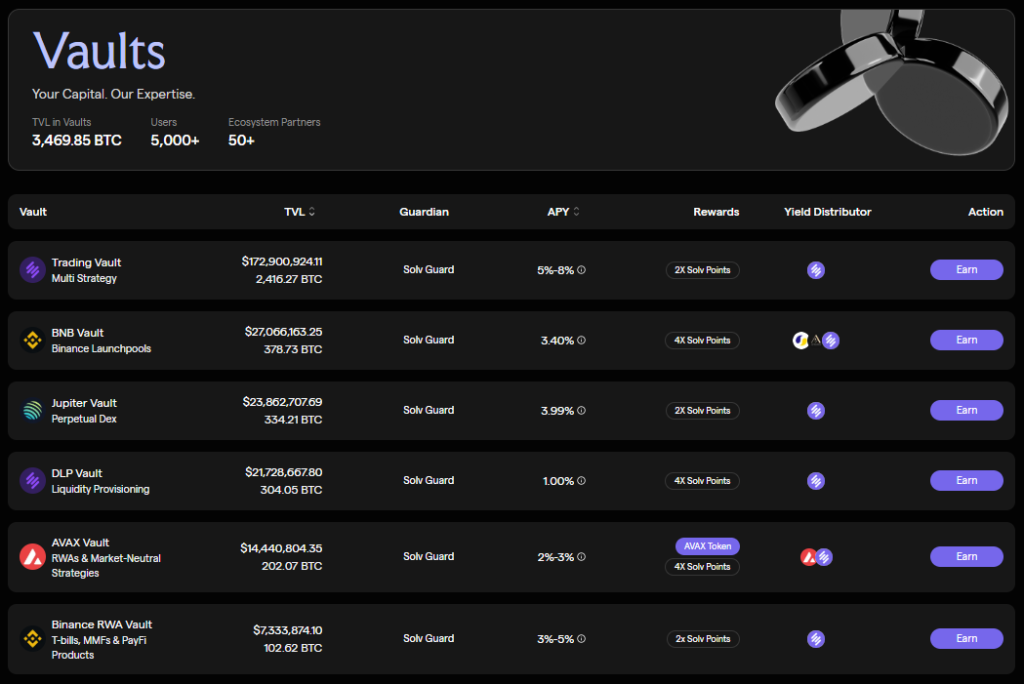
By depositing an asset such as BTC, users receive a liquid token in return that accrues yield in real time from a blend of sector strategies (staking, RWA). The programmed index can be resold together with the right to future income.
In 2026 crypto indices and programmable baskets of assets have evolved from simple analytical readings into a powerful shield against market turbulence. As old models stop working, aggregated instruments help hedge risk.
Using approaches proven over a century in equities, combined with the flexibility of Web3 protocols, lets investors avoid guessing on single coins and instead back entire sectors—from AI to RWA—preserving capital even in the red.
But technology does not guarantee success. The investor’s core task remains combining tried-and-true methods of analysis with risk management.
Рассылки ForkLog: держите руку на пульсе биткоин-индустрии!