

Trader outlines depth and duration of forthcoming Bitcoin correction
A practicing trader and founder of the Crypto Mentors project, Nikita Semov, explains the current market situation.
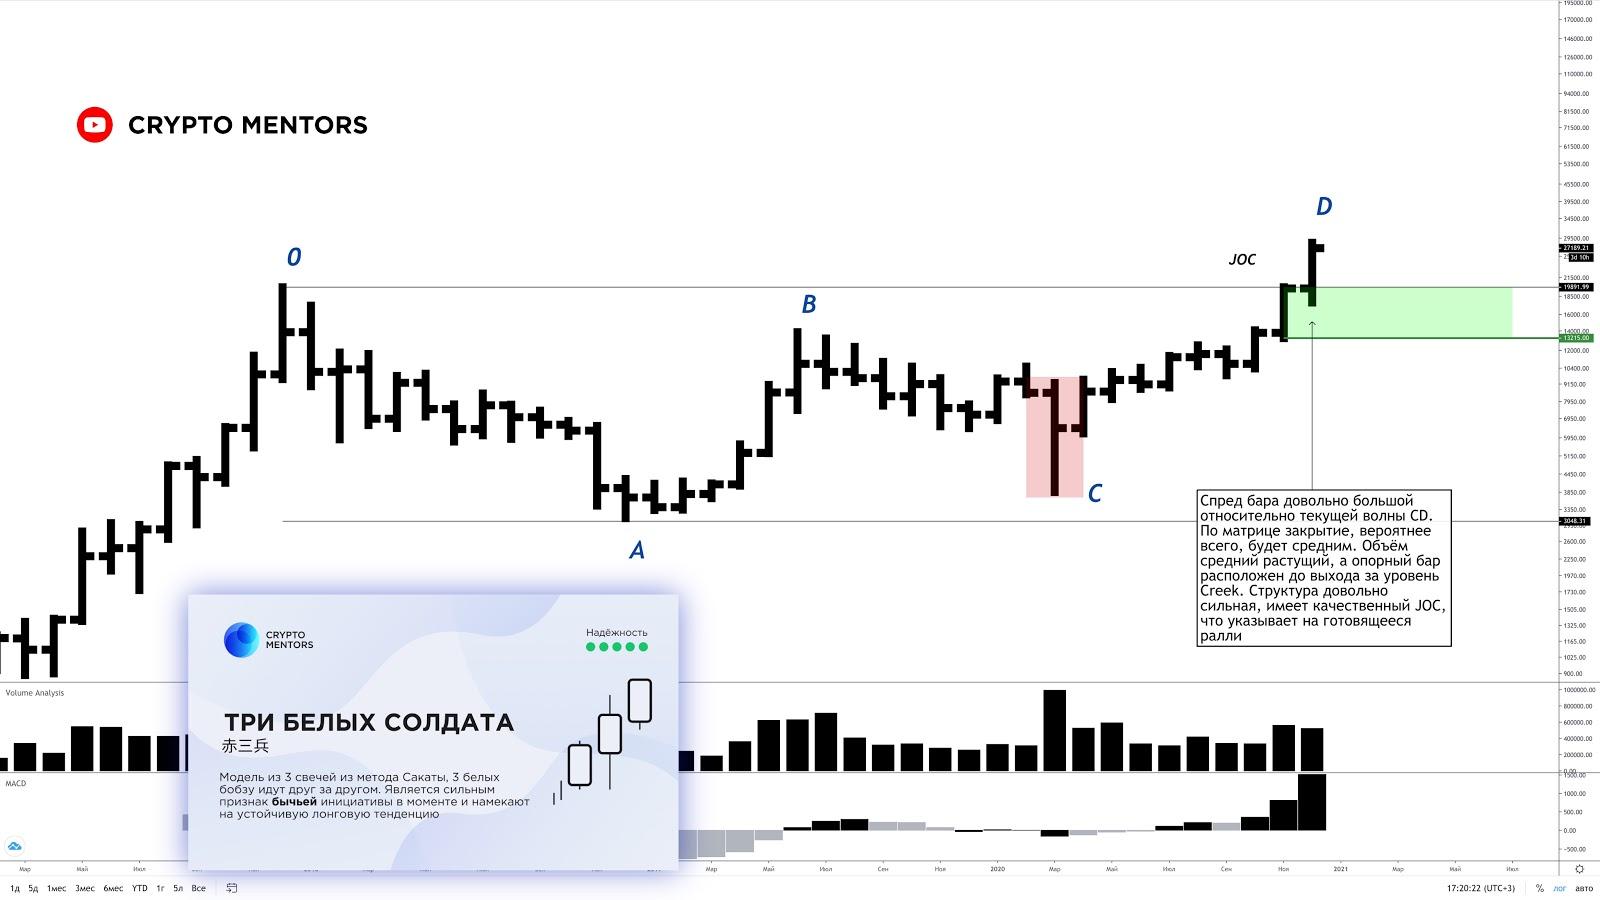
The final month of 2020 closes with a strong buying push, breaking a horizontal level. This signals significant demand dominance in the market.
The spread on the matrix for the current bar is large. Volume is decreasing, but follows after a support bar. A JOC pattern is forming according to VSA analysis.
In candlestick analysis, the pattern ‘three white soldiers’ is evident. There is a high probability that January will close with a buying bar.
Weekly time frame
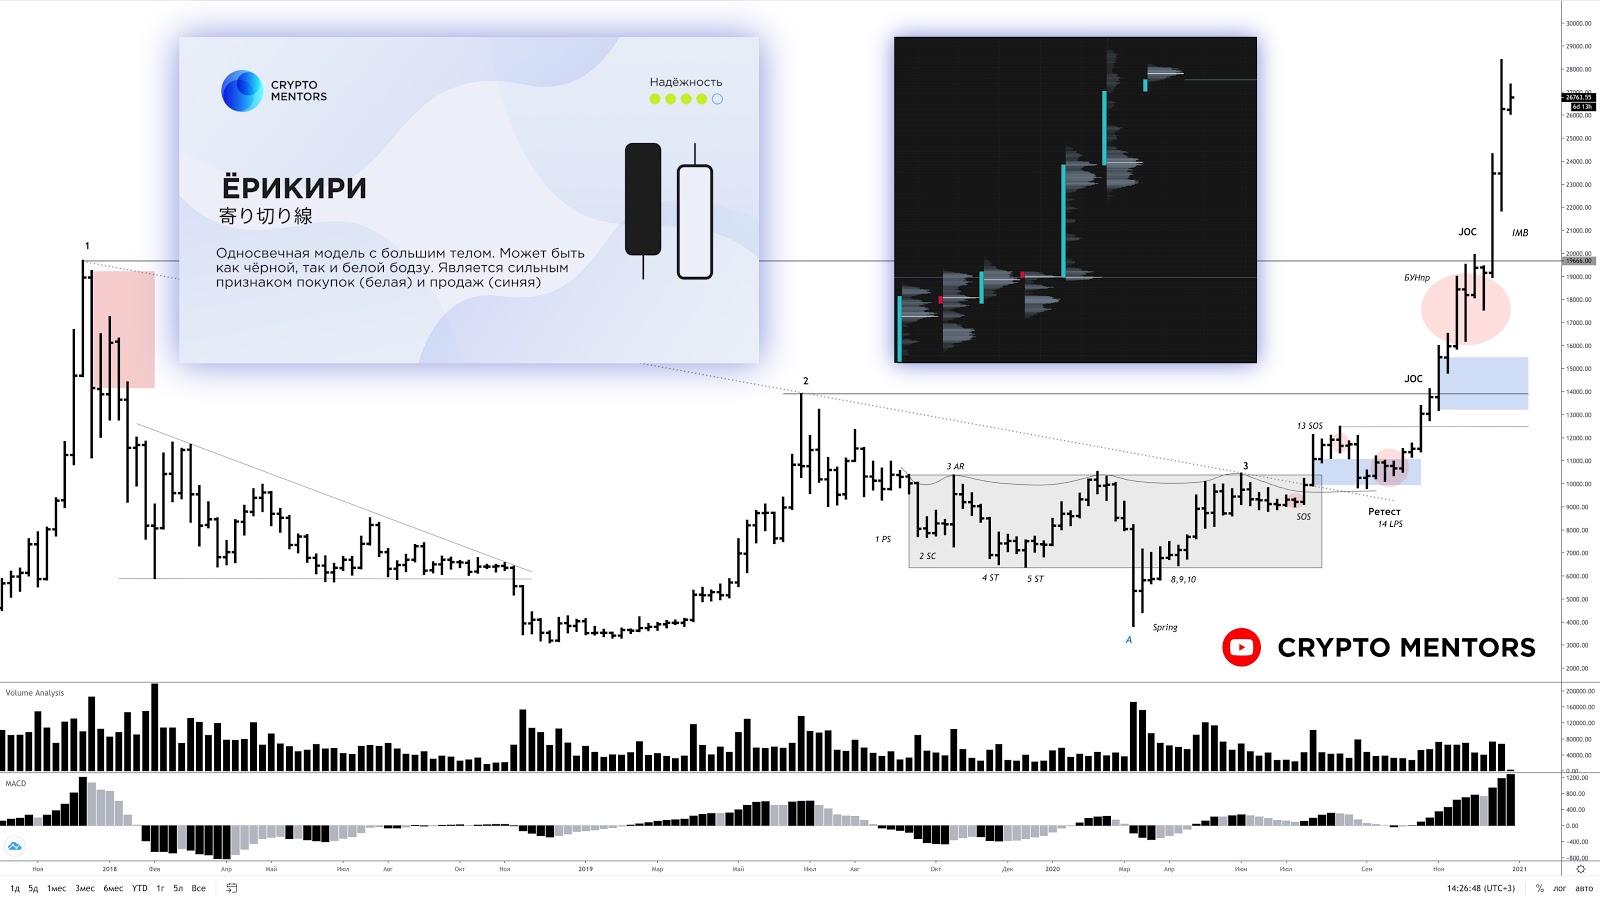
Last week’s bar showed an average matrix spread, but in the current move the scale is quite large—one of the largest.
Volume is moderate and falling. The move looks very confident; bulls dominate, and volume is distributed along the B profile. A small correction to fill the IMBs cannot be ruled out.
The current week’s bar is likely to close with buying, but a test of volumes should not be forgotten; it is likely to occur as a correction.
The candlestick model ‘erikiri’ — a sign of substantial buying.
Price Action and VSA
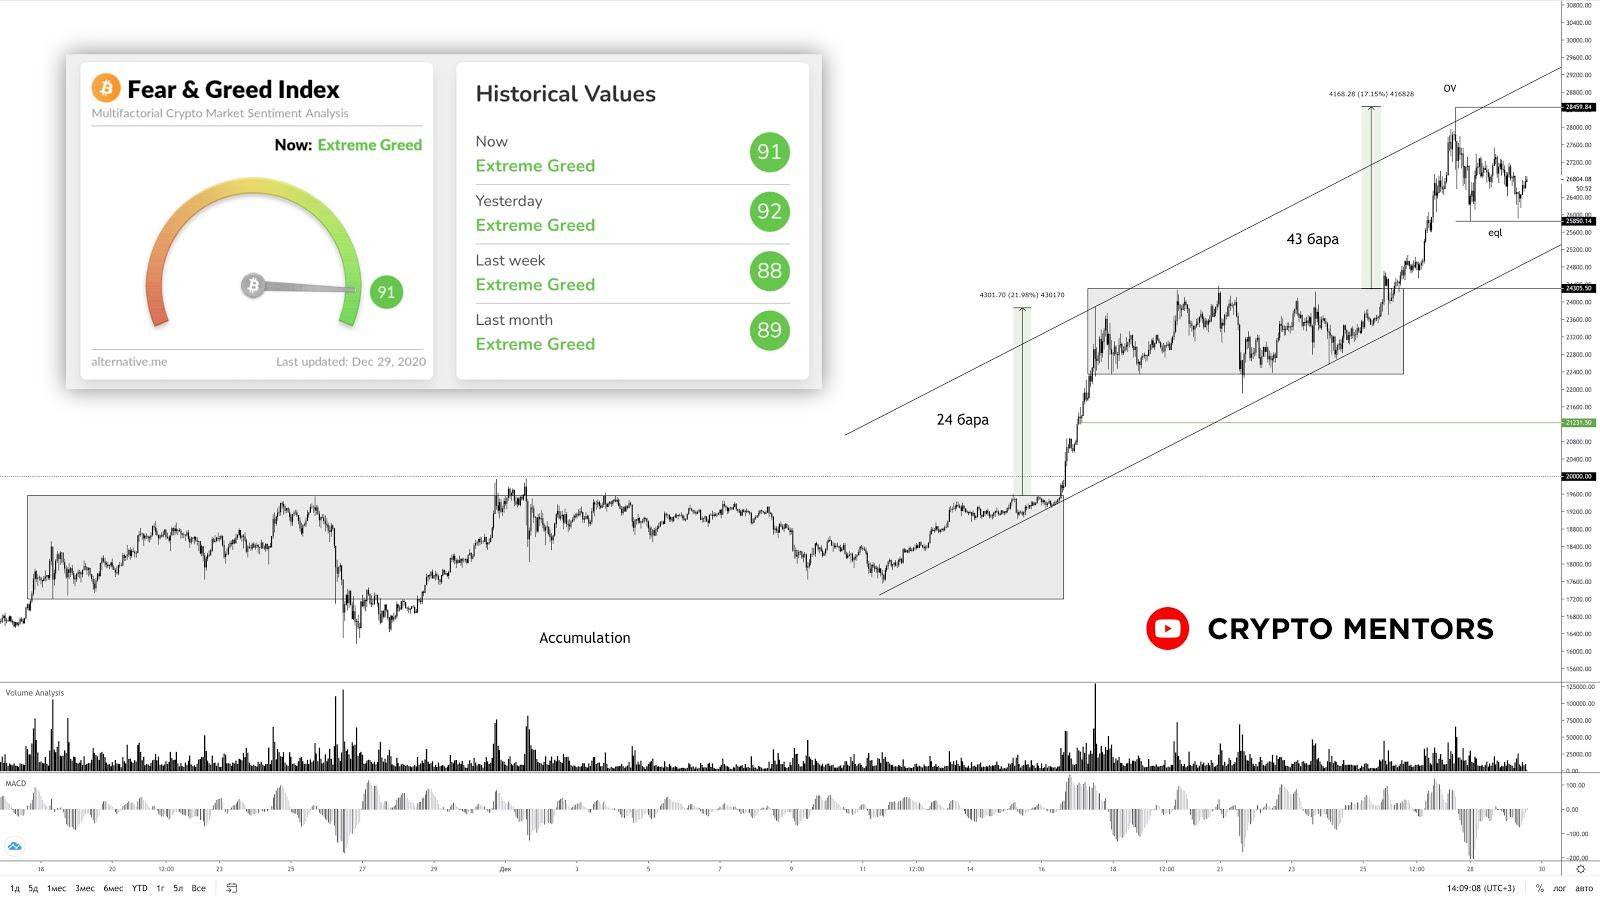
Price action is producing less efficient exits from consolidations and not very successful breakouts. In general, such behavior signals a possible price correction. At present, quotes are trapped between two key levels — $28,459 and $25,850.
The support level is most likely to be breached, functioning as an EQL—a liquidity magnet by the Price Action methodology, attracting the price.
The trend channel, built according to Viktor Sperandeo’s method (also described by David Wyse), points to an asset being overbought with a spike in the vertical volume histogram. Therefore, the OV point can be classified as BC and the culmination of growth, after which a correction lower should follow.
An additional factor for a move downward is the 91 reading of the cryptocurrency ‘Fear and Greed Index’. The last time such a high reading was reached was in 2019, preceding a deep and prolonged price decline.
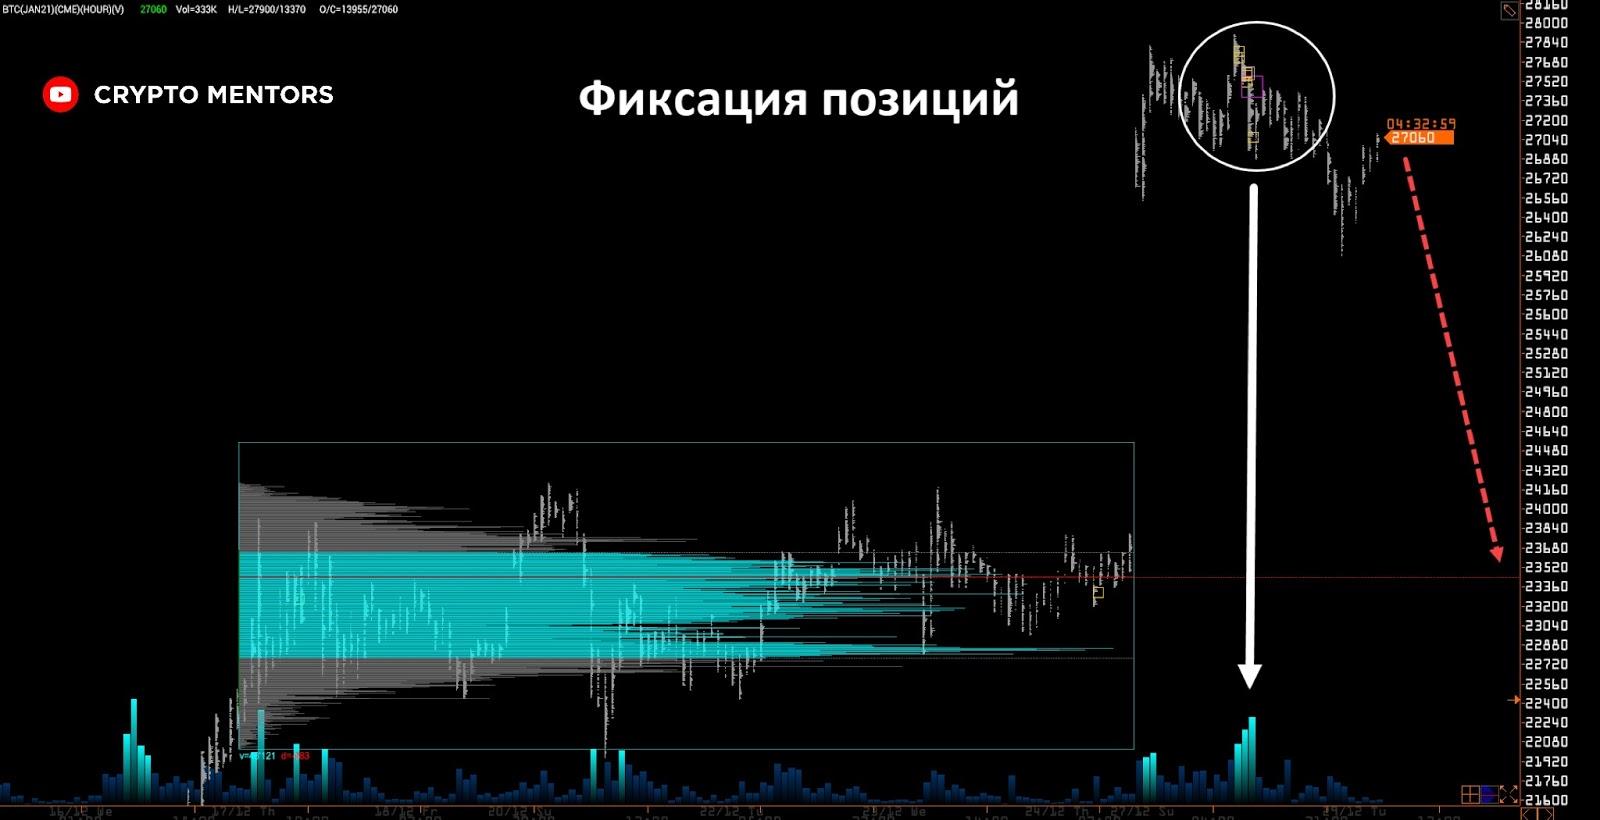
Analysis of horizontal volumes and deltas
During the Christmas holidays, buyers managed to push the price to $27,000. After the CME opened, we see traders reacting to such movement.
A sharp spike in volumes and a cluster of selling pressure already positioned suggest an inevitable correction to $23,000-$24,000.
Indicators of delta and open interest also point to a probable correction within the coming weeks. The cumulative delta shows a divergence, indicating fading momentum and loss of control. In nine out of ten cases this leads to substantial corrections.
Subscribe to ForkLog news on Telegram: ForkLog FEED — the full feed of news, ForkLog — the most important news and polls.
Рассылки ForkLog: держите руку на пульсе биткоин-индустрии!