


Trader outlines likely Bitcoin price moves after drop to $10,000
The trader Илья Мещеряков explains the current market situation.
Over the past week, things have not gone as expected, at least in my view. The breach of the $12,000 mark was only brief and merely to lure longs. After that came a sharp decline, which, bypassing all strong levels, halted only at the psychological $10,000 level.
Let us consider the current situation from the perspective of a large player and the potential displacement of the largest aggregate positions — longs and shorts. To begin, I propose reviewing the global balance of power on the four-hour timeframe — below I have marked the strong levels and consolidation zones, including the current near the $9,900-$10,000 area. There is some confusion regarding the rationale for the previous break of $10,000 after three months of accumulation aimed at a 20% rise, but the market is not always logical.
In my view, the cryptocurrency market and Bitcoin in particular are not inclined to a substantial correction. A 20% pullback often signals a change in trend to the downside. An additional factor pressuring the price is the ongoing capital outflow from risk assets. BTC has a significant correlation with them, including a leading one — due to the lower liquidity of the cryptocurrency market.

Global levels of BTC support/resistance and the indicated consolidation zones, including the current one (marked in blue). Four-hour chart BTC/USDT from TradingView.
Medium-term prospects, presumably, will be based on long- and short-squeezes. During the current consolidation near the $9900-$10 000 support zone, a large amount of open interest in longs has formed with anticipated stop-losses below $9900. Since the support zone has a flat structure, SL can be placed directly below support at prices of $9800-$9850.
Based on this, the price is quite likely to first show a false break of $9900 by about 300-400 dollars — enough to collect buyer SLs, but not enough for panicked selling, which will be hard to stop.
Following such movement, a number of short positions will appear (in addition to the current ones), but SL and liquidations of such shorts are often smeared across price levels. In fact, we can expect a protracted short squeeze up to around $11,200. Reiterating, this is likely to occur after a false breakdown of $10,000 to the downside.
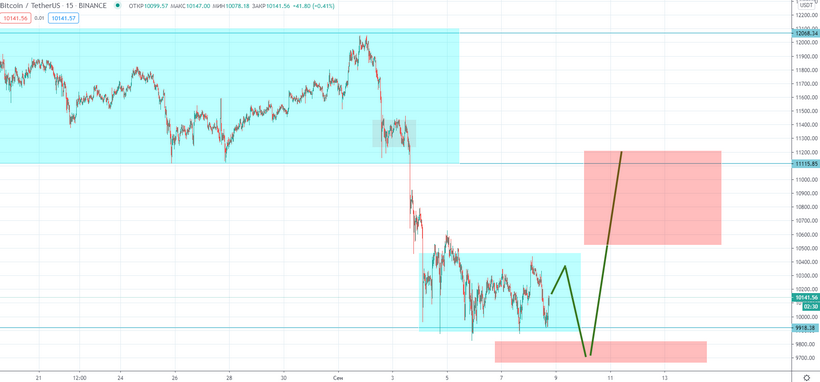
Proposed zones for buyer SLs (red from below) and sellers (red from above) with possible subsequent price action (green zigzag line). Fifteen-minute BTC/USDT chart from TradingView.
Thus, the formation of the current consolidation is likely to entice buyers into longs from the $9900-$10 000 zone, which a large player can exploit through typical stop-loss placements. The next move will be determined by the strength of panicked sentiment on a downward break, but more likely, before massive sell-offs, a rise to around $11,000 is needed to fuel a short-squeeze.
Follow ForkLog news on Twitter!
Рассылки ForkLog: держите руку на пульсе биткоин-индустрии!