


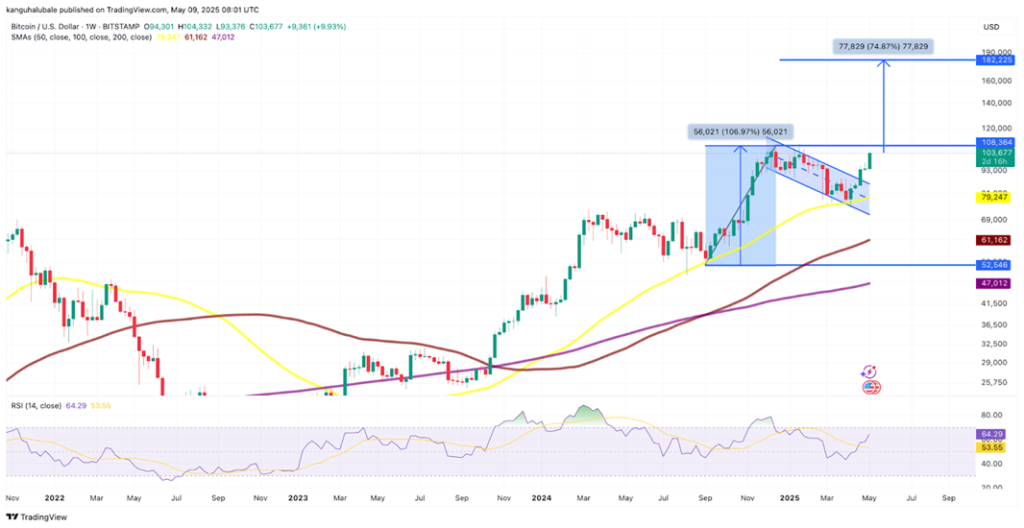
On bitcoin’s weekly chart, a breakout above a bull-flag pattern could set up a further climb toward $182,000—the range implied by the prior advance before a bearish consolidation. That scenario was outlined in Cointelegraph.


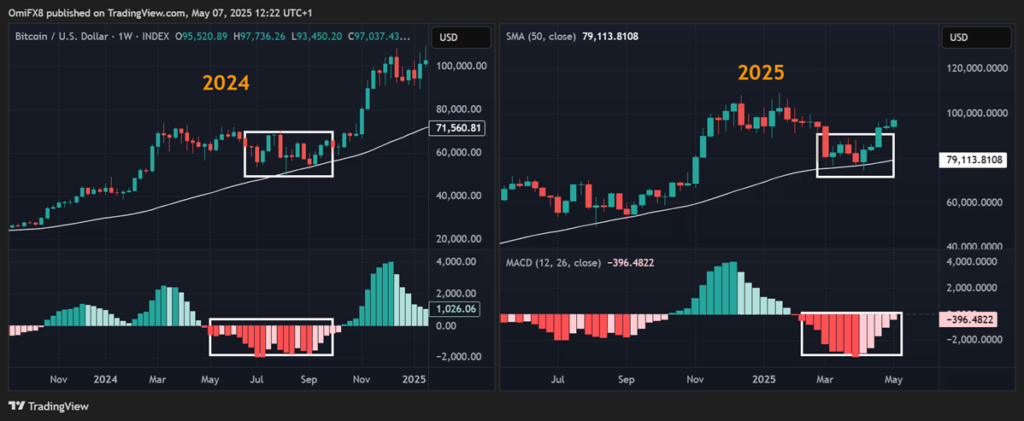
In CoinDesk, analysts suggested drawing parallels with two patterns from late 2024, when the price jumped from $70,000 to $109,000.
The first is the MACD indicator. In mid-October the metric turned bullish, with the uptrend extending into December. At present the indicator has only approached the neutral level. A move above it would signal that the March–April sell-off was a bear trap.


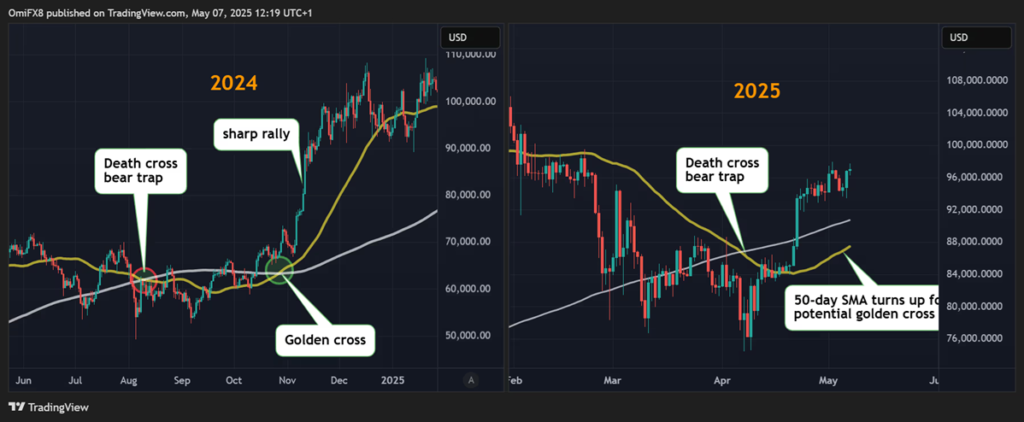
The second indicator combines the 50 DMA and 200 DMA. About four weeks ago the moving averages formed a “death cross” that failed.
The “fast” DMA has recently started to rise and may cross the “slow” one from below, forming a “golden cross” in the coming weeks.
A similar signal appeared in August last year, followed by a new ATH.


From scenarios to levels
The analyst known as AlphaBTC cited $106,000 as the next target for the rally.
?#Bitcoin to test ATH soon ⁉️
I am liking how these fib levels line up with support, makes me think $BTC has another leg to 106K+ before it corrects.#Crypto #BTC https://t.co/53ybaJTuT7 pic.twitter.com/hFmxToy8oZ
— AlphaBTC (@mark_cullen) May 9, 2025
Analyst and MN Trading founder Michaël van de Poppe shares a similar view. He highlighted the area between $103,800 and $107,000 as a likely pause before a pullback, with a subsequent new ATH this quarter.
What a move on #Bitcoin.
I assume we’ll pause for a bit between here and $107,000 before we’ll break to a new ATH in this quarter. pic.twitter.com/IhRueTnyJf
— Michaël van de Poppe (@CryptoMichNL) May 9, 2025
The analyst known as kingfisher_btc warned of pullback risks given the lack of meaningful liquidity clusters above current levels.
Peeking at the BTC liquidation map right now. ?
Notice the big cluster of long liqs (left side of the green line)? That shows heavy liquidity stacked just below the current price.
[Visual: BTC Liquidation Map Screenshot]
There’s much less short liquidity clustered above. This… pic.twitter.com/1iByc9YrKZ
— TheKingfisher (@kingfisher_btc) May 9, 2025
Trader Egrag Crypto pointed to $170,000 as a medium-term marker. The forecast could come into play if the all-time high around $109,000 is broken.
#BTC — #BLOWOFFTOP, But First: ?
This chart reflects my stance on #BTC since early 2023. I’ve been targeting the $170K range as the potential cycle top — but here’s the key: #BTC must close above $109K. Anything less? Just a #BullTrap and a retracement, nothing more. ??… pic.twitter.com/ZteiySb0lJ
— EGRAG CRYPTO (@egragcrypto) May 9, 2025
On 8 May, bitcoin cleared the psychological threshold at $100,000, last seen in early February.
At CryptoQuant, analysts noted the preconditions for a significant price increase, given record levels of realised capitalisation.
Binance founder Changpeng Zhao has said the price of digital gold could reach $500,000 and even $1 million in the current cycle.
Earlier, Standard Chartered urged buying the first cryptocurrency and forecast its price would rise to $120,000 in the fourth quarter.