


Analyst Says Bitcoin Сould Sink to $40,000 if the 2022 Pattern Repeats
Bitcoin below the 100-week average; $40k risk and an 'air pocket' near $70k–$80k
The leading cryptocurrency closed the weekly candle below 100SMA, which runs near $87,500. Analyst Brett highlighted the loss of this key macro-trend support.
Bitcoin has closed weekly below the 100W moving average.
Outside of a black swan flash crash (COVID), Bitcoin has historically stayed below it for 182-532 days.
Why does this matter?
Be patient. Set limit orders. Don’t fomo. Have a strategy.
The 100w is currently at… https://t.co/pDzBM25lcA pic.twitter.com/YLTR2pHDfP
— ₿rett (@brett_eth) February 2, 2026
He noted that the coin often lingers below this line for long stretches. The only exception was the brief 2020 crash. In other instances, the asset entered a prolonged accumulation phase:
- in 2014–15, price stayed below it for 357 days between $200 and $600;
- in 2018–19, the period lasted 182 days near the bear-market lows ($3,000–$6,000);
- in 2022, after the FTX collapse, consolidation took 532 days ($16,000–$25,000).
Only the brief pandemic-era plunge in 2020 broke the pattern. The current setup points to prolonged accumulation rather than a quick bounce.
The USDT dominance factor
An analyst using the pseudonym Sherlock warned of risks of a bearish turn.
Bitcoin has 36 hours before the bear market officially starts.
USDT dominance is about to close above 6.7% for the first time in 2.5 years.
This is the level that started the bull market when it broke down in October 2023.
Every retest of this resistance marked Bitcoin… pic.twitter.com/WSLIAmgjZU
— Sherlock | DeFi Researcher (@Sherlockwhale) January 31, 2026
Dominance of the stablecoin USDT on the weekly chart has exceeded 7.2%. In prior cycles, a weekly close above 6.7% confirmed a downtrend. Such a breakout is the first in two and a half years.
The $85,000 level is a serious barrier to upside, Sherlock says.
$85,000 is about to become Bitcoin’s biggest resistance for the next 6 months.
Everyone who bought between $85K-$108K over the past 3 months is underwater. That’s overhead supply. Trapped longs.
When price rallies back to $85K, all those underwater will holders get their first… pic.twitter.com/3MdWkzUt5J
— Sherlock | DeFi Researcher (@Sherlockwhale) February 1, 2026
In Q4 2025, spot trading volume between $85,000 and $95,000 topped $120bn. Many investors are underwater.
At around $78,000, any rally to $85,000 is likely to meet selling from traders seeking to break even. The realized price for short-term holders (1–3 months) is $91,500.
Market structure echoes a 2022 fractal. Back then, Bitcoin set lower highs and lost the 100-week SMA before a deep correction.
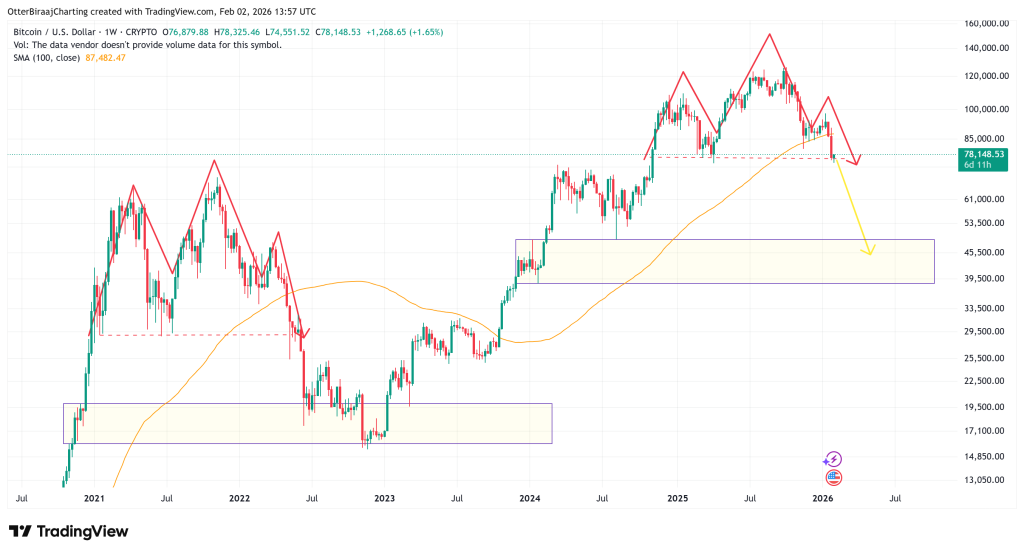
If the pattern repeats, the price could fall to the $40,000–$45,000 demand zone. Downside risk persists until a decisive reclaim of the moving average.
Alternative forecast: ‘air pocket’
The crypto market is nearing the end of its decline, writes CoinDesk, citing Compass Point analysts Ed Engel and Michael Donovan. In their view, a much deeper drop would require a sell-off in the US stock market.
The base case puts the trough at $60,000–$68,000, with a turn near $65,000. In that zone, long-term holders (more than six months) acquired 7% of supply, providing strong support.
Analysts call the $70,000–$80,000 range an ‘air pocket’. In this corridor, long-term investors bought less than 1% of coins, leaving little structural support and the risk of further selling pressure.
The slide below $81,000 reflects the average entry price for holders of Bitcoin ETF shares and the broader market. Since January 15, net fund outflows have totaled $3bn. More than 50% of assets under management are in the red. The $81,000–$83,000 zone now acts as resistance.
The worst case is a drop to $55,000. That is the average acquisition price across all historical buyers. In 2022, breaking that level required a bear market in equities and high-profile crypto bankruptcies.
Earlier, Cantor Fitzgerald suggested that digital assets are entering the early stage of a prolonged slump.
Рассылки ForkLog: держите руку на пульсе биткоин-индустрии!