

Bitcoin’s $60,000 Dip: A Local Bottom, Says K33
Bitcoin's $60,000 dip may be a local bottom, says K33 Research.
Bitcoin’s drop to $60,000 may have marked a local bottom. Analysts at K33 Research observed signs of investor capitulation across the spot market, ETFs, and derivatives.
Head of Research Vetle Lunde highlighted several market anomalies:
- trading volumes reached the 95th percentile (among the highest levels);
- funding rates plummeted to levels seen during the banking crisis of March 2023;
- the skew in the options market returned to bearish 2022 levels.
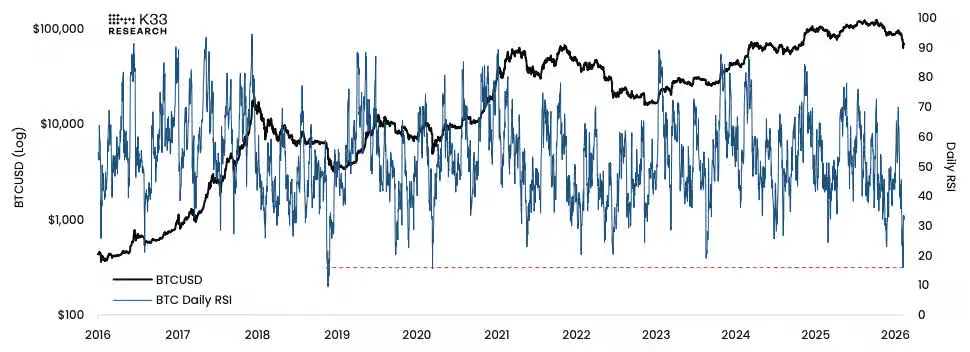
Momentum indicators also signal extreme oversold conditions. Amid prolonged selling since January 20, the daily Relative Strength Index (RSI) fell to 15.9. This is the sixth deepest result since 2015, with lower values only during market crashes in March 2020 and November 2018.
The Fear and Greed Index dropped to 6 points during the sell-off — the second lowest in history. This underscores the depth of investor pessimism as Bitcoin approached $60,000.
According to Lunde, historically, such episodes coincided with cyclical lows. This supports the hypothesis that the recent correction has formed a local bottom.
“Hyperactive Trading” and Derivatives Pressure
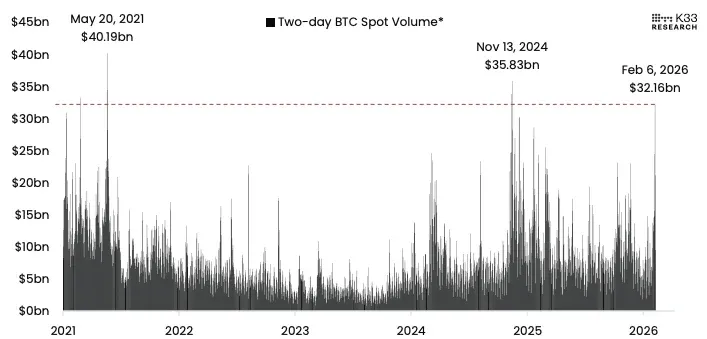
The price movement was accompanied by “hyperactive trading,” noted Lunde. By February 6, the two-day spot trading volume of digital gold reached $32 billion — one of the highest in history.
The figures for February 5 and 6 remained in the 95th percentile. According to the report, such trading intensity has only been observed once in the past five years — during the FTX exchange collapse.
The analyst noted that such spikes often indicate the passing of local extremes. Typically, they are followed by a period of consolidation and a retest of lows.
Tension remains in the derivatives market. On February 6, the annual funding rate for perpetual Bitcoin swaps fell to -15.46% — a low since the banking crisis of March 2023. The weekly average dropped to -3.5%, setting a new record low since September 2024.
The skew indicator in the options market shifted to an “extremely protective zone.” According to Lunde, such values were previously recorded only during the Terra collapse, 3AC liquidation, and FTX bankruptcy.
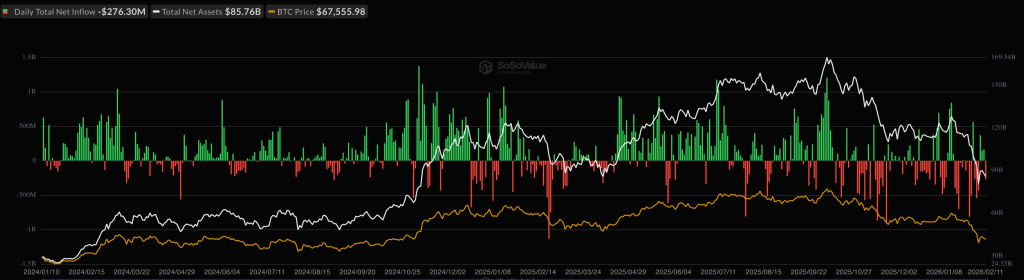
American spot Bitcoin ETFs also showed record activity. On February 5, IBIT trading volume exceeded $10 billion, setting a historical high.
However, on the same day, the funds faced the fifth-largest net outflow since launch. Despite inflows in subsequent days, a total of 13,670 BTC was withdrawn from products since February 3.
K33 anticipates a prolonged price consolidation in the $60,000–$75,000 range.
Experts also predict a decline in trading activity and allow for a retest of support, but see no fundamental reasons for prices to fall below the local minimum.
Earlier, Glassnode analysts described the recent dip in the leading cryptocurrency as “moderate.”
Рассылки ForkLog: держите руку на пульсе биткоин-индустрии!