Key
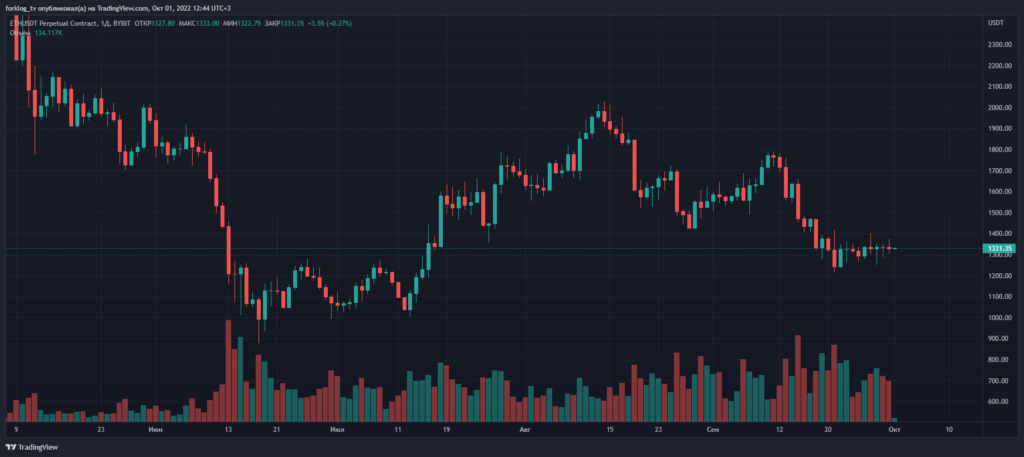
- Ethereum moved to the Proof-of-Stake consensus. Since then the ETH price has trended downward.
- Progress in the SEC’s case against Ripple has reflected positively on XRP’s price.
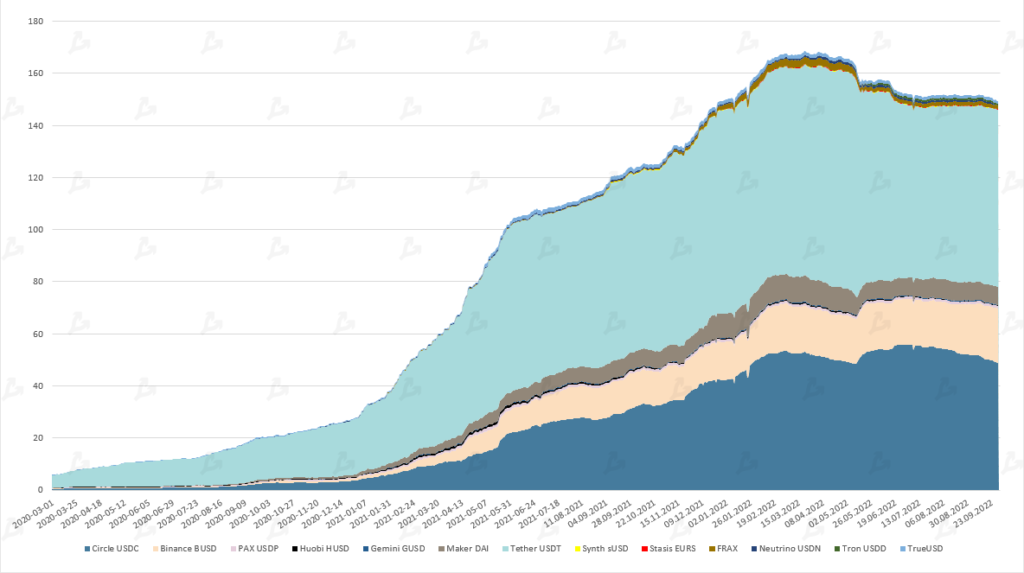
- Stablecoins’ market capitalization fell below $150 billion.
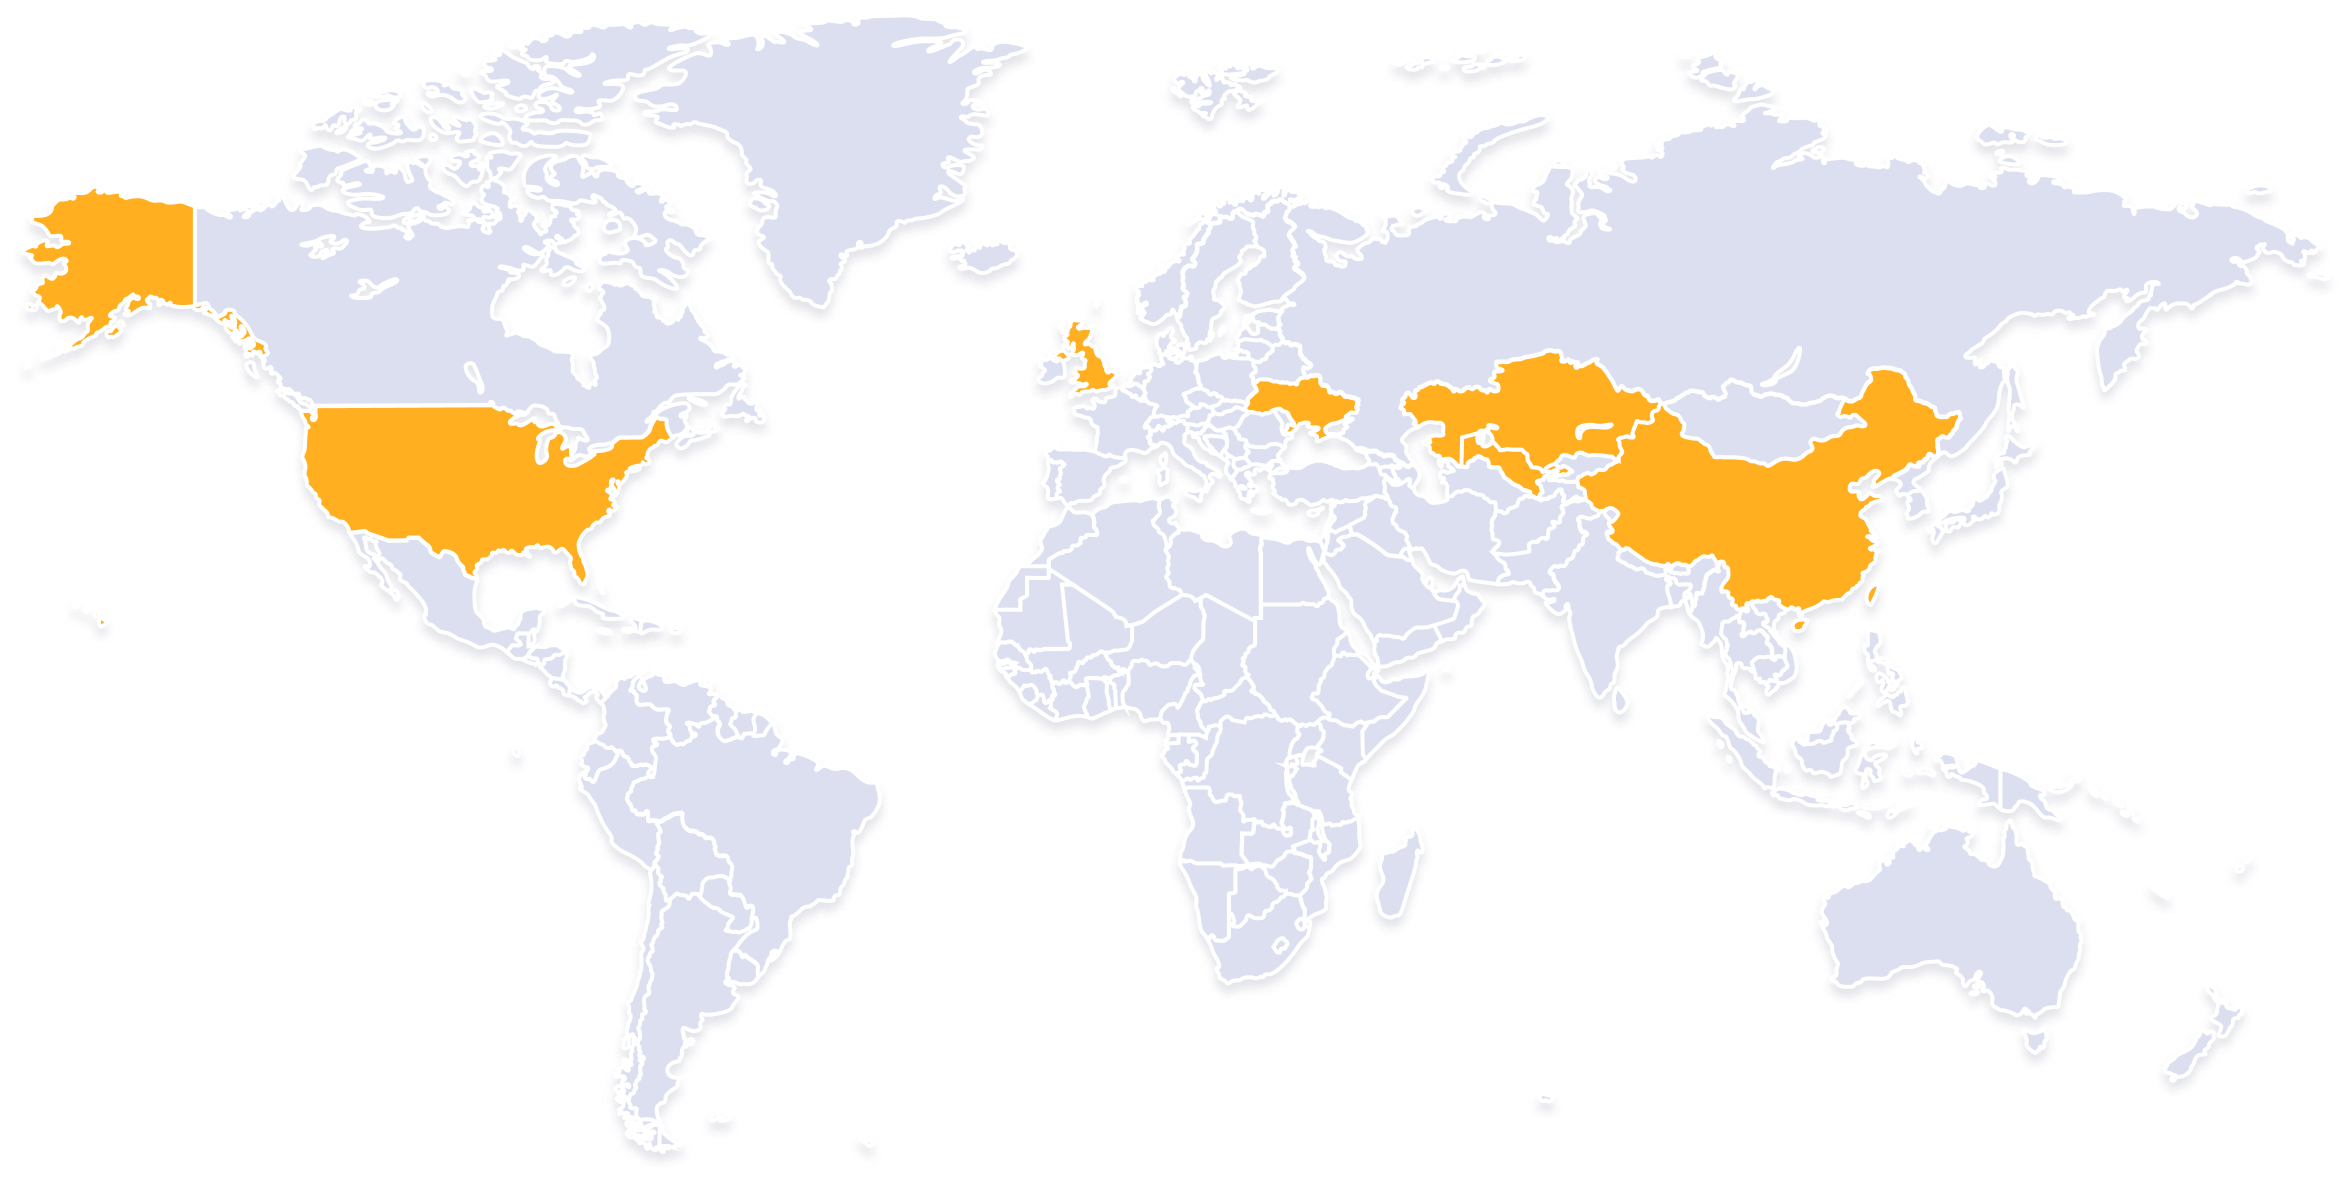
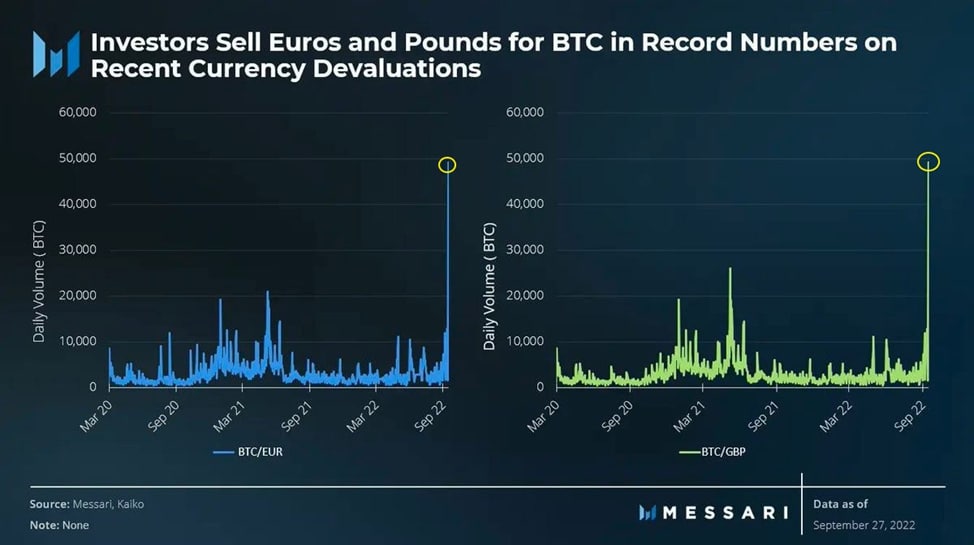
- There was a spike in Bitcoin purchases in exchange for the British pound and the euro.
- On-chain indicators point to bearish sentiment prevailing.
- The Foundry USA mining pool’s share of Bitcoin’s hash rate rose above 25%.
- Bitcoin hit a local low amid the Fed’s decision to raise the key rate.
- Ethereum’s emission rate slowed after The Merge upgrade.
Momentum of Leading Assets


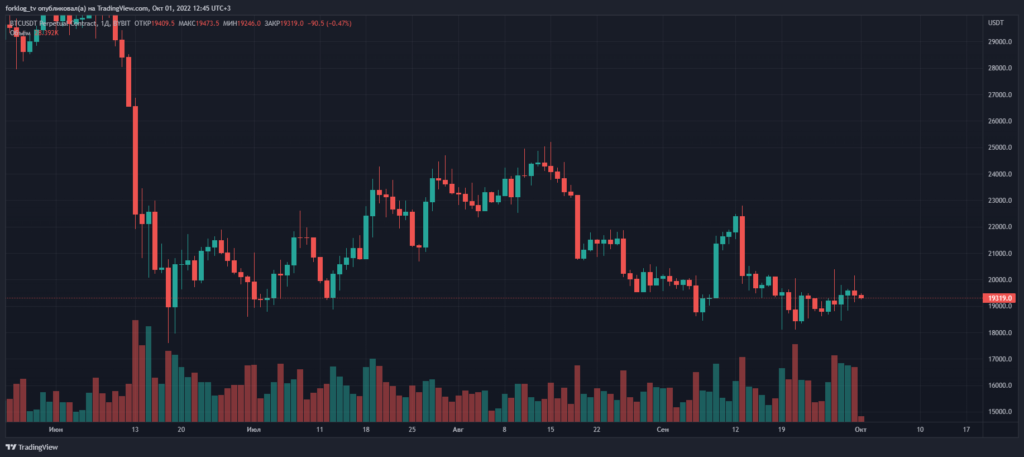
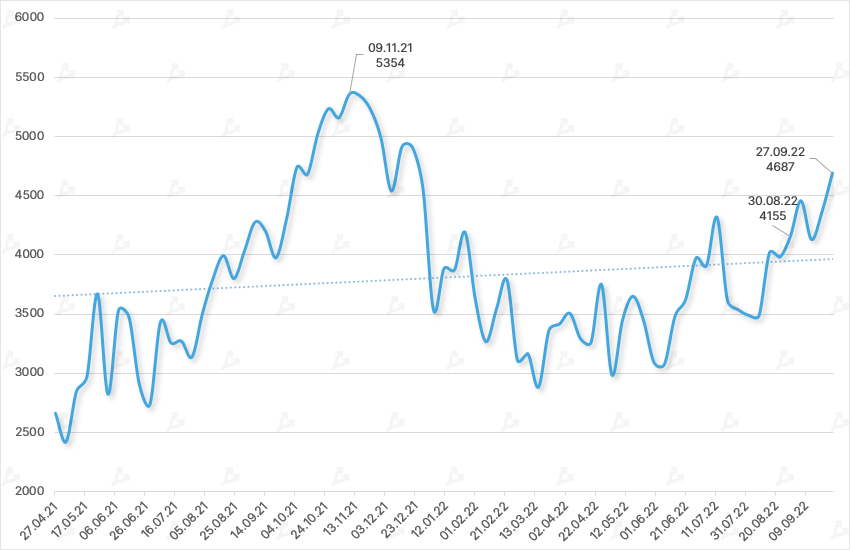
- In September, the leading cryptocurrencies did not show sharp moves and prices largely stayed within their prior range.
- Despite the successful The Merge upgrade in the Ethereum network, the event did not have a positive effect on prices. Moreover, after September 15, the asset began to fall toward a local low since July, pulling the rest of the market.
- Bitcoin fell 3.1% for the month, and Ethereum declined 14.5%.
- Bitcoin’s dominance index dropped below 39% — to January 2018 levels.

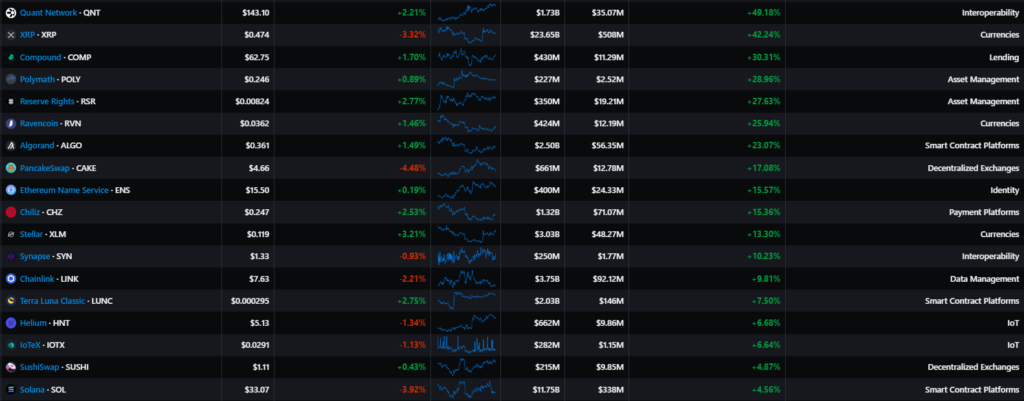

- Among mid-cap assets, Quant Network (QNT) performed well on progress in the Ripple case; XRP and Stellar (XLM) also showed positive momentum, along with Compound (COMP), Algorand (ALGO), PancakeSwap (CAKE). After Ethereum miners migrated to Ravencoin (RVN), the project token also rose.
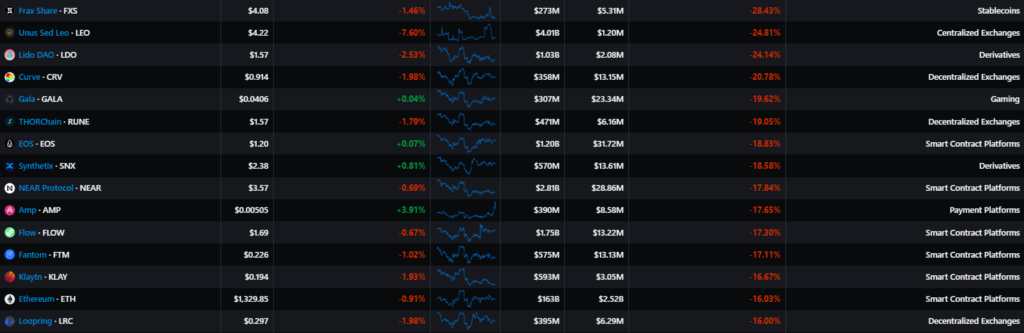
- Among the underperformers were tokens of smart-contract platforms and decentralized exchanges. The worst performers included Frax Share (FRAX) and Unus Sed Leo (LEO) from the Bitfinex ecosystem.
Stocks of crypto-related companies
Performance of mining company securities
Canaan (CAN):
-4.37%
Ebang International (EBON):
-12.72%
Riot Blockchain (RIOT):
+0.72%
Hut 8 (HUT):
-9.69%
Marathon Digital (MARA):
-6.71%
Public miners and companies tied to the crypto industry posted a negative momentum in September as Bitcoin moved mostly sideways. There were discussions in the community that the next ‘problematic’ firms could be the crypto miners themselves.
According to Arcane Research, despite a strong 2021, many public miners recorded an accumulated loss on their balance sheets. Meanwhile, Bitmain cofounder Jihan Wu, who now leads BitDeer, announced plans to establish a $250 million fund to aid struggling mining companies.
Macro backdrop

- At the September 21 meeting, the Fed raised the policy rate by 0.75 percentage points to 3-3.25%. Fed projections suggest it will reach 4.4% by year-end and 4.6% for 2023 (in June, expectations were 3.4% and 3.8%, respectively). In the press conference, Jerome Powell indicated the parameter could increase by another 1-1.25% by year-end.
- The Fed decisions disappointed investors, as markets had not yet priced in the end of the hiking cycle by spring-summer 2023.
- Unlike the U.S. stock market, which was hitting new lows, Bitcoin and Ethereum held steady, tempering the previously observed record correlation ahead of the Fed meeting.

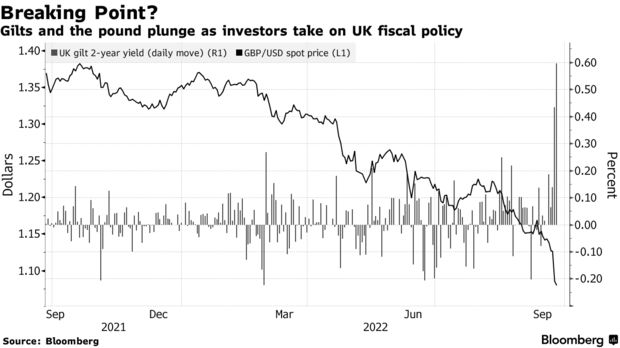
- In Italy, a centre-right coalition came to power, raising concerns about Rome-Brussels relations and a potential debt crisis. Signs of such a crisis were more visible in the UK after Finance Minister Kwasi Kwarteng proposed sweeping tax cuts in a high-inflation environment.
- In the context of debt-market volatility and the sharp depreciation of the British pound and the euro against the dollar, there was a sharp spike in purchases of digital assets in those fiats.
Market mood, correlations and volatility

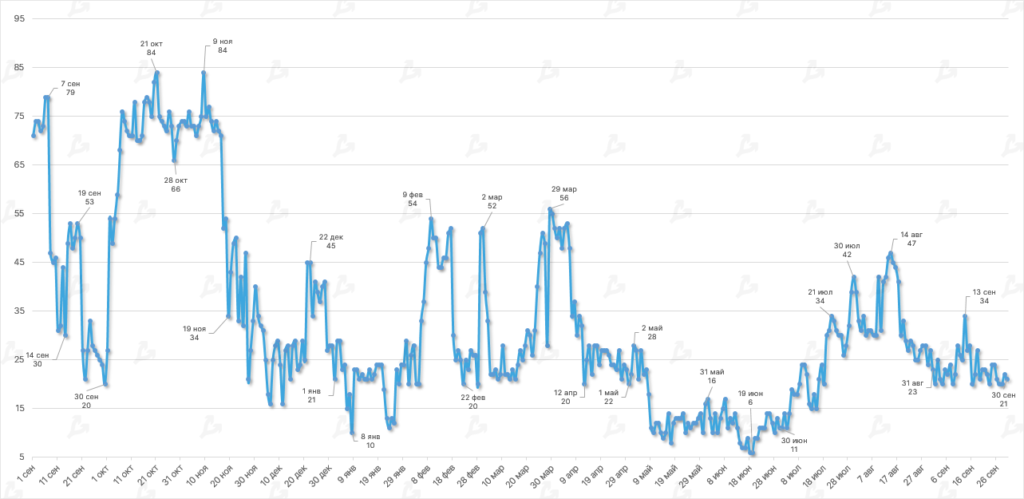

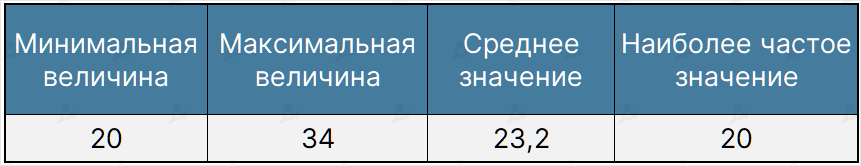
- In September, the Fear & Greed Index remained in the “extreme fear” zone. Compared with the prior month, the index’s average value virtually unchanged (24.2 vs. 23.2).
- Investor sentiment was influenced by macro factors, including the Fed decision to raise the target rate by 75 basis points.

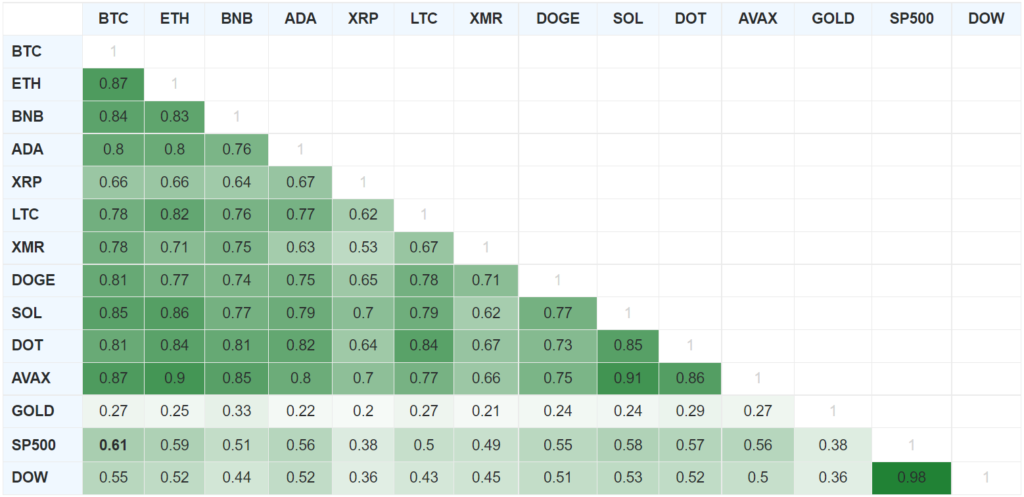

- The correlation of Bitcoin with the US stock market remained largely unchanged. The smoothed 90-day average stood at 0.61 for the S&P 500 and 0.59 for the Dow (August: 0.61 and 0.55 respectively).
- The relationship between Bitcoin and gold strengthened for the third consecutive month (0.27 vs. 0.24 in August), but remains weak enough to argue that Bitcoin is not a reserve asset.
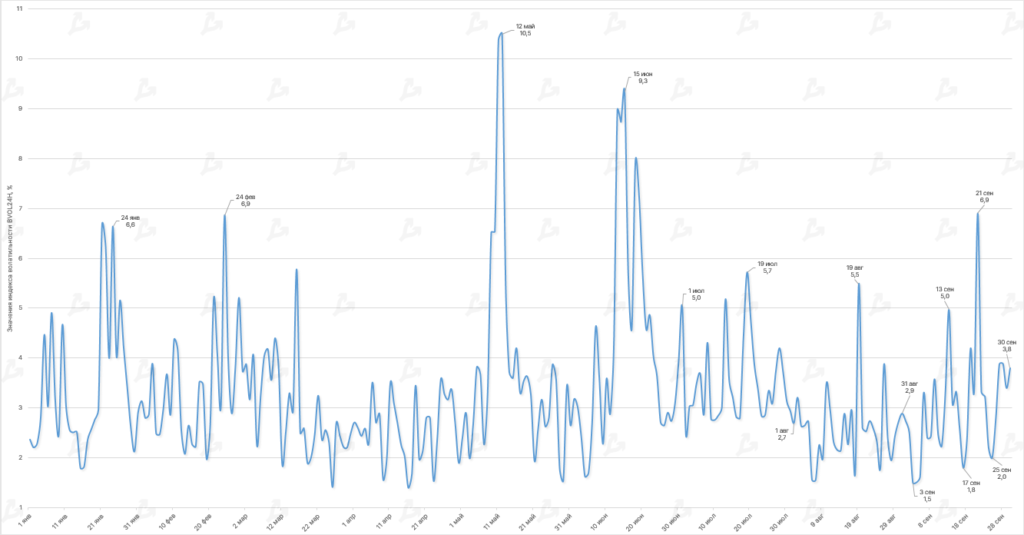
- In September the BVOL24H average registered around 3%, higher than August (2.6%).
- The index peaked at 6.9%—the extreme occurred on September 21, when, amid the Fed rate hike, crypto prices fell below $19,000.
On-chain data
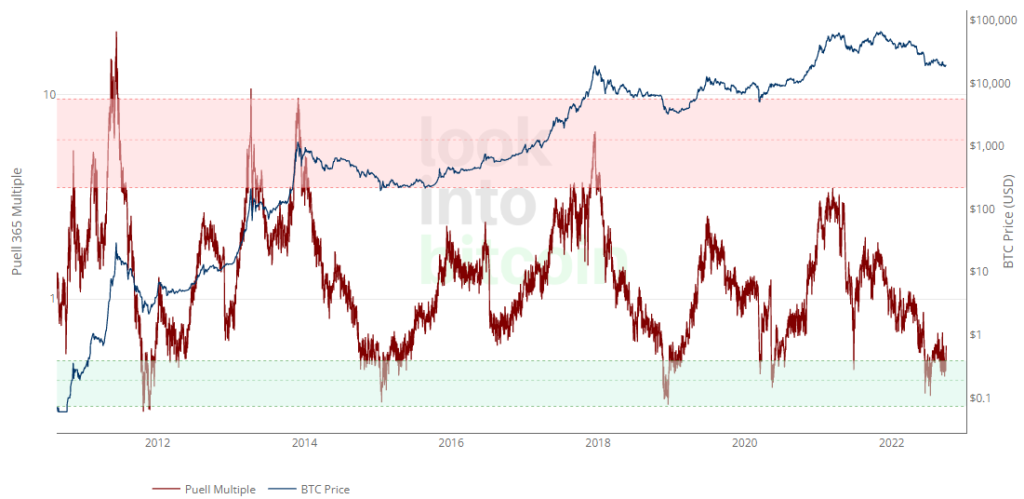

- In September the Puell Multipler plunged into and out of the oversold zone several times, suggesting no clear signal that the bear market is ending.
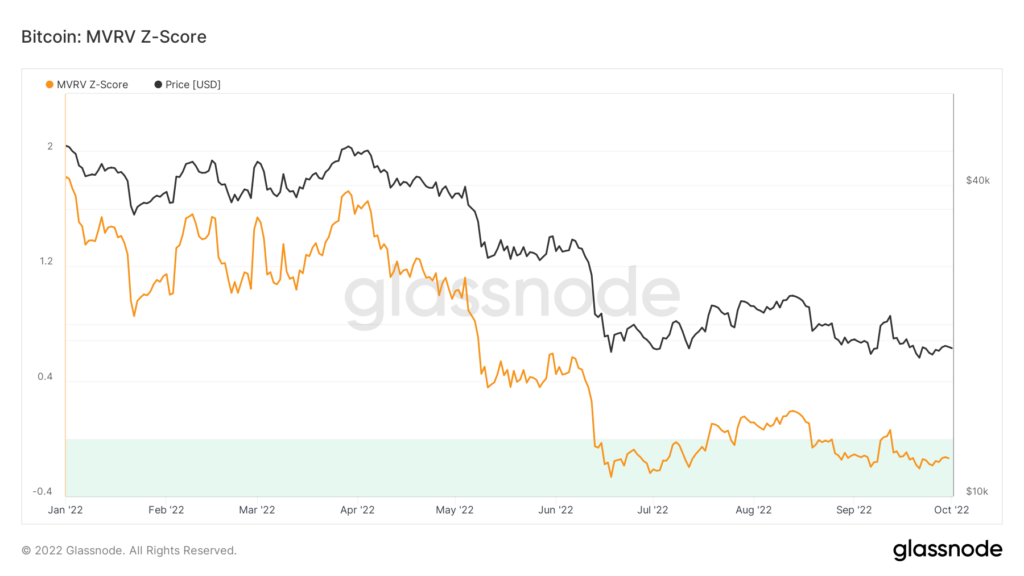
- The MVRV Z-score remained mostly in the “green zone”, indicating persistent market pessimism and, at the same time, potential favorable periods for long-term buying opportunities.
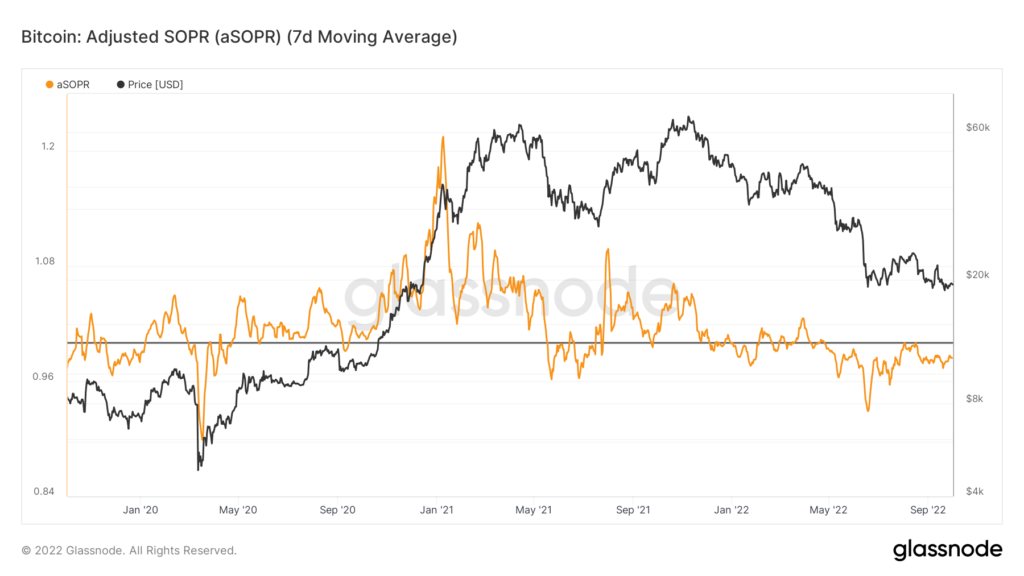

- In September the on-chain indicator Puell Multiple occasionally dipped into the oversold zone, signifying no clear signal that bear market is ending.
- The indicator MVRV Z-score remained mostly in the “green” zone, indicating pessimism on the market but also a potentially favorable period for long-term cryptocurrency purchases.

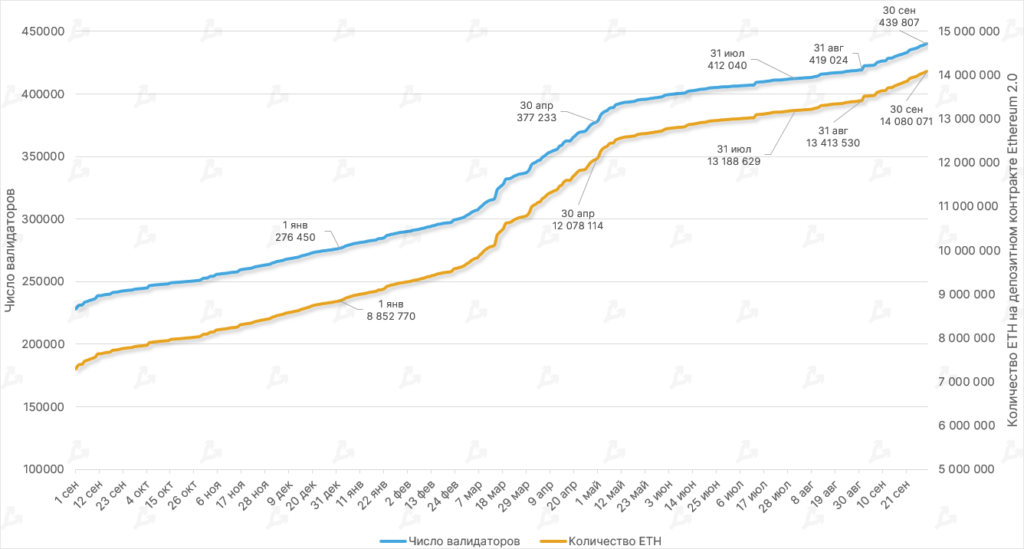

- By the end of September, ETH staking exceeded 14 million coins. The monthly increase was 5%, the largest since May 2022.
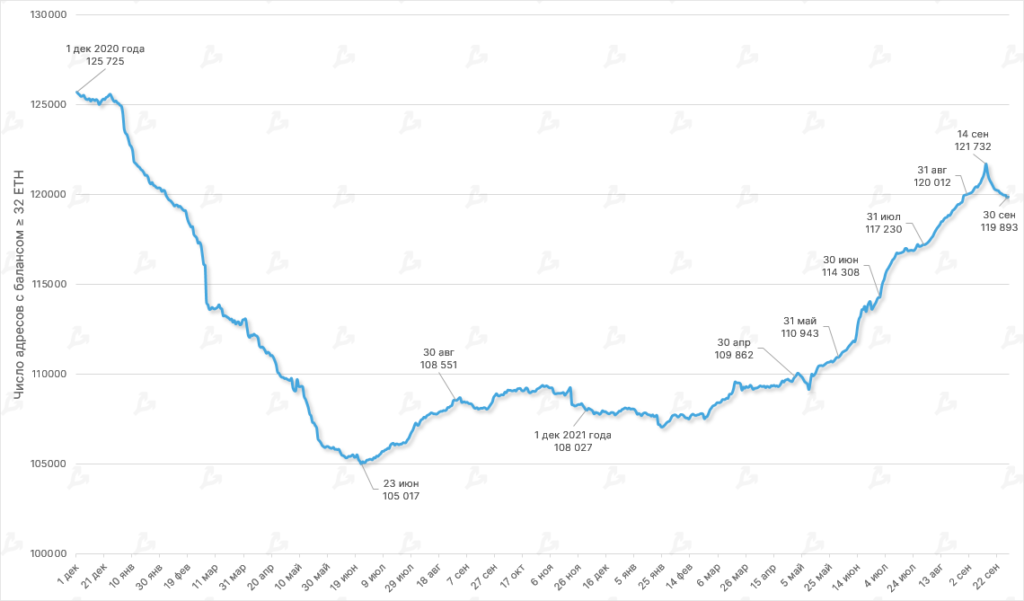
- The number of unique addresses staking 32 ETH or more reached 439,807. These wallets can validate transactions and earn staking rewards.
- The number of Ethereum addresses with balance ≥ 32 ETH rose in the first half of the month but changed after The Merge activation.
Lightning Network

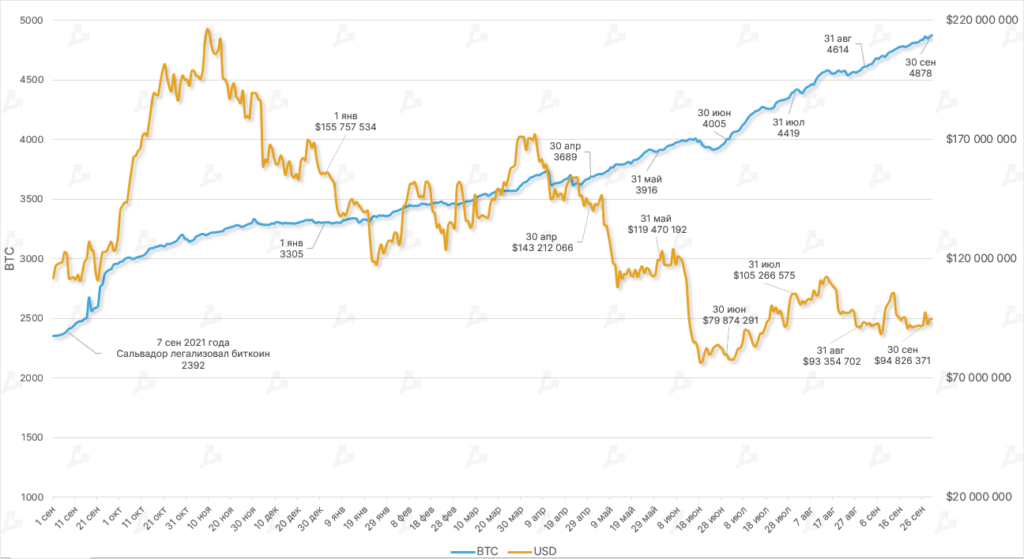

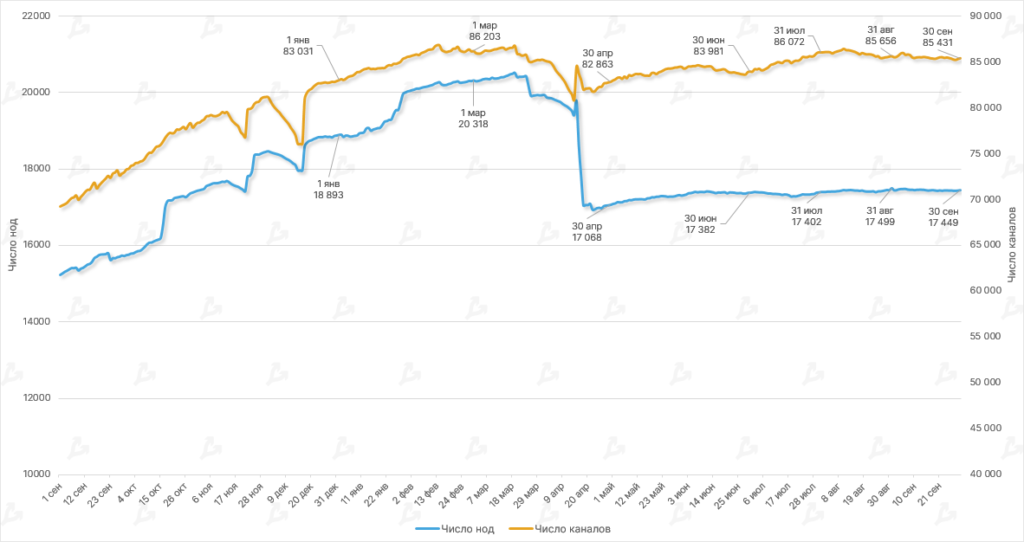
- In September the LN capacity reached 4878 BTC, up 5.7% month-on-month. For comparison, August growth was 4.4%, and July 10%.
- The number of LN nodes remained virtually unchanged (17,449). The number of channels declined for the second month in a row, to 85,431 in September.
Mining, Hashrate, Fees

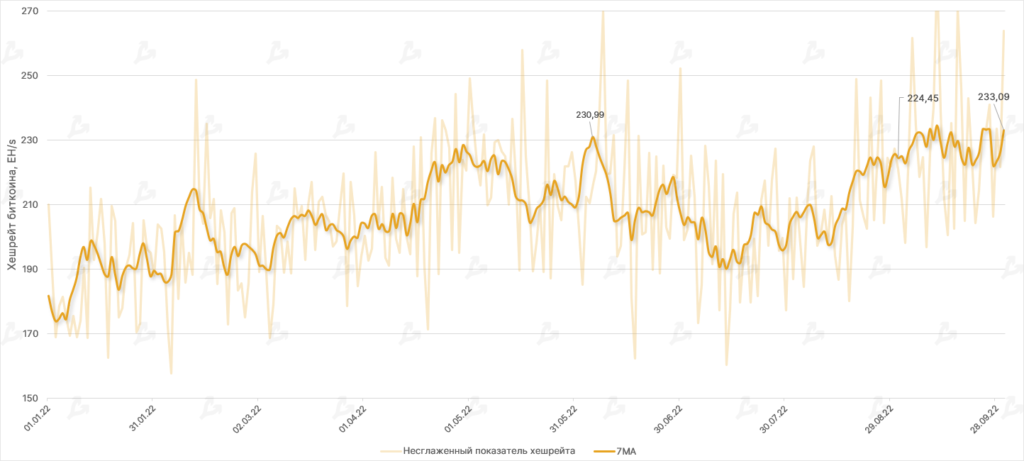

- Amid largely flat price action, Bitcoin’s hash rate (7 MA) rose by only 3.6% for the month. A stronger recovery in the market would be needed to push the indicator higher. The current readings point to miners’ uncertainty about mid- and long-term prospects for the first cryptocurrency.
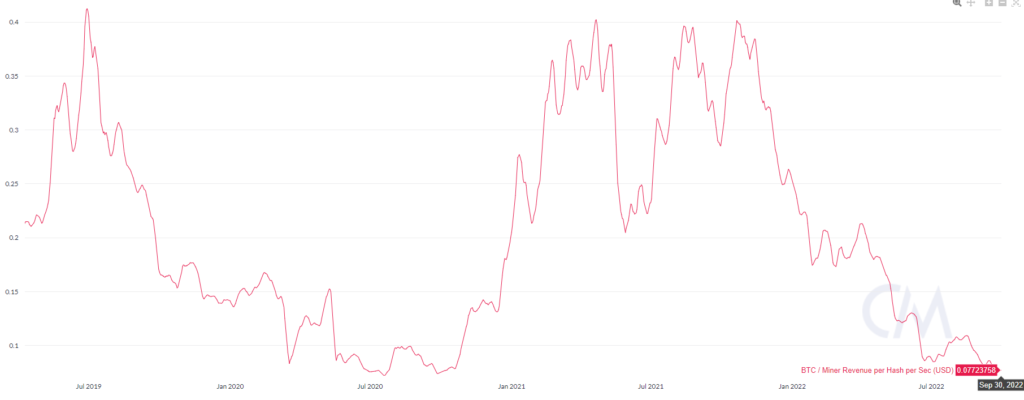
- Market pessimism likely stems from lower mining profitability and the exit of less-efficient miners. The hashprice indicator fell to July 2020 levels when Bitcoin traded under $10,000. Coupled with poor financial management and overly aggressive investments, this helped drive losses at several publicly traded firms.
- The mining landscape also remains challenging; recently the difficulty for mining Bitcoin rose, with the metric dipping only modestly on a recent move. has shown a negative trend since July 2022, with the metric down 2.14% (to 31.36 T).

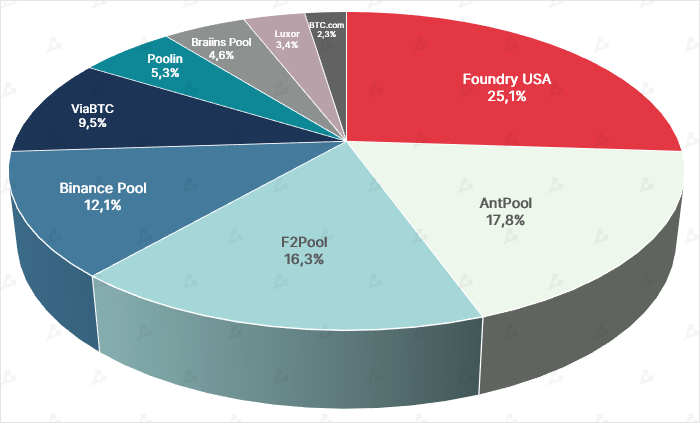

- Foundry USA cemented its leadership among the biggest Bitcoin pools, with its share in total hashrate above 25%. AntPool also expanded its market share—rising from 15.4% to 17.8% over the month. F2Pool rose from 15.1% to 16.3%, and Binance Pool from 9.8% to 12.1%. Poolin’s share fell from 10.2% to 5.3%, with the firm acknowledging liquidity issues and later rolling out a plan to resume withdrawals.
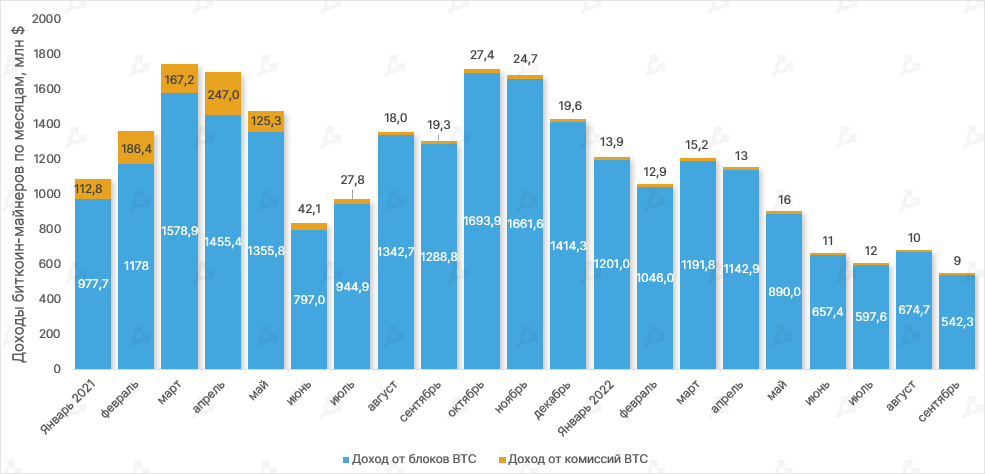
- Against a backdrop of flat Bitcoin price and high mining difficulty, overall miner revenue declined by 19%, totaling $551 million.
- Following Ethereum’s full transition to Proof-of-Stake due to the The Merge upgrade, miners exited the Ethereum network; their inflows dropped to zero. The annual yield for validators is about 4.8%.
- The hash rates of Ethereum’s main successors declined after The Merge. ETC stands at 147 TH/s as of 01.10.2022, ETHW at 48 TH/s.

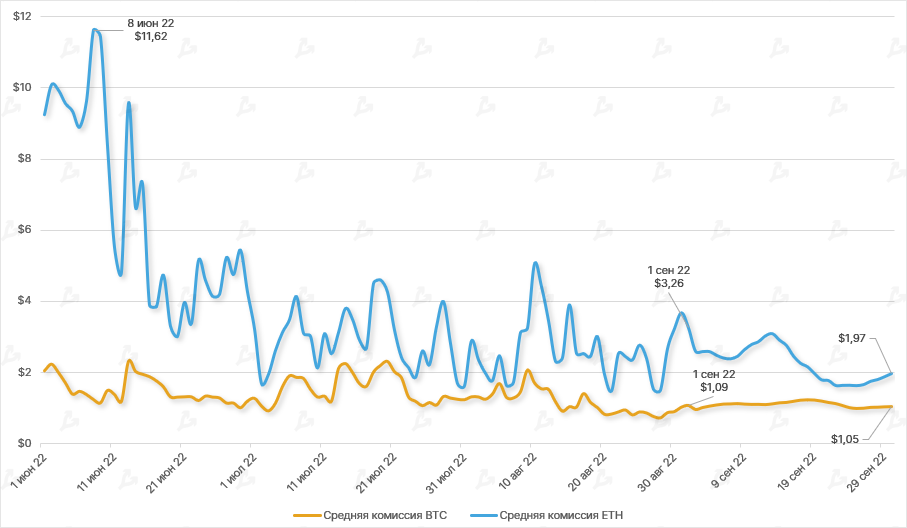
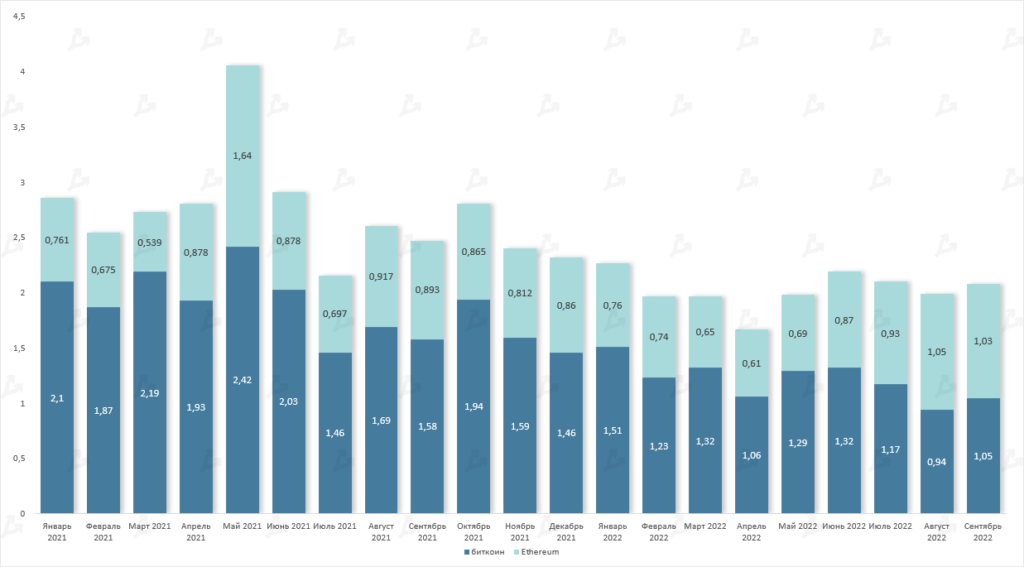
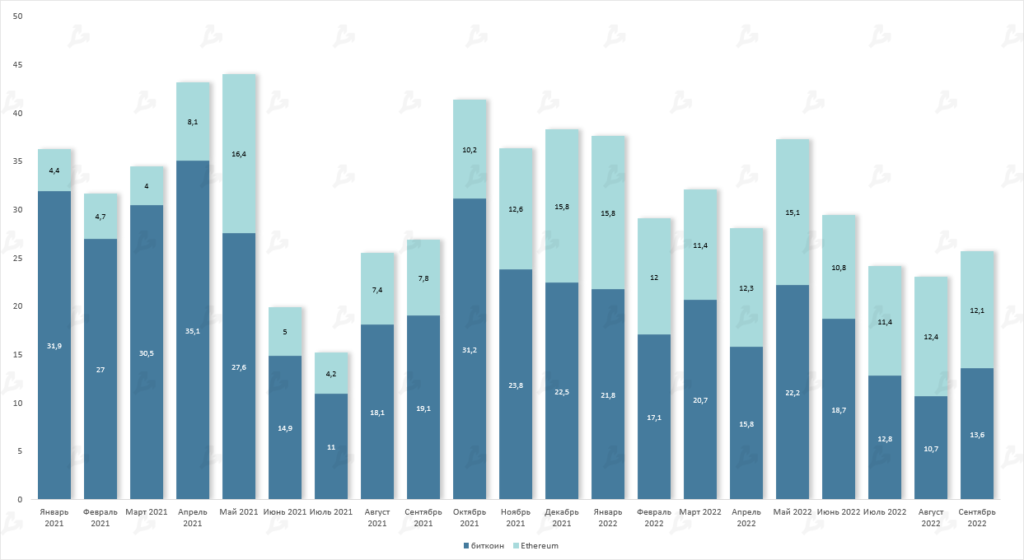
- Average Ethereum transaction fee remained well above Bitcoin’s, though it fell about 40% month-over-month to $1.97. Bitcoin’s fee remained nearly unchanged at around $1.
- Contrary to some expectations, The Merge did not solve scaling or lower fees; it simply moved Ethereum to a new consensus mechanism and laid groundwork for future fundamental upgrades.
Volume of trades

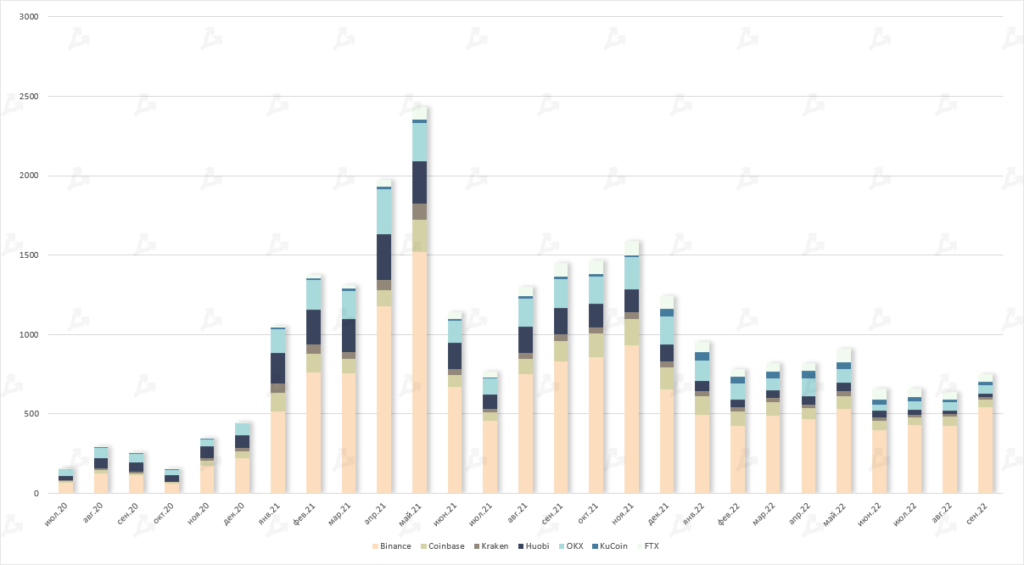
- September saw a notable rise in volumes on leading crypto exchanges, totaling $752 billion—the best in four months.
- Leader Binance saw its volume grow 27% (from $426b in August to $541b in September).
- OKX again surpassed FTX — $58b vs $52b. Similar dynamics were observed for the second month in a row. Coinbase’s figure was $48b.
Futures and options


- Investors returned their attention to Ethereum derivatives in anticipation of The Merge, which occurred on September 15. Futures volumes exceeded $1 billion, barely short of the previous month.
- Options remained in lower demand, but volumes rose amid market volatility.
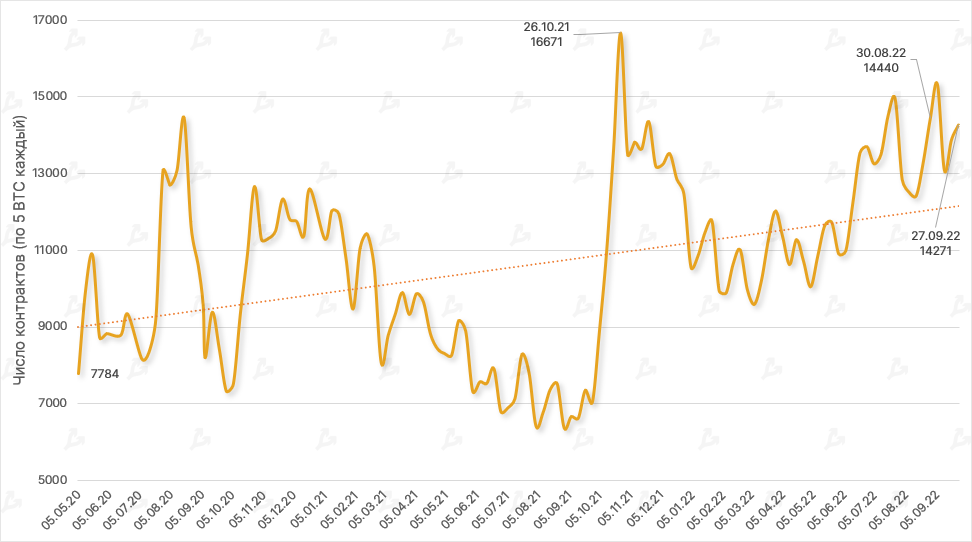
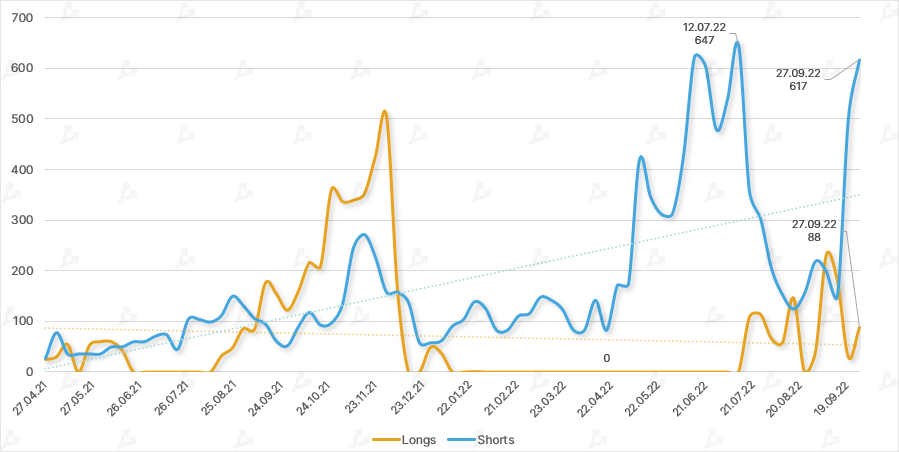
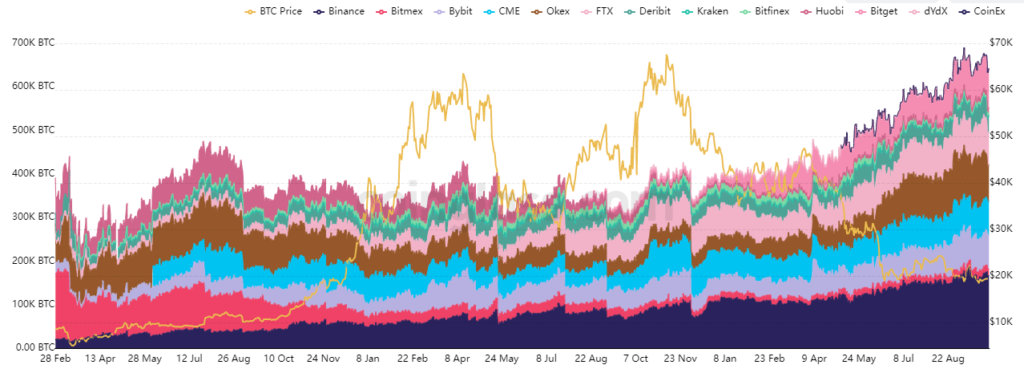
- Open interest in Bitcoin futures reached nearly 700,000 BTC in September—the highest ever.
DeFi

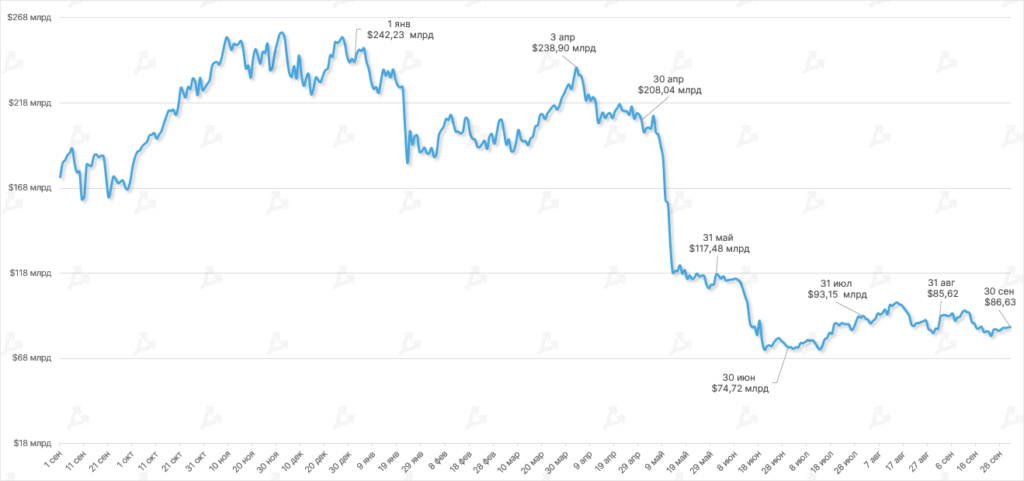

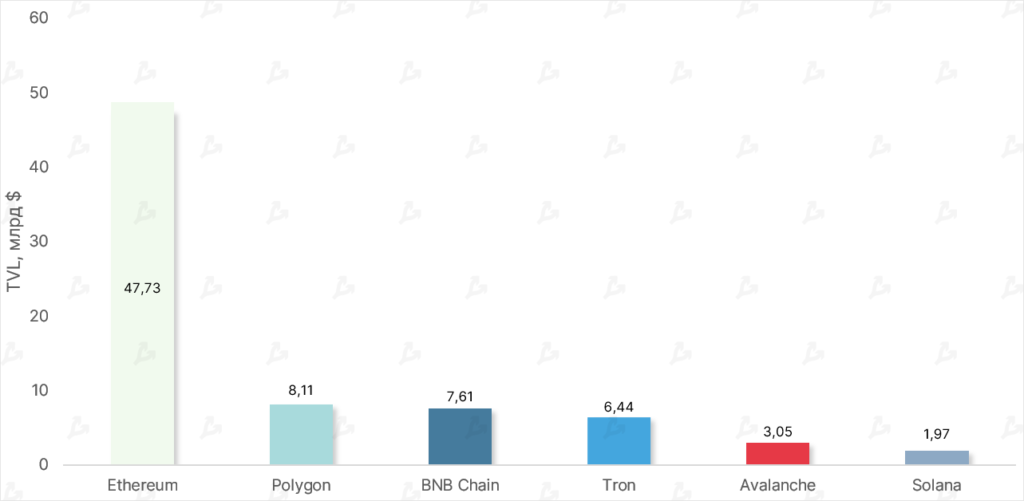
- In September, the TVL of DeFi smart contracts rose by 1.2% to $86.63 billion. In August the figure fell by 8%.
- Ethereum still accounts for more than 55% of the segment’s TVL ($47.73b). The crypto value of ETH held in DeFi is 35.91 million ETH (33.96 million ETH at the end of August).

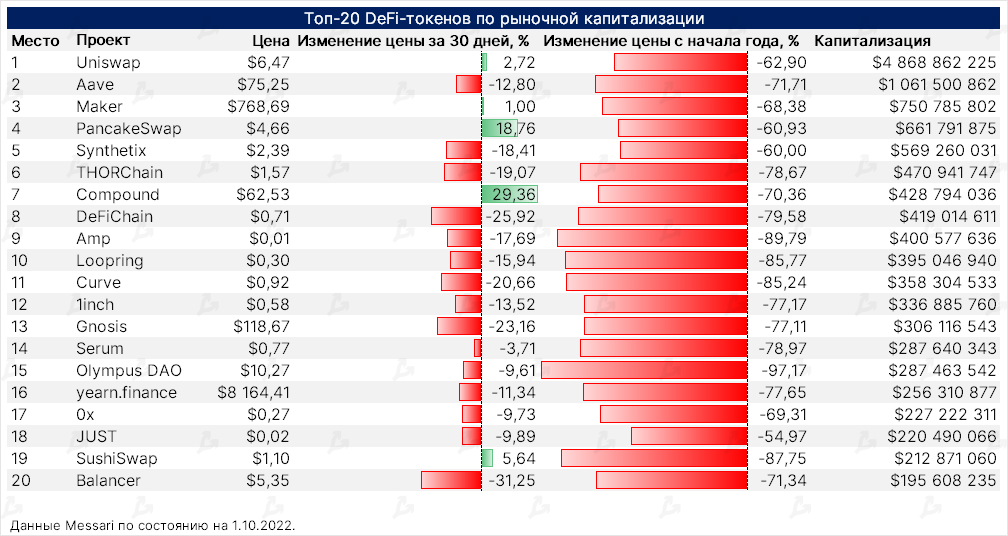

- Most DeFi token prices in top-20 by market cap were down in September. The biggest declines were Balancer (BAL) and DeFiChain (DFI) — down 31.25% and 25.92%, respectively.
- Compound (COMP) rose almost 30% in September, driven by the launch of a lending service for institutional investors.
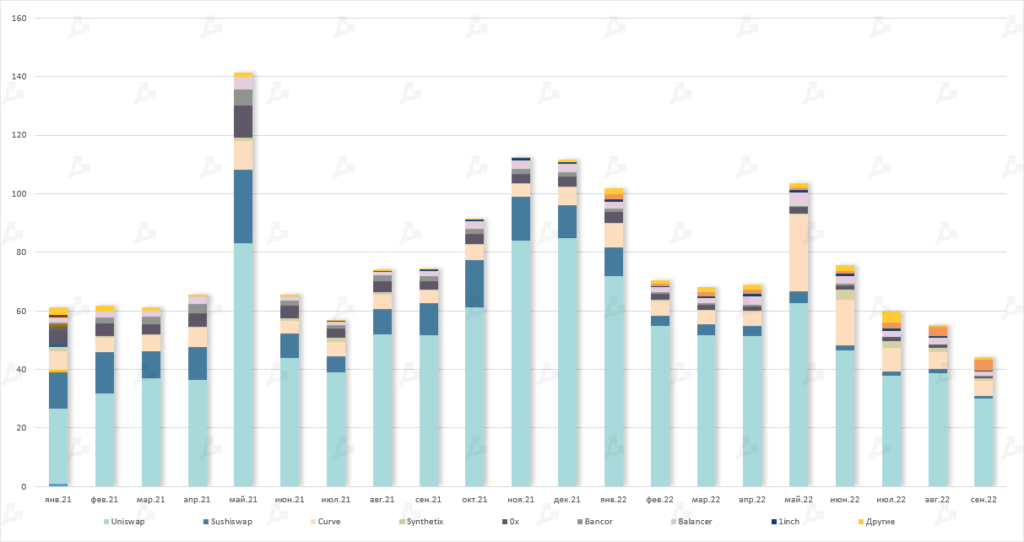
- PancakeSwap (CAKE) rose almost 19%. On September 22 the Uniswap decentralized exchange community approved a proposal to deploy its smart contracts on a network other than BNB Chain.
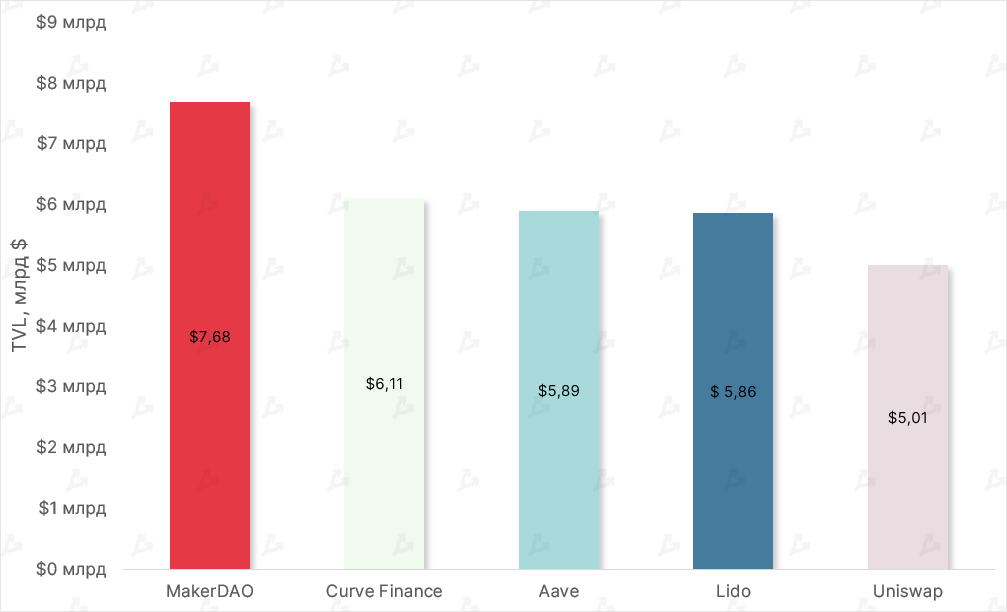
- Within Ethereum projects, MakerDAO remains the leader by TVL at $7.68b; Curve Finance is second with $6.11b. In the wake of The Merge, funds flowed into DeFi smart contracts on the decentralized exchange.

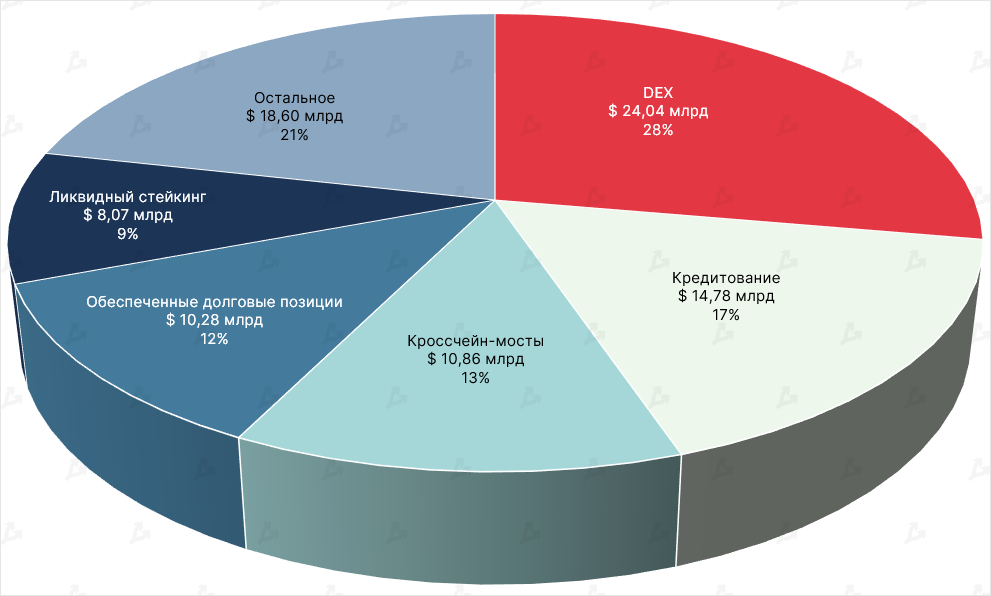

- DeFi exchange volumes continue to dominate total DeFi TVL — over 27% or $24.04b.
- Second place goes to lending protocols ($14.78b), third to cross-chain bridges ($10.86b).
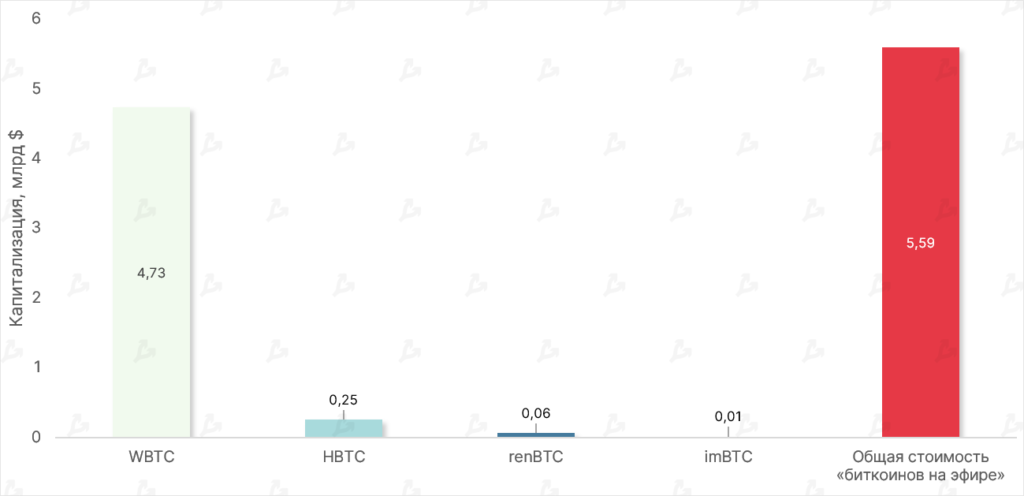
- By August, the combined market cap of “Bitcoin on Ethereum” fell to $5.59b. WBTC’s dominance index remained unchanged at 84%.

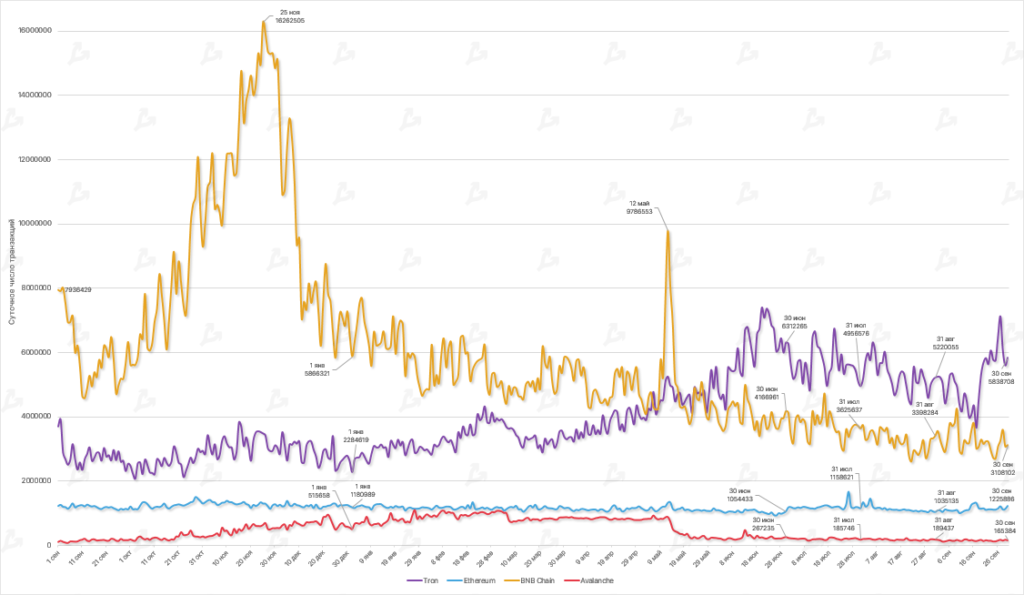
- In September daily transactions across networks (except BNB Chain) fell versus August.
- Tron remains the leader in on-chain activity, processing about 5.2 million transactions per day on average in August. In comparison, BNB Chain processed about 3.2 million.