


Despite the consolidation of the leading cryptocurrency, its on-balance volume indicator (OBV) suggests a rise to $130,000-$135,000 in the third quarter. Analyst Cas Abbe highlighted this potential.


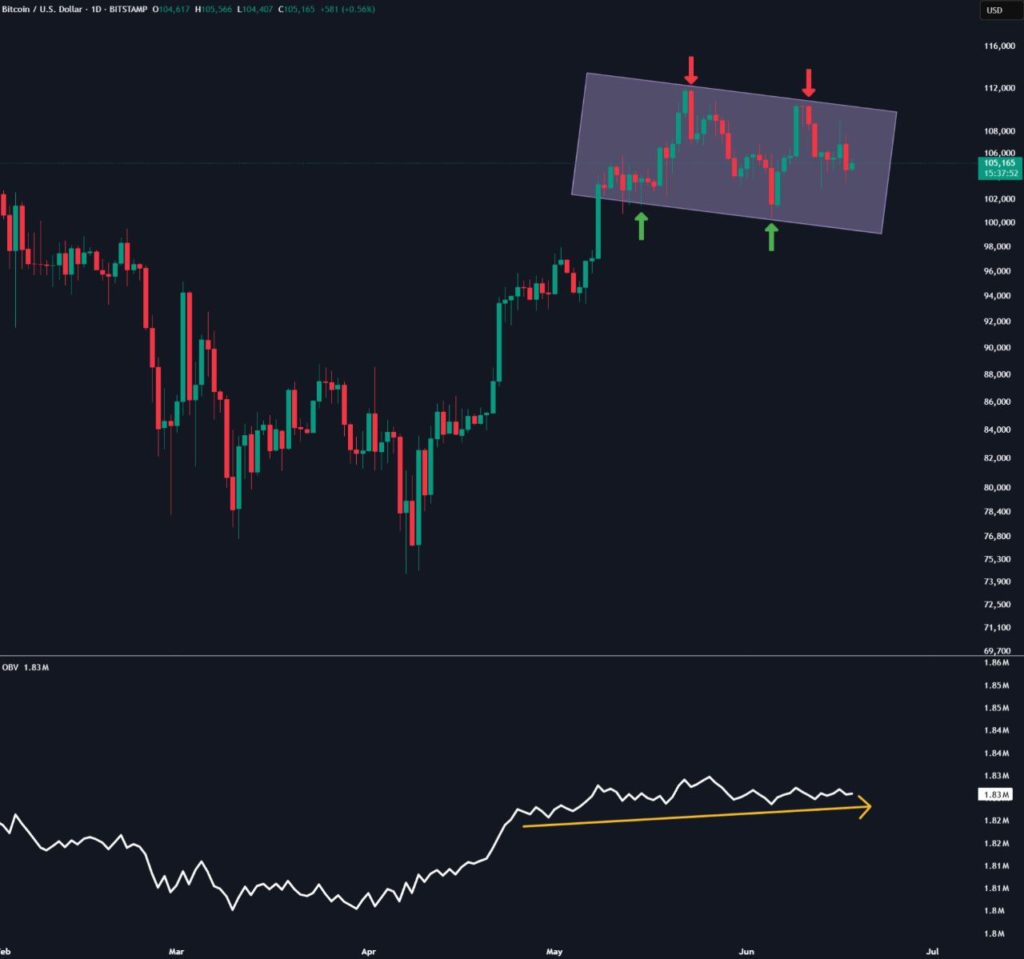
An increase in OBV indicates buyer pressure, while a decrease suggests seller dominance. If the indicator continues to rise, Bitcoin will break out of the $103,000-$111,000 range it has been in since May, the expert noted.
Historical price dynamics show that Bitcoin tends to make sharp breakthroughs when OBV growth confirms underlying buyer pressure during stagnation.


From March to April, digital gold traded sideways between $76,000 and $84,000 as OBV began forming higher lows. This was followed by a rally of nearly 60%, with the asset’s price exceeding $110,000 by May.
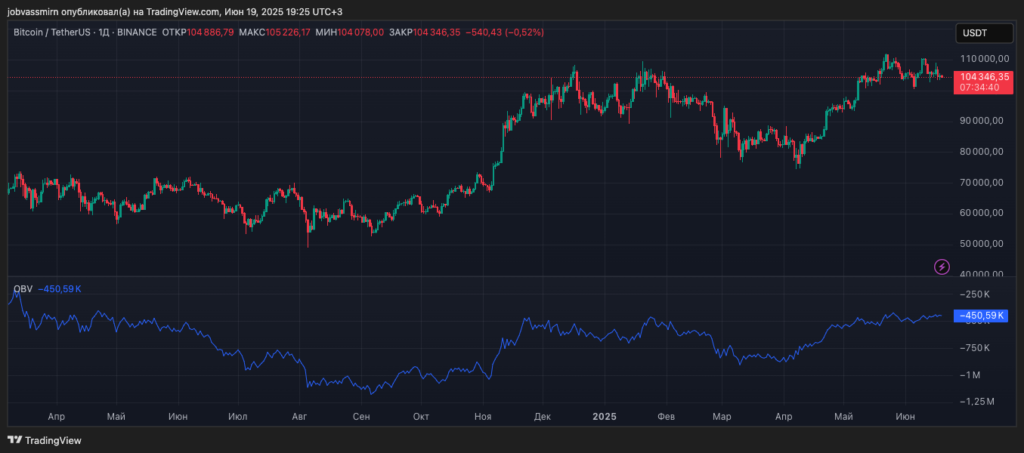
Meanwhile, a user named Bobby A noted the formation of a “bull flag” pattern on Bitcoin’s weekly chart.
$BTC is bullishly consolidating below an enormous level of converging resistance amid a highly fearful market while developing a weekly bull flag. Once it breaks free from this supply zone, it will no longer have any obstacles standing in its way from its 2021 cycle. Expansion ⚒️ pic.twitter.com/rH9slzz9sU
— Bobby A (@Bobby_1111888) June 18, 2025
The pattern suggests a potential rapid rise followed by consolidation.
In the short-term context, analyst and MN Trading founder Michaël van de Poppe suggested testing $106,000 and further growth, as the market has moved past the June meeting of the Fed and returned to “normal trading.”
FOMC show is over, which was a nothing burger, means that we’re back into the normal trading game for #Bitcoin.
I suppose we’ll see a test of $106K and breakout north in the coming days. #Altcoins are, again, outperforming. pic.twitter.com/xdY16BxA9Z
— Michaël van de Poppe (@CryptoMichNL) June 19, 2025
According to Binance founder Changpeng Zhao, the price of digital gold could reach $500,000 and even $1 million in the current cycle.
Earlier, Standard Chartered urged buying the leading cryptocurrency and forecasted its price to rise to $120,000 in the fourth quarter.