2022 in figures: Bitcoin crash, FTX collapse and the rise of L2 solutions
ForkLog’s year in review highlights the key shifts across crypto sectors in 2022.
Key Takeaways
- The year 2022 will be remembered for a broad market correction, with the second quarter marking Bitcoin’s worst performance on record.
- On‑chain indicators signal a “reset” for the market after a prolonged decline.
- The number of addresses with ≥ 1 BTC continues to grow exponentially.
- Bitcoin hashrate and mining difficulty rose by almost 50% over the year.
- Bitcoin miners’ revenue fell by 43%.
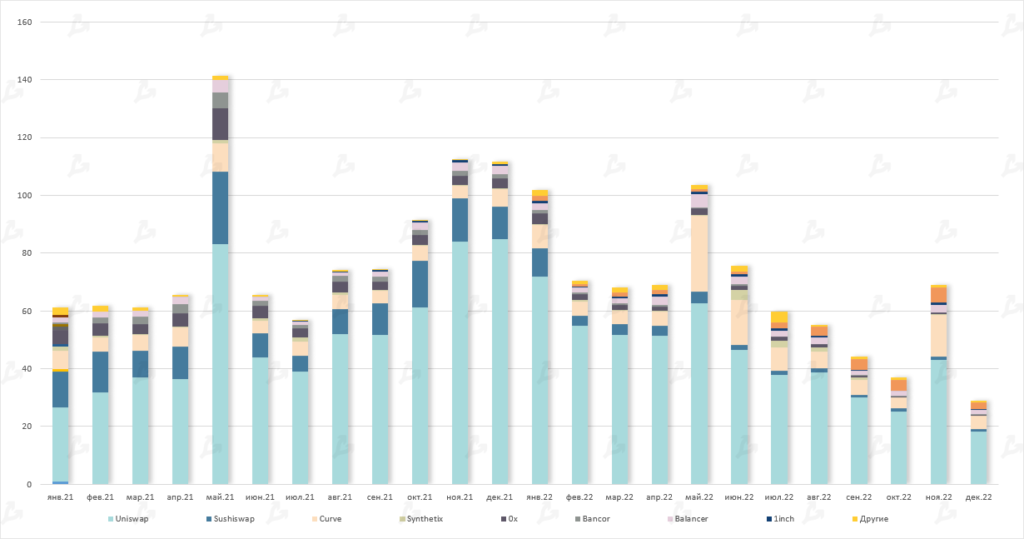
- Trading volume on spot exchanges fell by 50%, while in the DEX segment it declined by 32%.
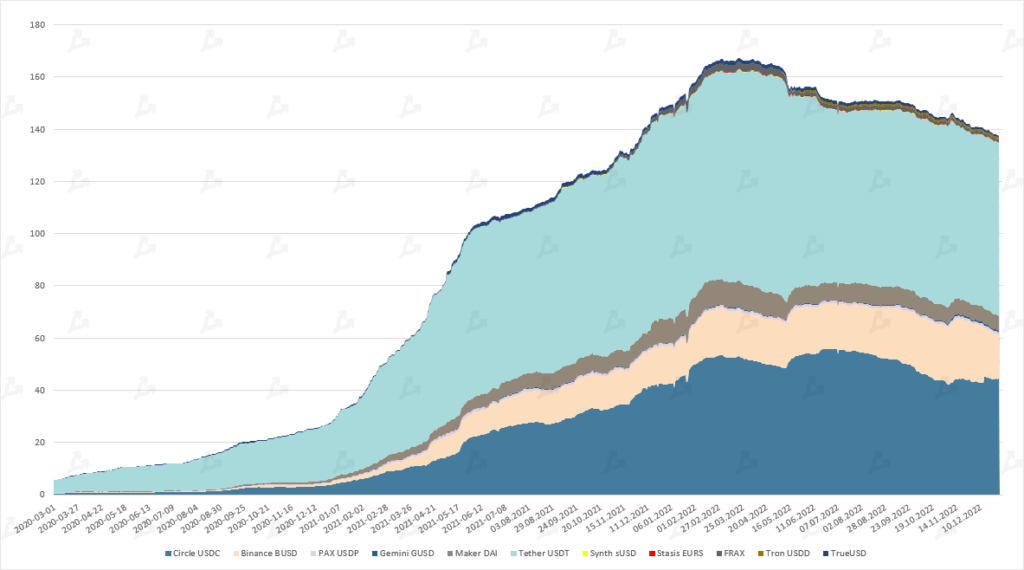
- The community witnessed the collapse of the algorithmic stablecoin UST with a market cap of $18 billion.
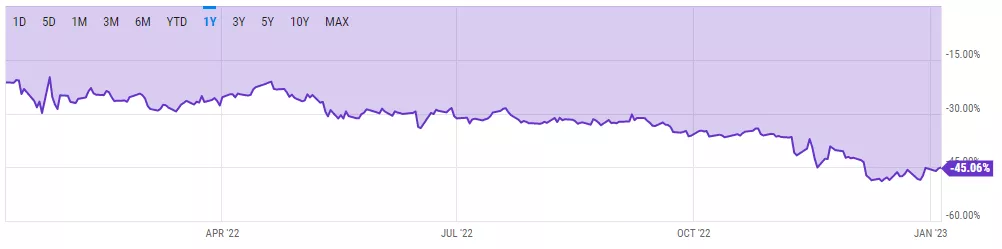
- The Grayscale GBTC discount fell to a record 48%.
- Ethereum issuance pace slowed significantly amid the network’s transition to the Proof-of-Stake consensus.
- Over 12 months the volume of assets locked in DeFi smart contracts fell by 75%.
Leading asset dynamics
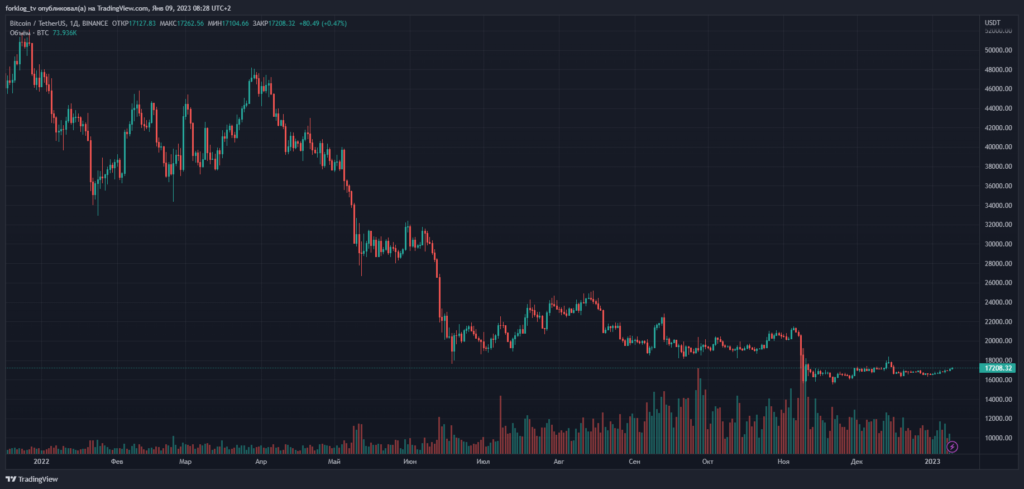
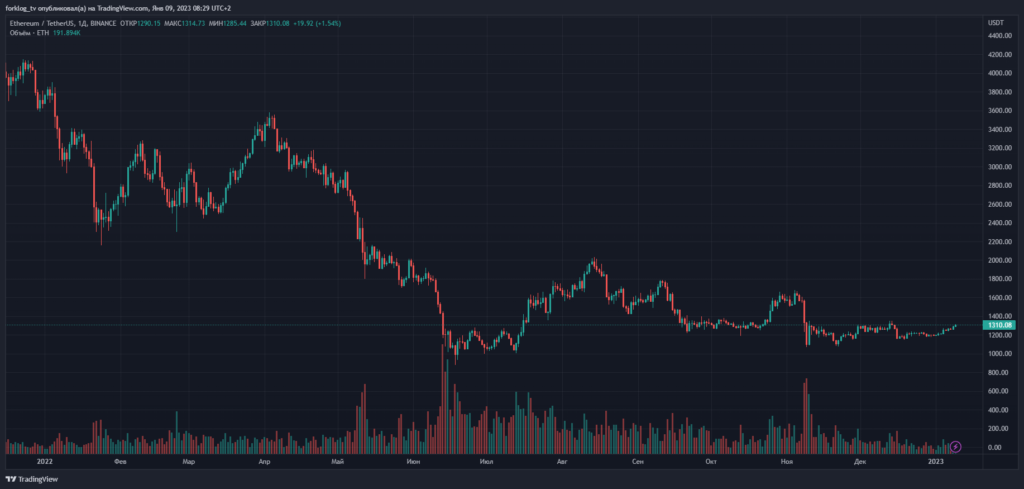
2022 was a challenging year for the leading cryptocurrencies and the market as a whole. After peaking in November 2021, Bitcoin and Ethereum retraced during the year, falling 64.2% and 67.4% from their highs respectively. Total market capitalization declined from $2.2 trillion to $820 billion.
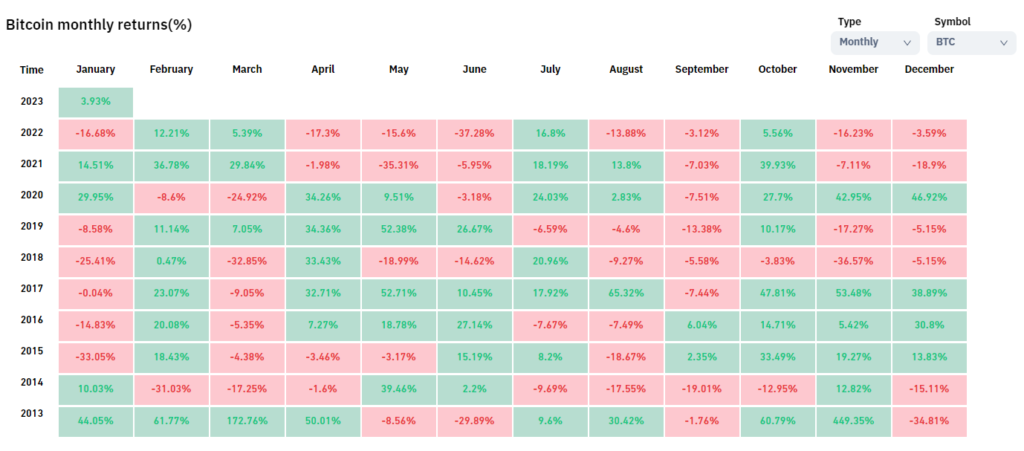
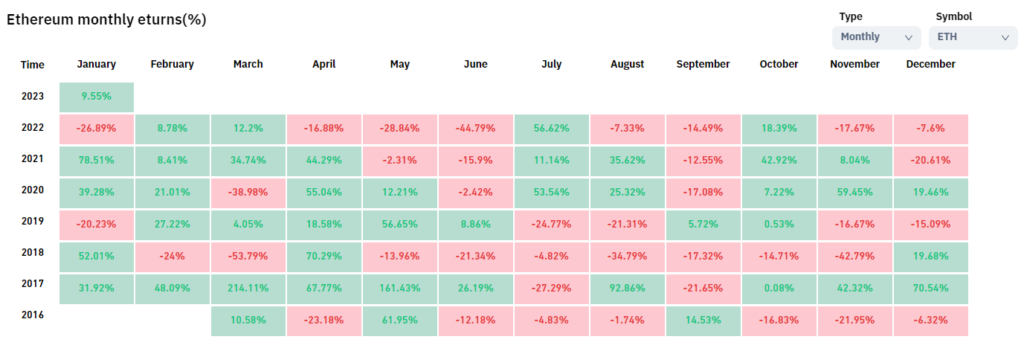
A closer look shows that the summer period was the weakest for the leading cryptocurrencies, with the second quarter recording an all-time low. The annual lows were Bitcoin at $15,476 in November and Ethereum at $881 in June.
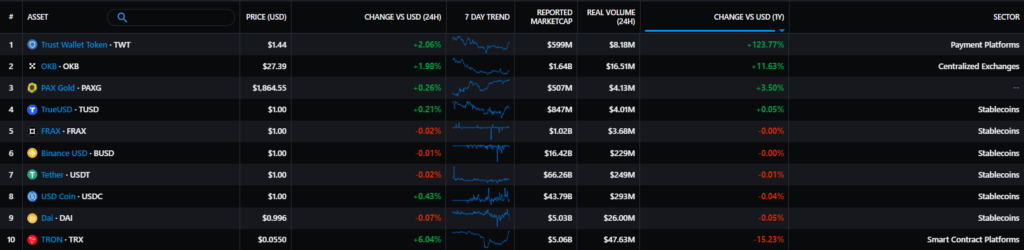
Against a backdrop of a crisis of trust in centralized exchanges, triggered by the collapse of several firms and the once-dominant platform FTX, non-custodial wallets such as Trust Wallet gained popularity. Notably, the utility token of the Trust Wallet project (TWT) was the only mid-cap asset to post a year-on-year gain of more than 120%. The native token of the OKX exchange (OKB) also showed positive momentum.
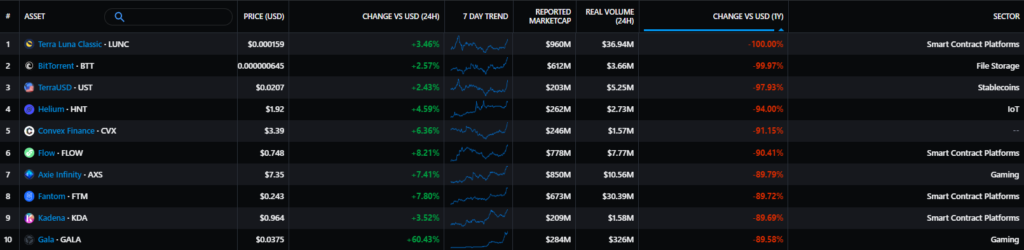
The list of underperformers in 2022 was even more striking. Led by the collapsed Terra ecosystem’s LUNA collapsed Terra ecosystem, whose collapse sparked the largest crisis. The stablecoin TerraUSD (UST) is also listed here. You can read about those days in the May review. Among other underperformers that shed around 90% of market cap were Flow, Solana, Fantom, Axie Infinity, Sandbox, Gala and others.
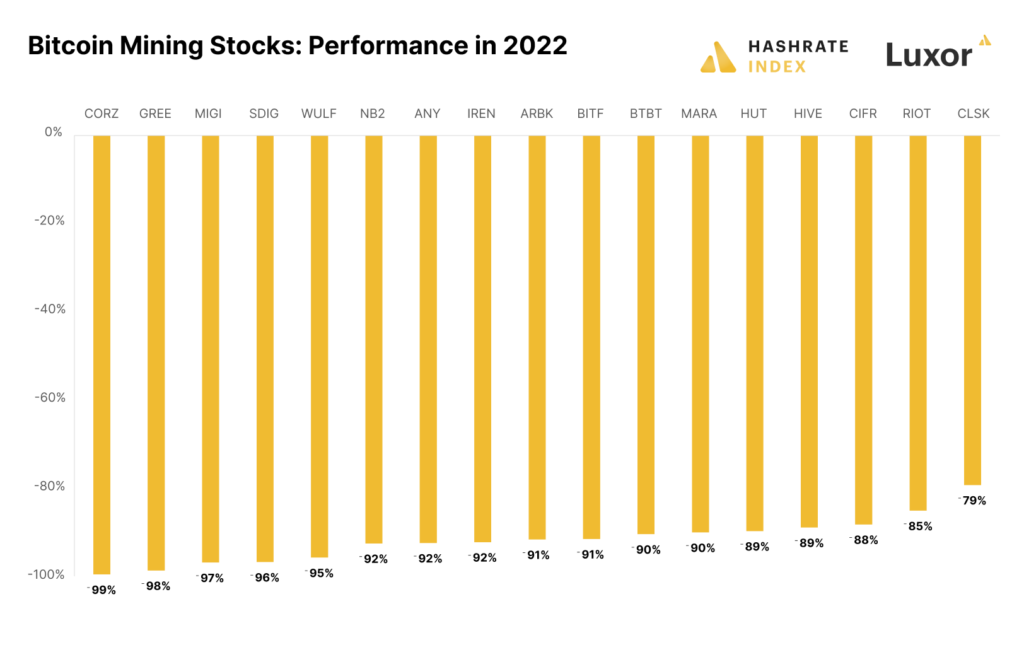
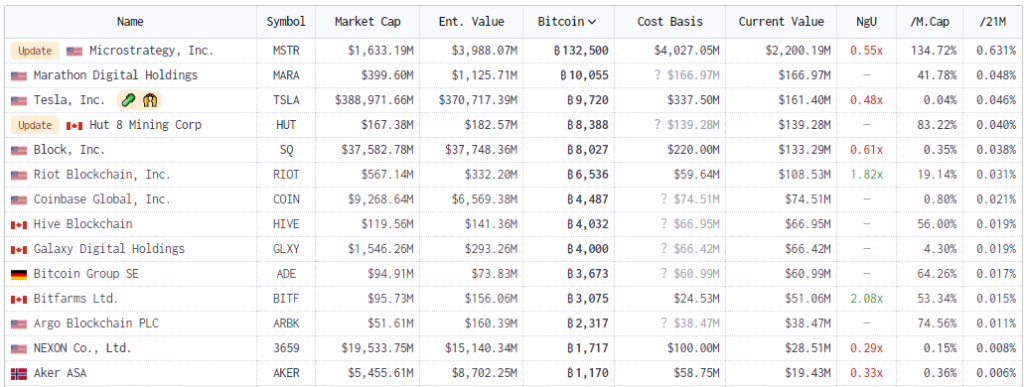
Publicly traded mining and crypto-related firms
2022 proved to be a real test for publicly traded miners and crypto-related companies. Higher mining costs, energy pressures and the inability to meet debt obligations due to falling prices exacerbated an already bleak situation.
Market mood, correlations and volatility
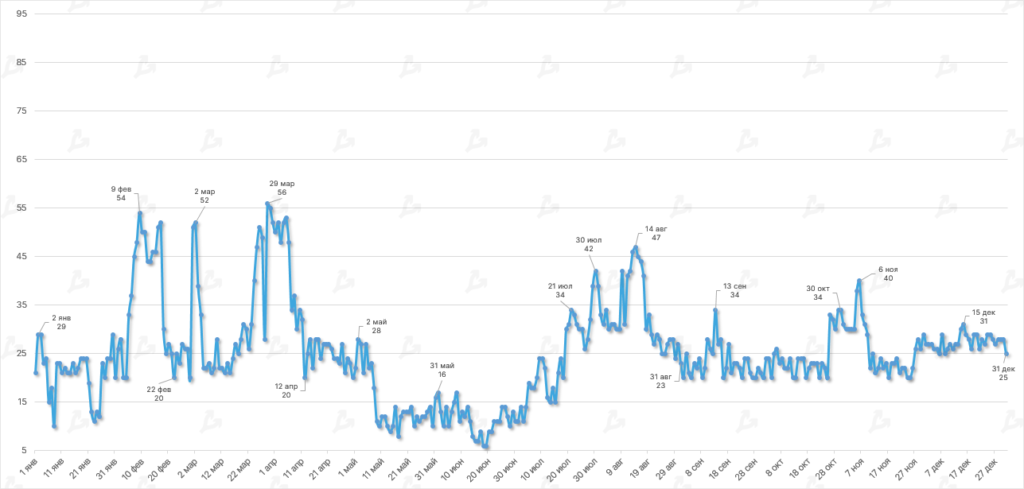
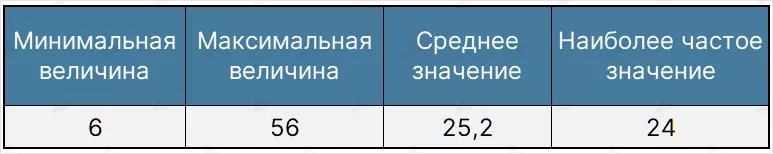
- Since April 2022 the Fear and Greed Index has largely stayed in the “Fear” zone, briefly touching the neutral range only once. The period’s average reading was 25.2.
- The indicator’s maximum reading was recorded at the end of March when Bitcoin prices surpassed the $47,000 level. The nadir occurred in mid‑June — when Bitcoin fell below the peak of the previous cycle ($20,000).
- Investor sentiment was influenced not only by intra-market events (Terra collapse, FTX collapse) but also by macroeconomic factors (the U.S. Federal Reserve’s policy).
On-chain data
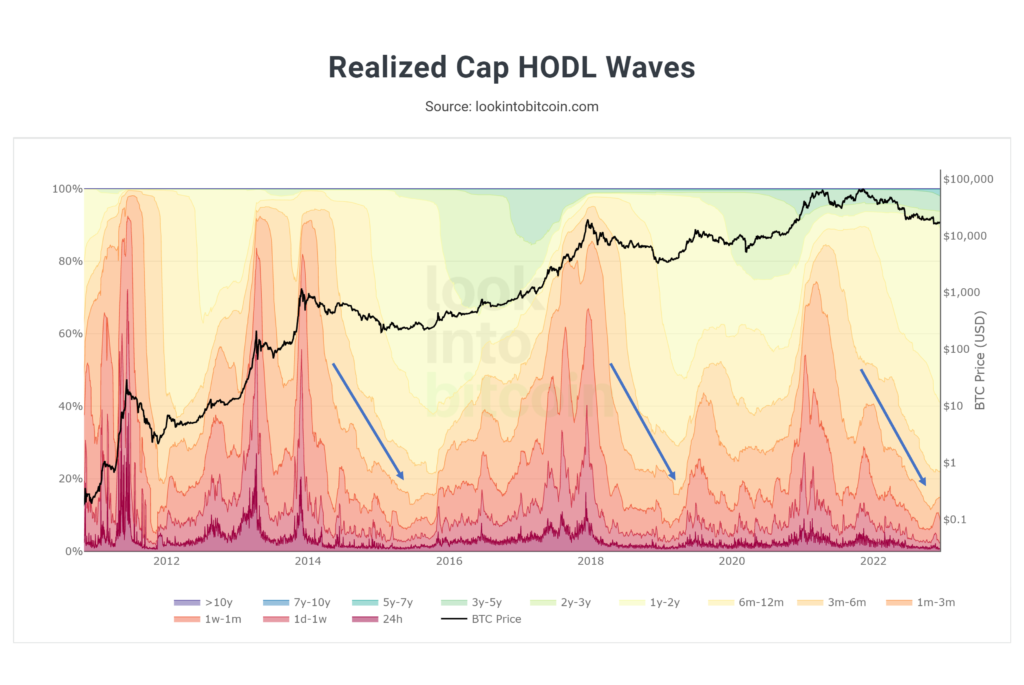
- Bitcoin’s realized-price weighted HODL waves point to a full “reset” of the market after the late-2021 peak (red and yellow bands). Such cooling has occurred at the bottoms of prior bear cycles.
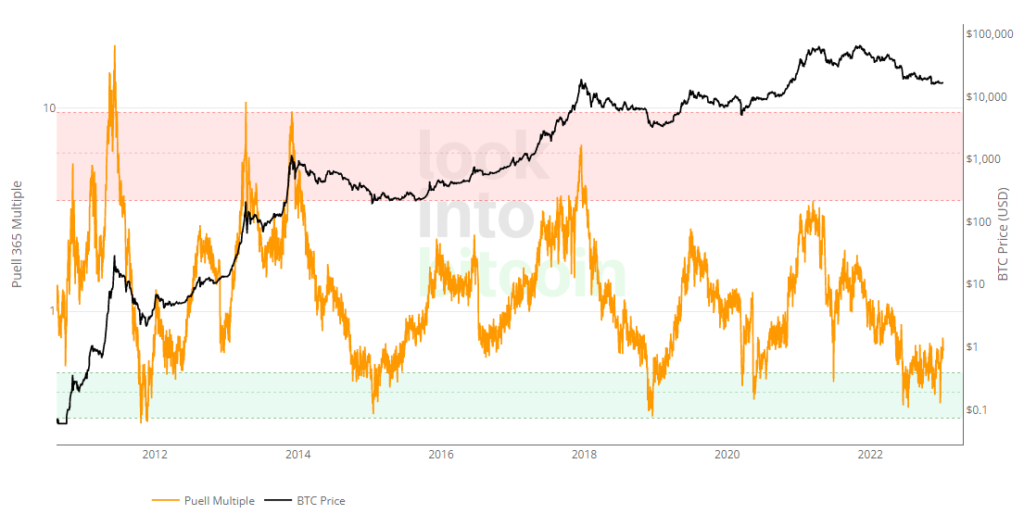
- From the second half of 2022 the Puell Multiple (The Puell Multiple) has intermittently breached the green zone of deeply oversold territory.
- In early January 2023 The Puell Multiple reached 0.74, corresponding to May readings. This could herald the start of a new market cycle.
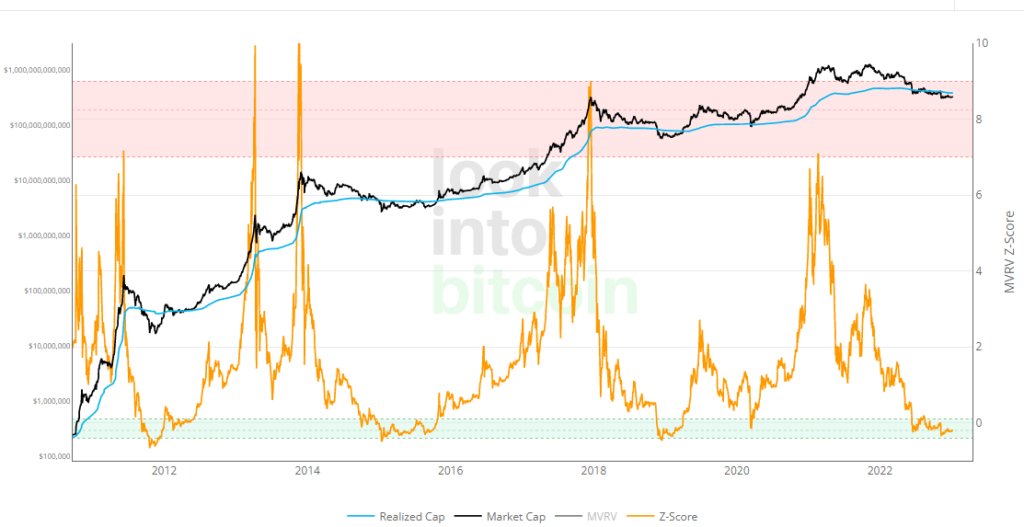
- The MVRV Z-Score indicator has been in the “green” zone since the latter half of last year, signalling unrealised losses for many market participants and active accumulation of cheap digital gold.
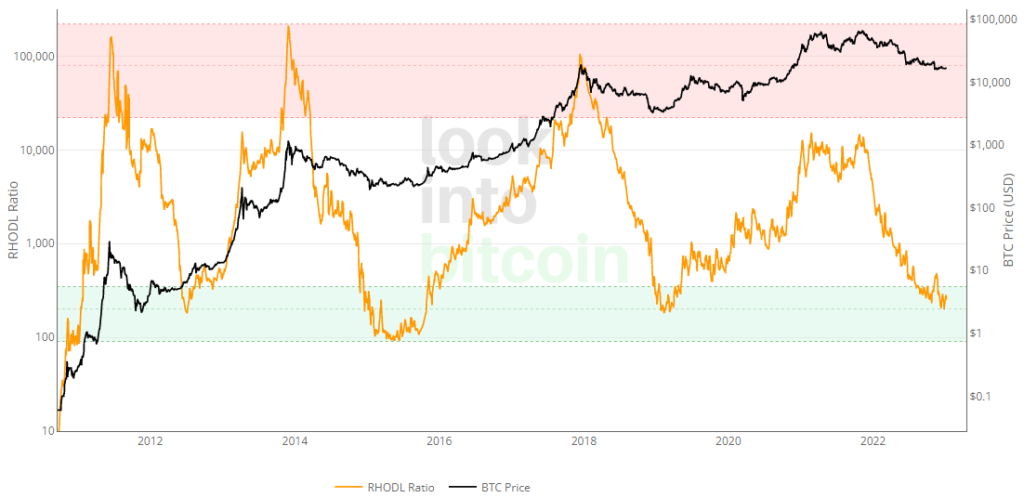
- A similar picture for the RHODL Ratio suggests a favorable period for Buy & Hold and/or DCA strategies.
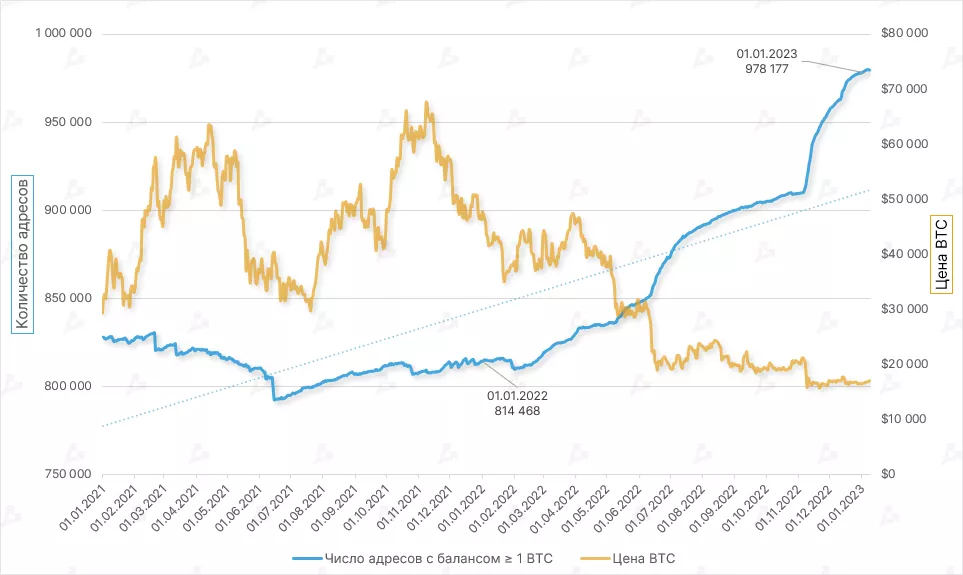
- In 2022 the number of addresses with a balance ≥ 1 BTC grew by 20%. The metric is rising exponentially, approaching the 1 million mark. This is a positive signal of rising participation and accumulation by those who believe in Bitcoin’s long‑term potential.
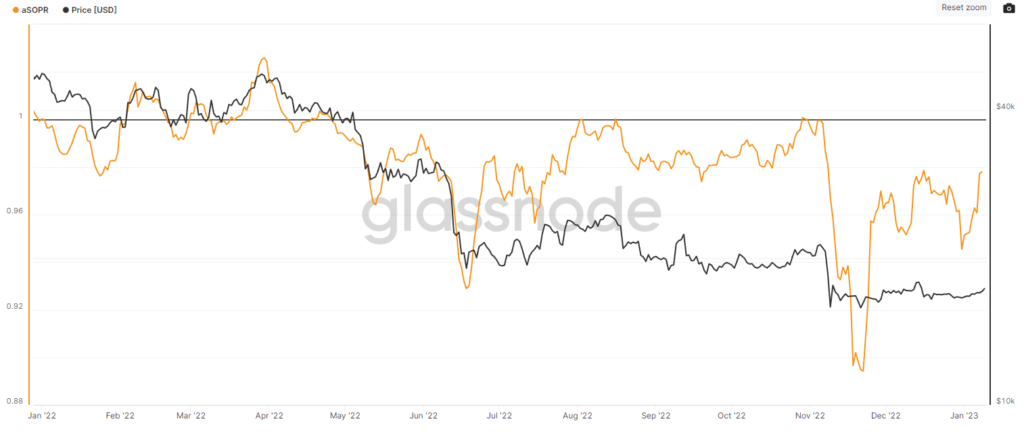
- In the second half of 2022 the aSOPR (7 MA) breached the 1 level only infrequently, signaling persistent bearish sentiment and that many market participants are still realising losses.
Ethereum
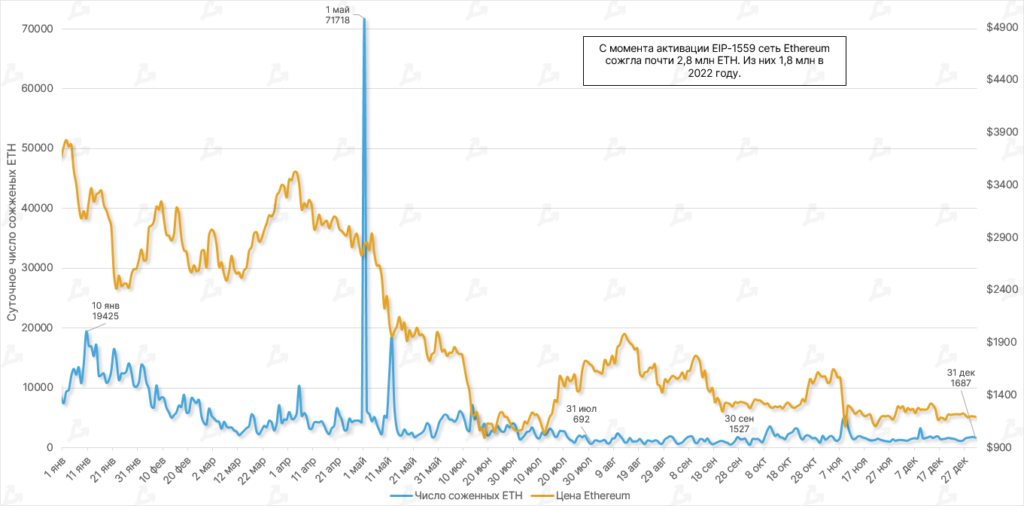
- Since the activation of EIP-1559, the Ethereum network has burned nearly 2.8 million ETH. Over 2022 the network burned about 1.8 million tokens. In Q2 the pace slowed as prices slid for the second-largest cryptocurrency.
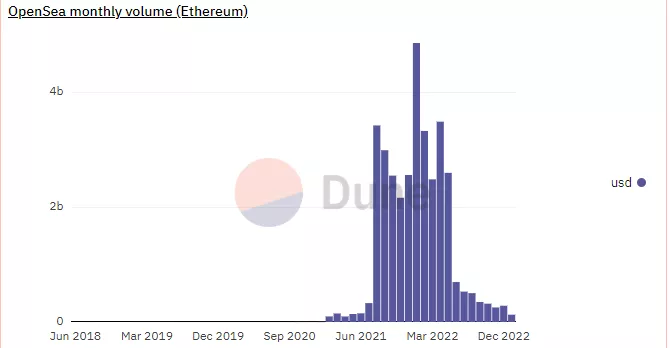
- According to Ultrasound Money, the largest number of tokens (~254,000 ETH) were burned in peer-to-peer transactions. NFT marketplaces OpenSea and Uniswap v2 ranked second and third with ~230,000 ETH and ~145,000 ETH respectively.
- In September developers transitioned the blockchain to the Proof-of-Stake consensus. Since then issuance rose by 3,146 ETH. If the network had continued with Proof-of-Work, the figure could have exceeded 1.38 million ETH.
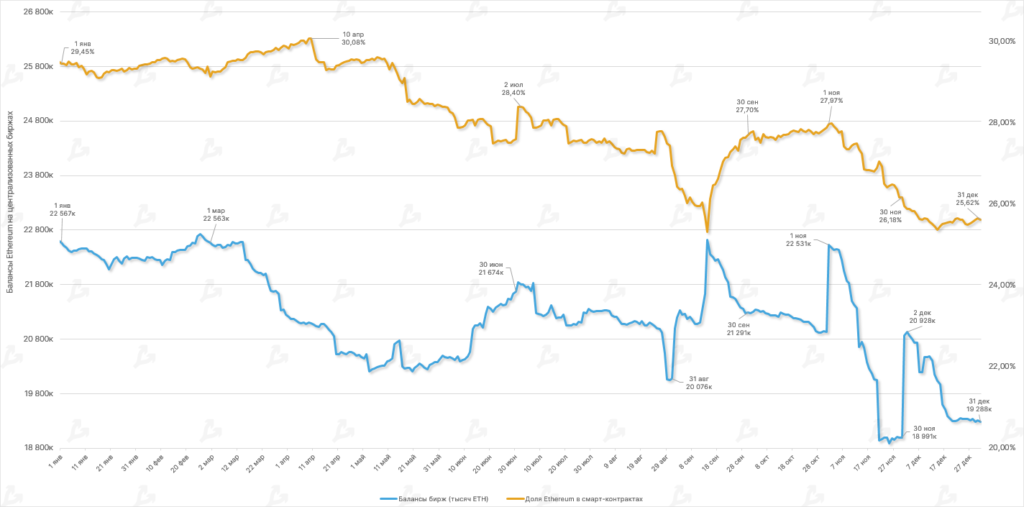
- By year end the share of cryptocurrency locked in smart contracts of decentralized apps stood at 25.62% — down almost 4% from the year.
- Over 12 months total Ethereum on centralized platforms declined by 14.5%, to ~19.3 million ETH.
- The same dynamics were driven not only by market-wide declines but also by “black swans” that shook investor confidence. In particular, Terra’s collapse and the FTX collapse.
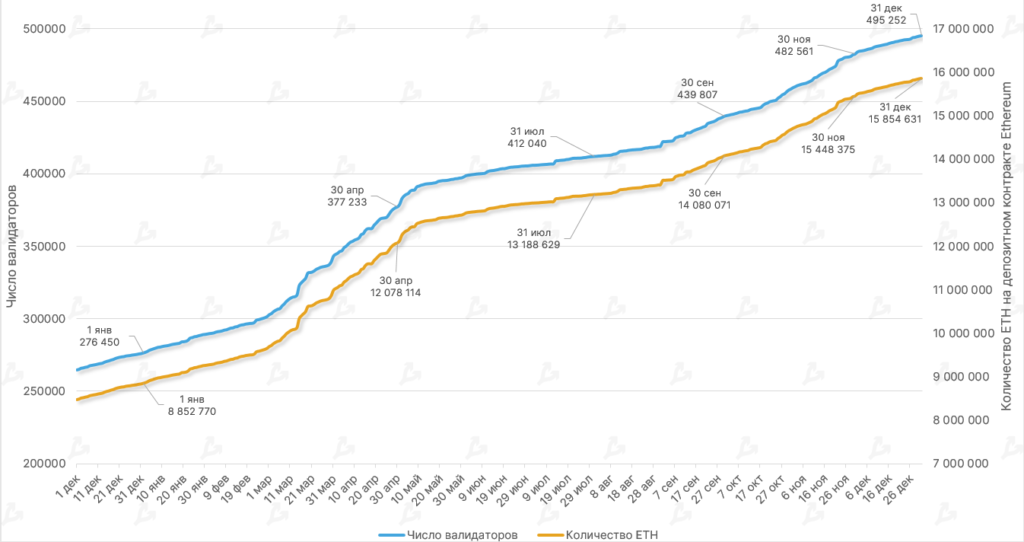
- During 2022 the number of validators rose by 79%, reaching 495,252 by December. The amount of assets in staking surpassed 15.85 million ETH — an inflow of roughly 7 million tokens over the period.
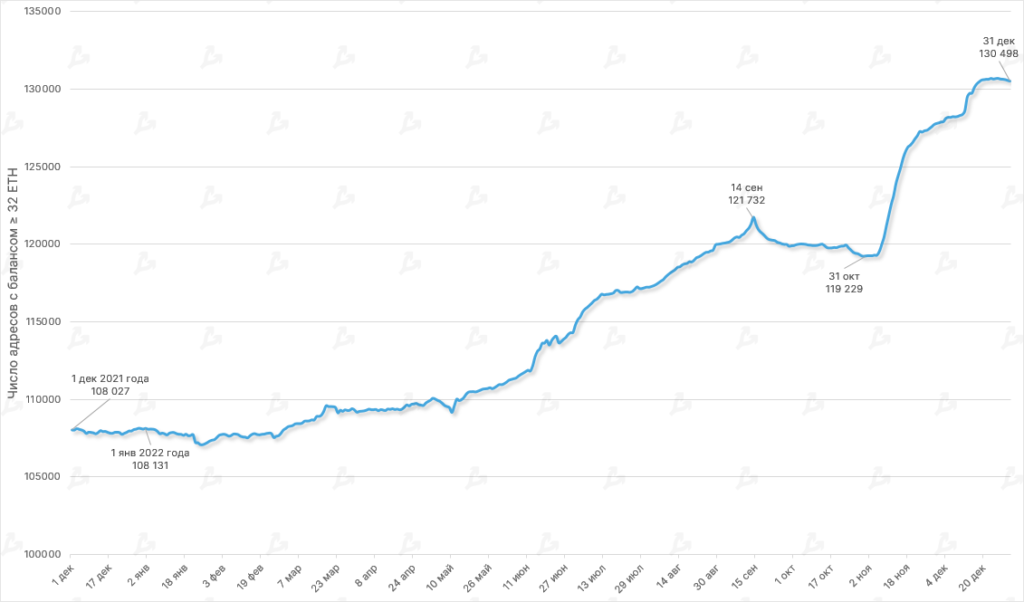
- Over 12 months the number of unique addresses that deposited 32 ETH or more grew by 20%. The strongest growth occurred from November to December, linked to testing withdrawals from staking and the announced Shanghai hard-fork timeline.
Lightning Network
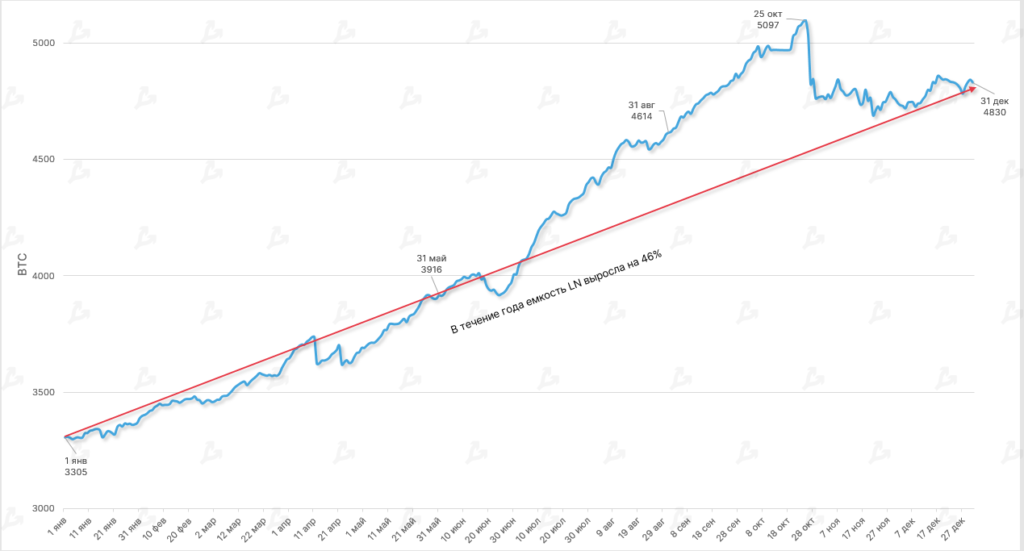
- By the end of 2022 the Lightning Network capacity grew by 46%, to 4,830 BTC. This was driven by the growth of the ecosystem and the launch of initiatives such as integration with the Cash App.
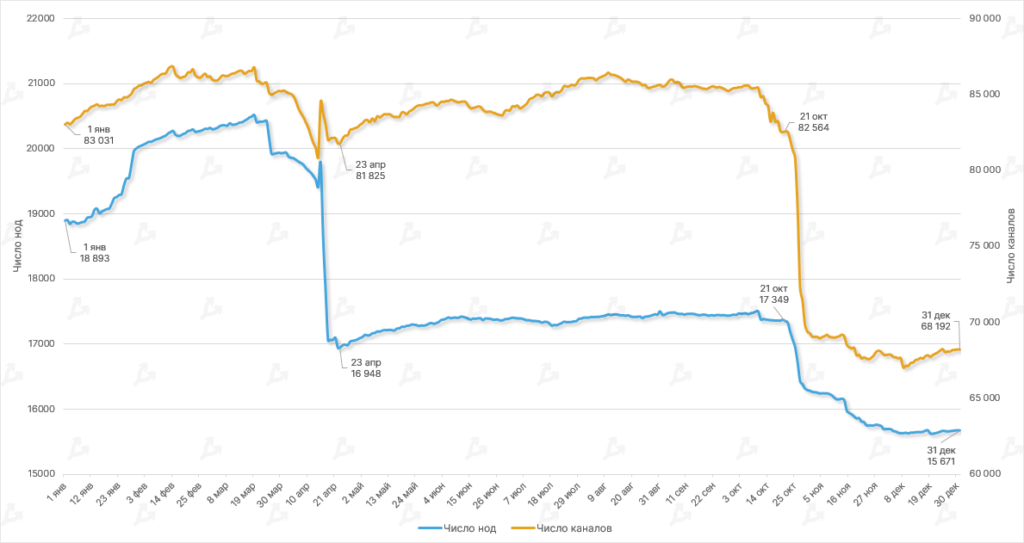
- The number of nodes declined by 17%, and the number of channels by almost 18%. The declines were driven by a critical bug that caused a network outage in October, which took three weeks to fix.
Mining, hashrate, fees
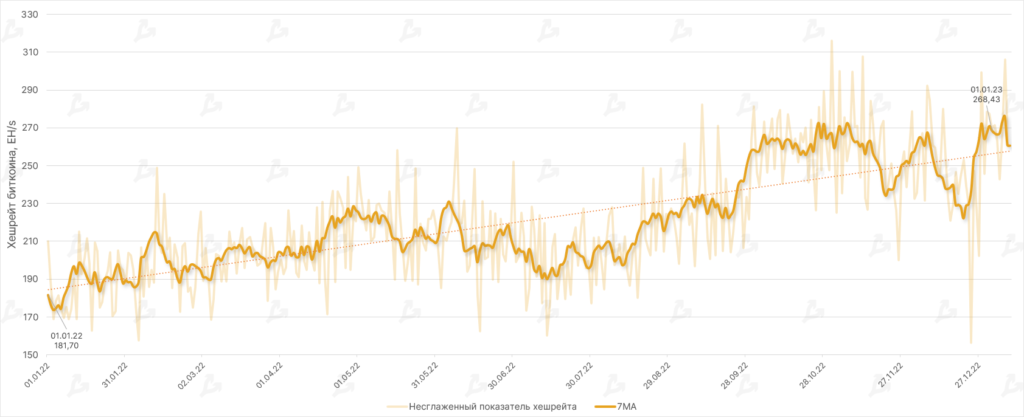
- Over 2022 Bitcoin’s hashrate (7‑MA) rose by 47.7%, even as the price of the cryptocurrency fell. The rise is likely due to newer, more productive equipment and market participants’ confidence in Bitcoin’s long‑term prospects.
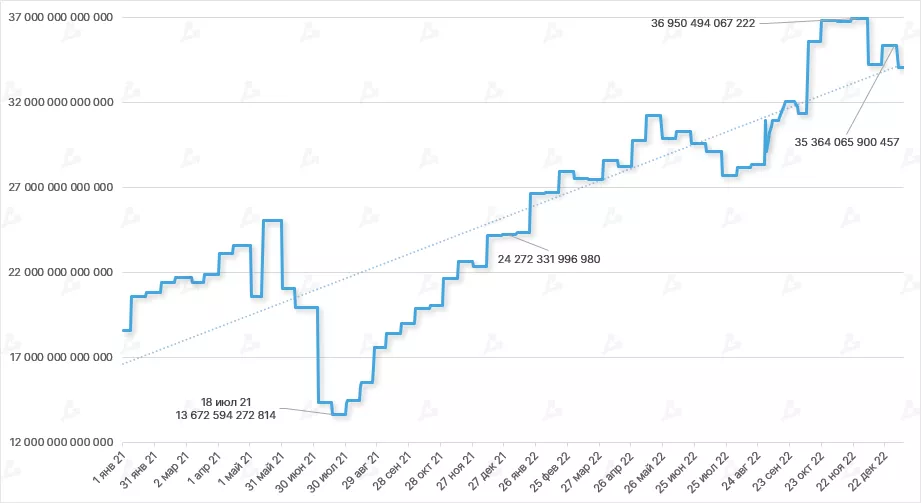
- Following the computational power, mining difficulty rose by 46% for the year, exceeding 35 T.
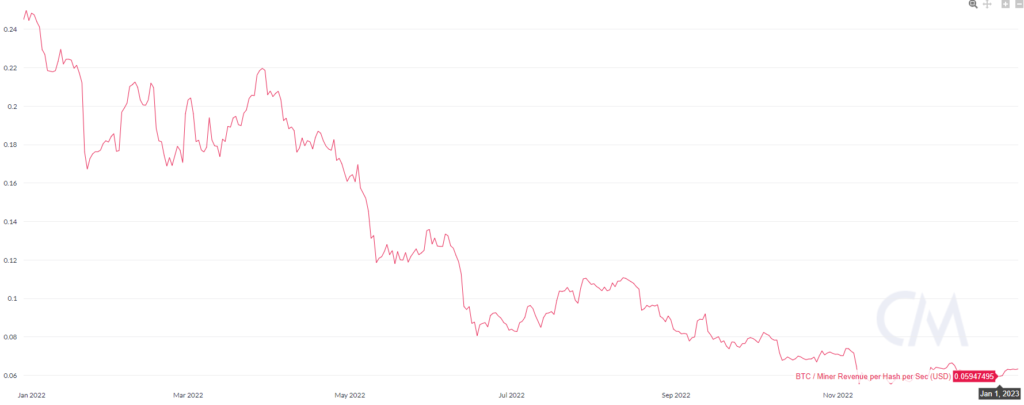
- Falling Bitcoin price amid rising hashrate and difficulty pressured the “hashprice.” The metric hit record lows, falling to $0.055 in early November. As a result, publicly traded miners sold almost all Bitcoin mined in 2022.
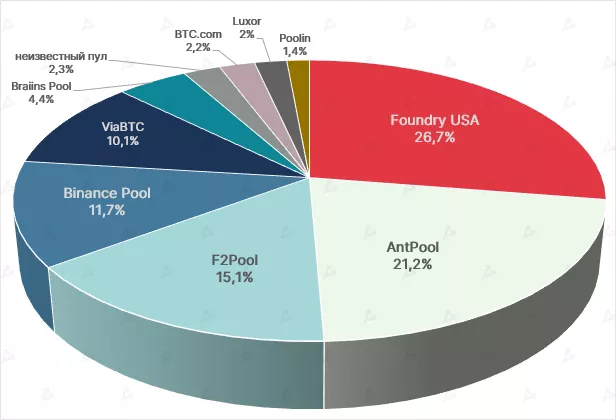
- Foundry USA cemented its lead among the largest Bitcoin pools. At the start of the year its share was 16.5%; by year-end it exceeded 26%.
- Many market participants faced debt service issues, yet the share of public companies in network hashpower reached 25%.
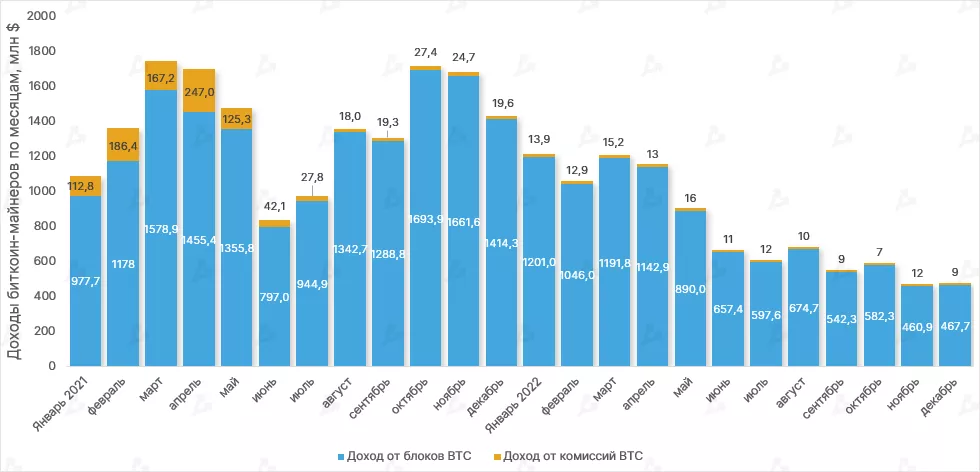
- December miner revenues totaled $477 million, up 1% from November. The share of transaction fees in revenue was 2%.
- For the full year 2022 miners produced $9.45 billion, down 43% from 2021 ($16.7 billion). The decrease was driven by price declines and higher hash rate and difficulty.
- Fees earned by Bitcoin miners in 2022 amounted to $142.2 million, down 86% versus the previous year (about $1 billion), partly explained by lower average on-chain activity in a bear market.
Trading volume
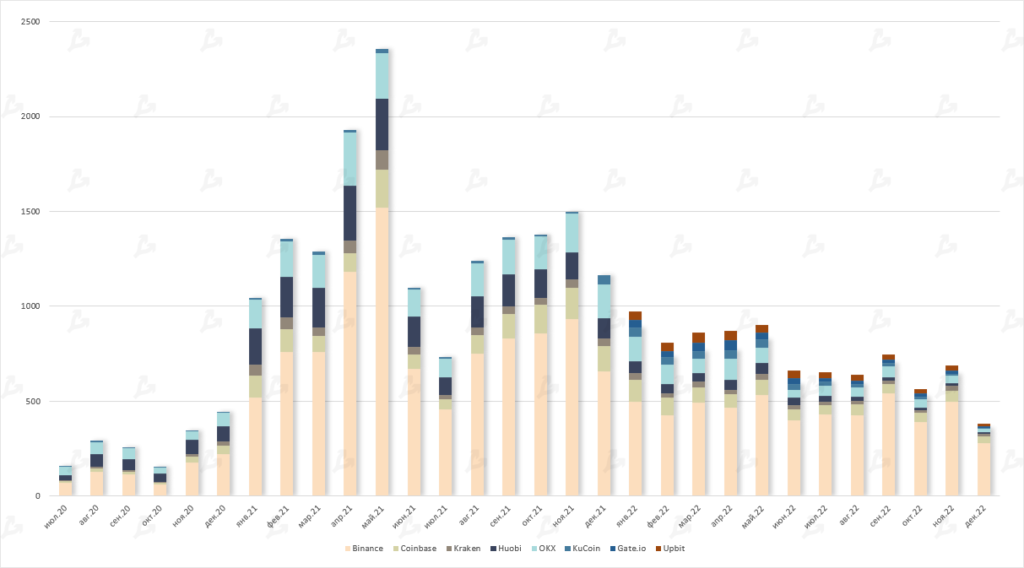
- December trading volumes on leading crypto exchanges fell to a two-year low around $380 billion.
- The full-year 2022 total was $8.4 trillion — 50% below 2021, a logical outcome of the market correction.
- After the FTX collapse, exchange market shares were redistributed among competitors. By month end, the top-3 were Binance, Coinbase and OKX.
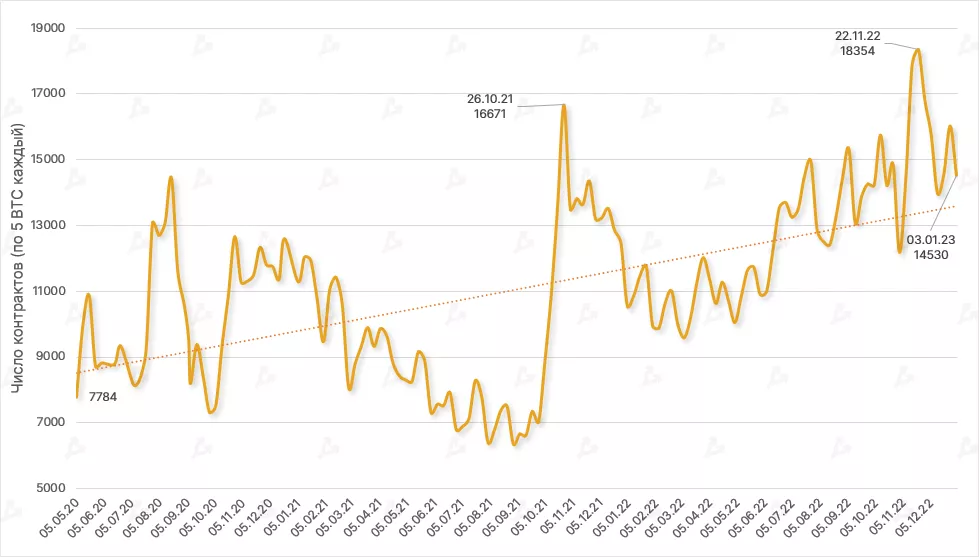
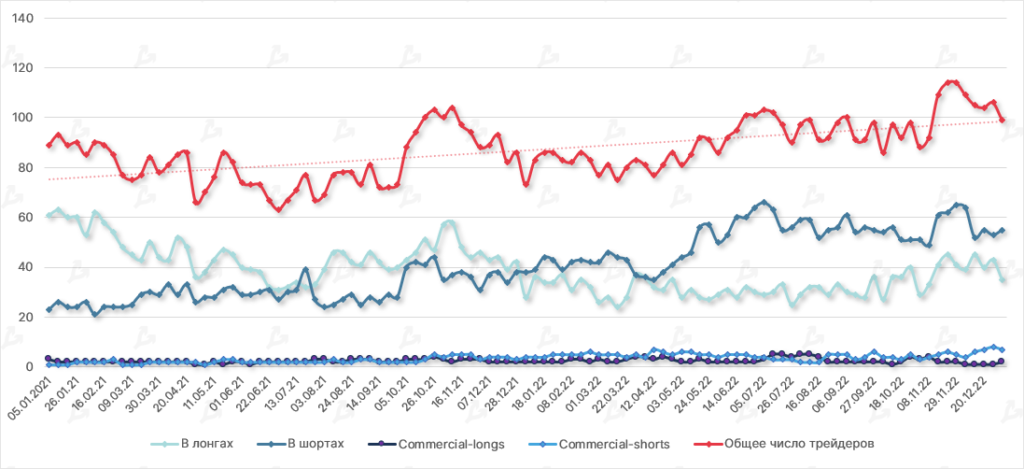
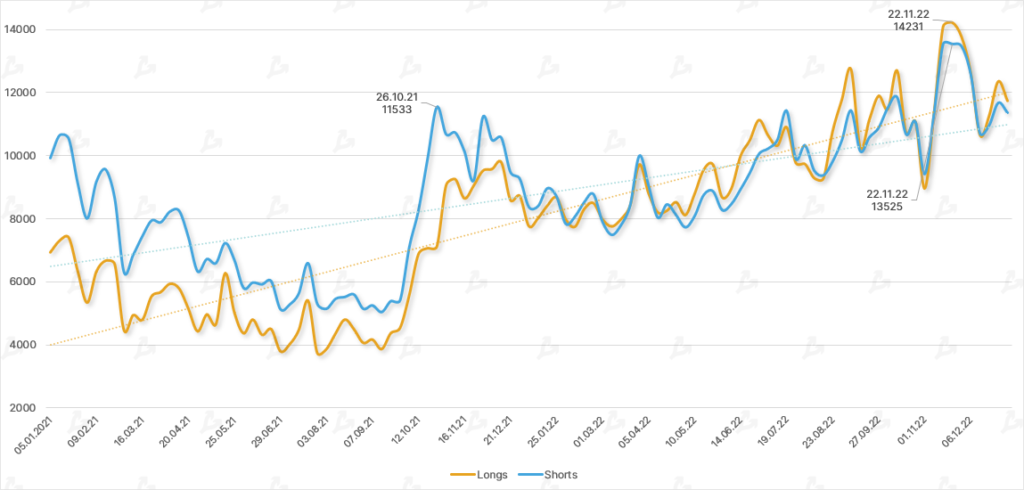
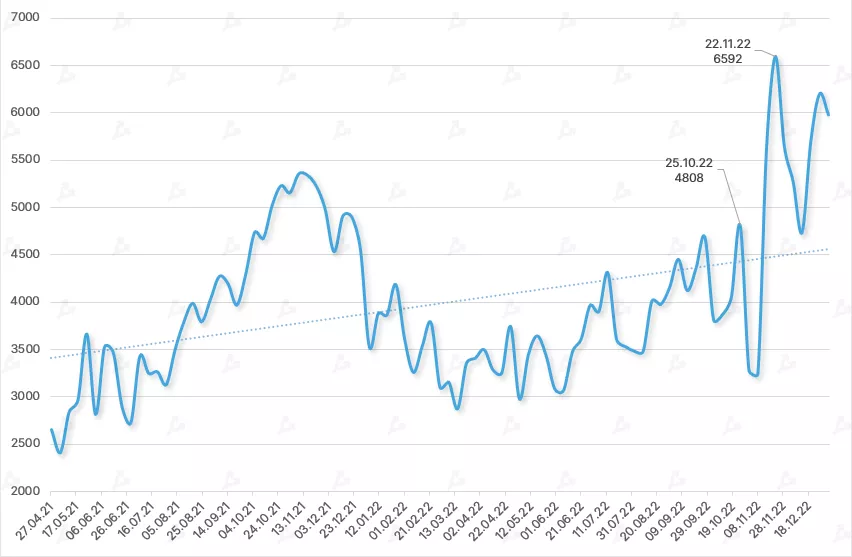
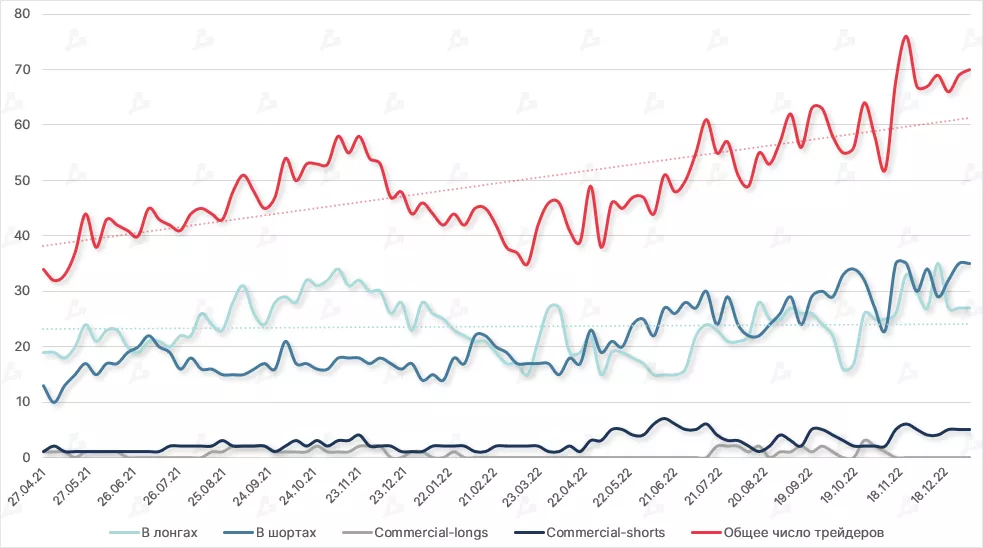
Futures and options
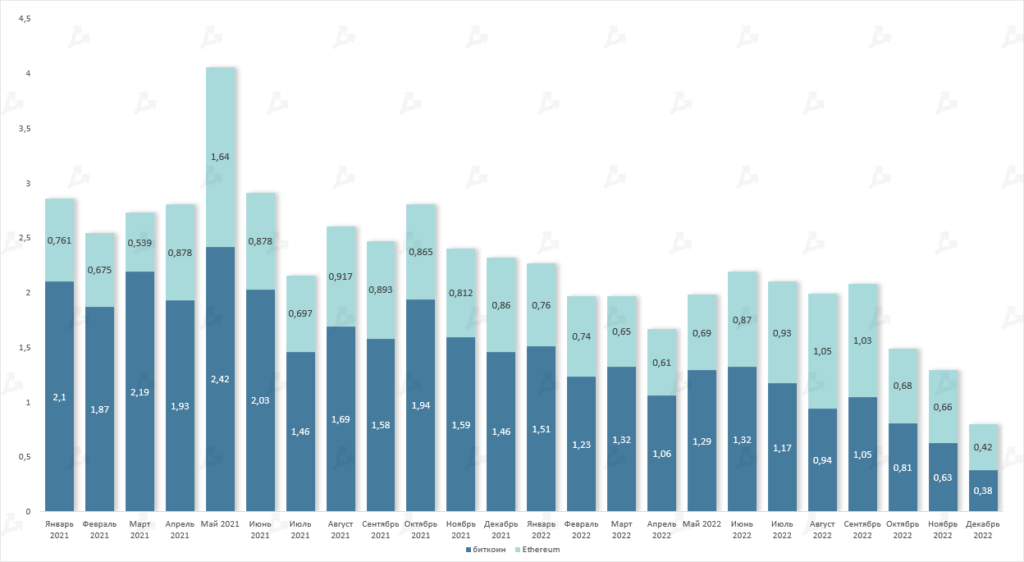
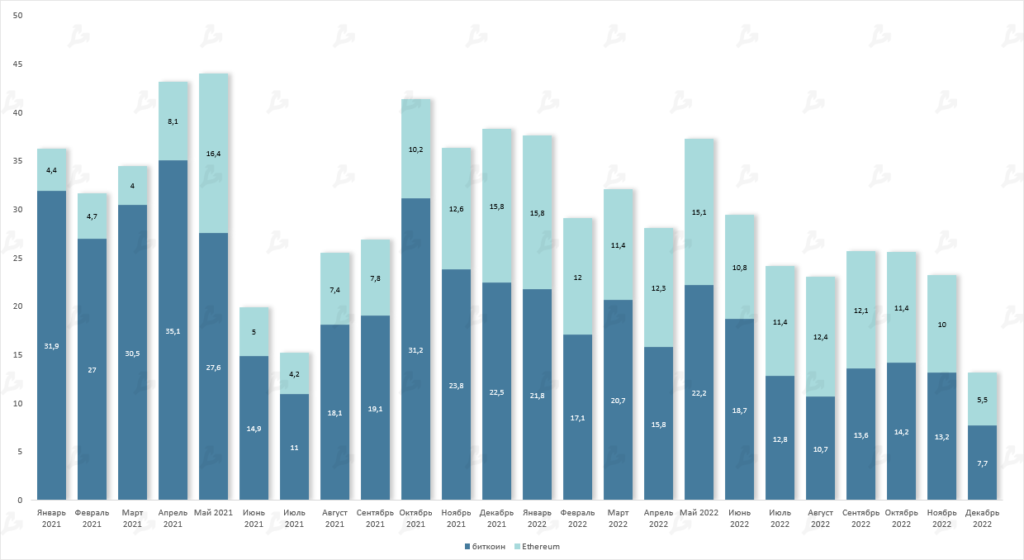
- Trading volumes in the derivatives segment declined sharply in December, with futures and options at multi-year lows. Ethereum contracts remained more active than Bitcoin contracts.
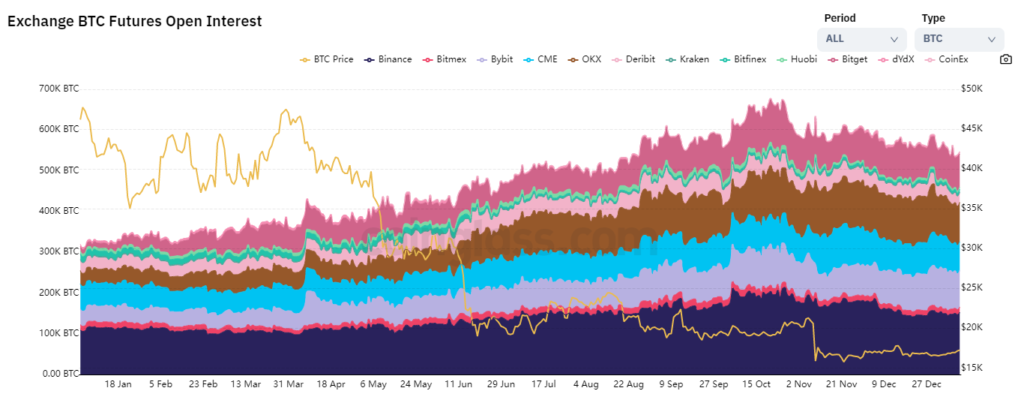
- Open interest in Bitcoin futures declined from peak levels by about 100,000 BTC.
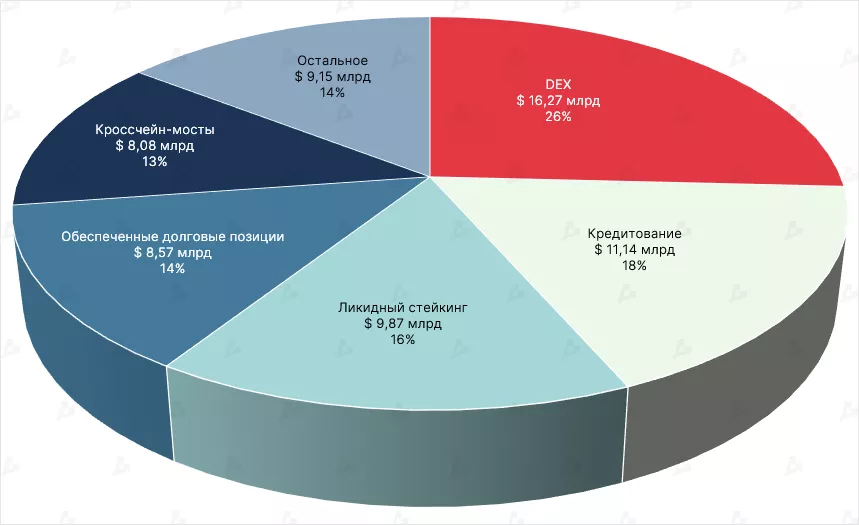
DeFi
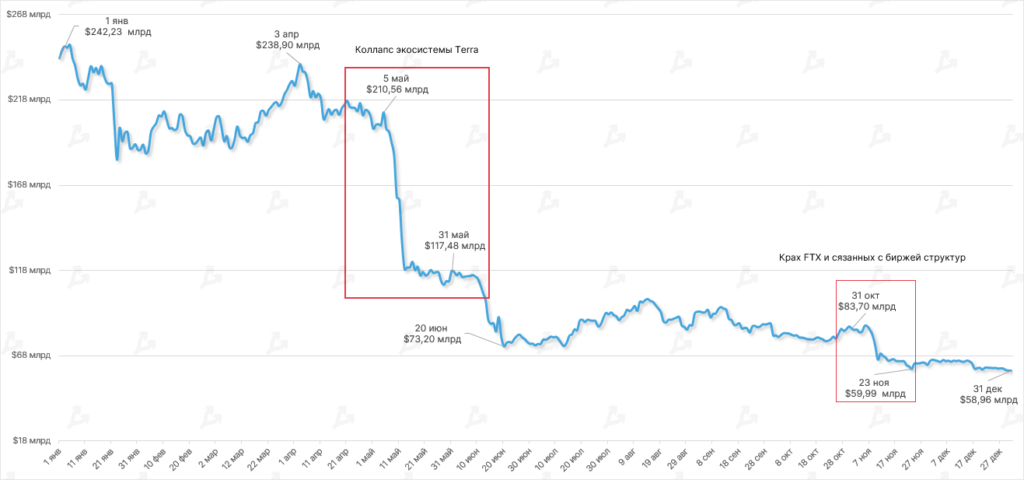
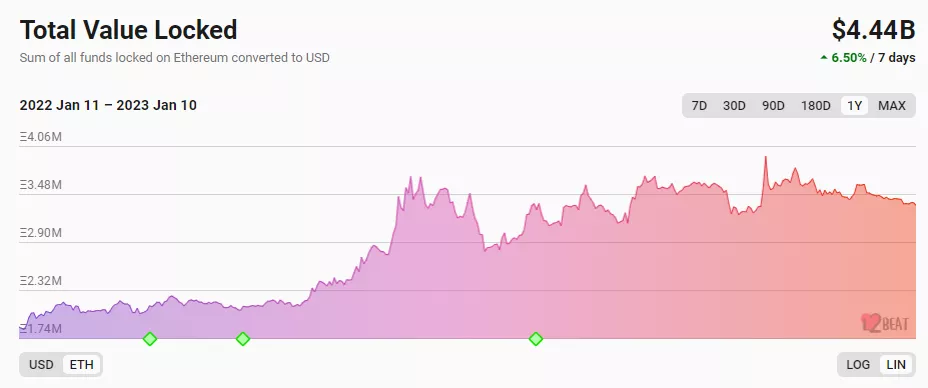
- In 2022 the value of assets locked in smart contracts of DeFi applications fell by 75%, ending December at $58.96 billion. The move was driven by issues in several major projects and a prolonged market correction.
- The largest declines were in May–June and October–November. Terra’s collapse (-44%) and the FTX collapse (-28%) accounted for the bulk of the losses.
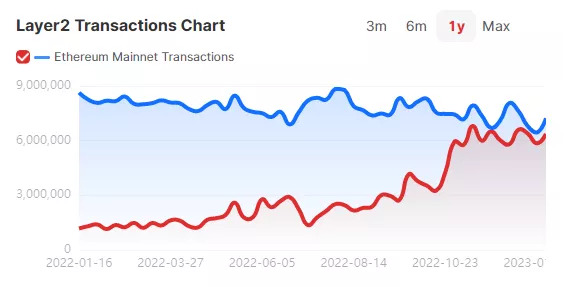
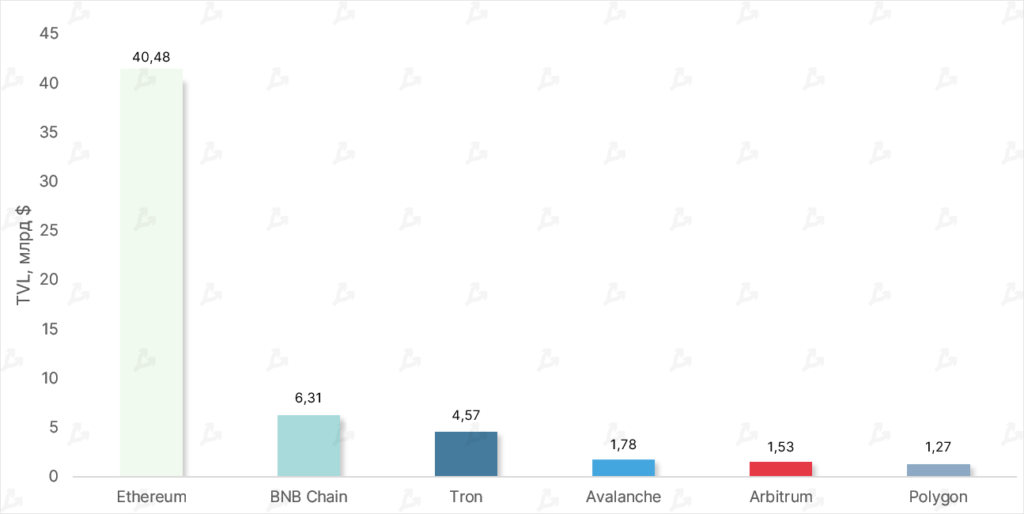
- Ethereum still accounts for the majority of locked assets (over 68%). The ecosystem strengthened its position — in January 2022 the dominance index stood at 62%.
- Solana posted one of the worst dynamics, with TVL down 95% over 12 months. Alameda’s wallets held SOL valued at $1.2 billion (as of June 30), which contributed to price collapse and outflow from smart contracts.
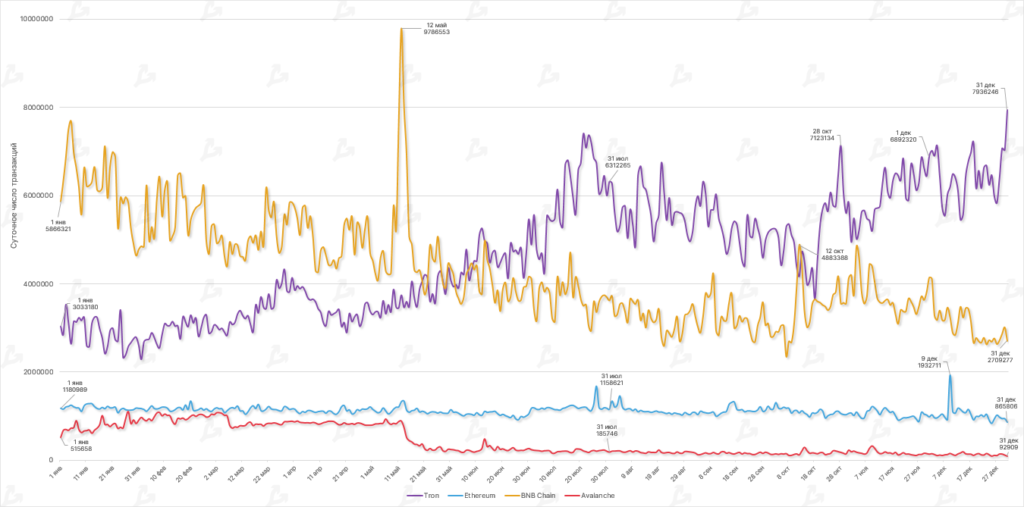
- The struggles of some players spurred growth in others — by year end the top-five by TVL included Tron, Arbitrum and Polygon.
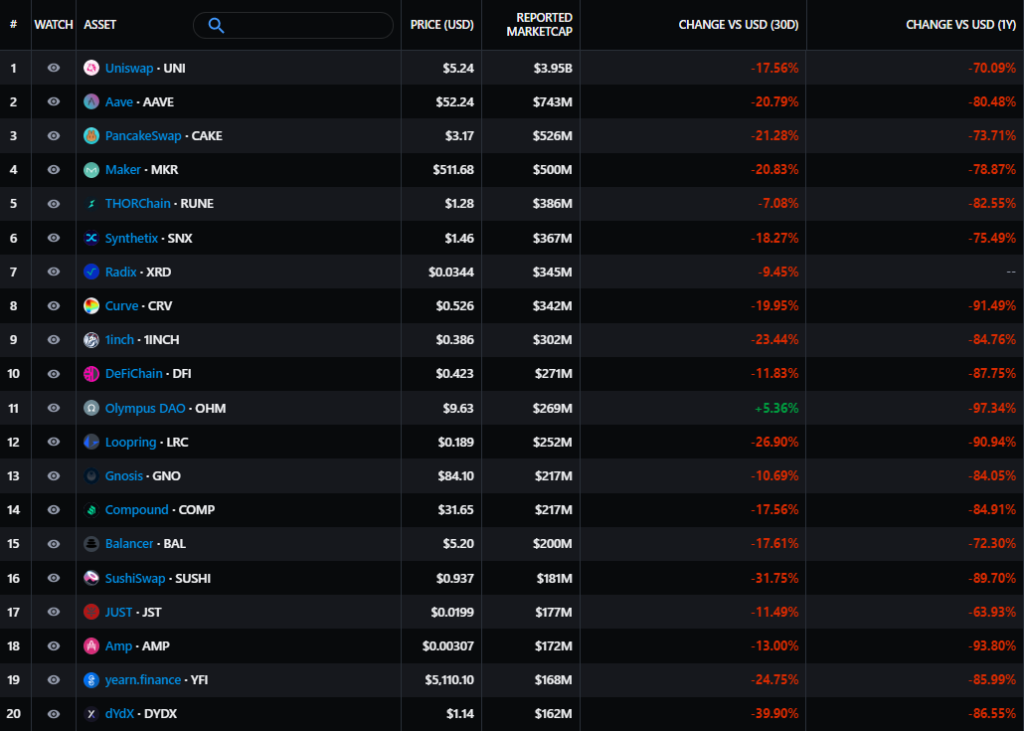
- By year’s end all assets in the DeFi top‑20 by market cap were in the red — prices fell more than 60%. The top token by TVL remained Uniswap (UNI) at about $3.95 billion.
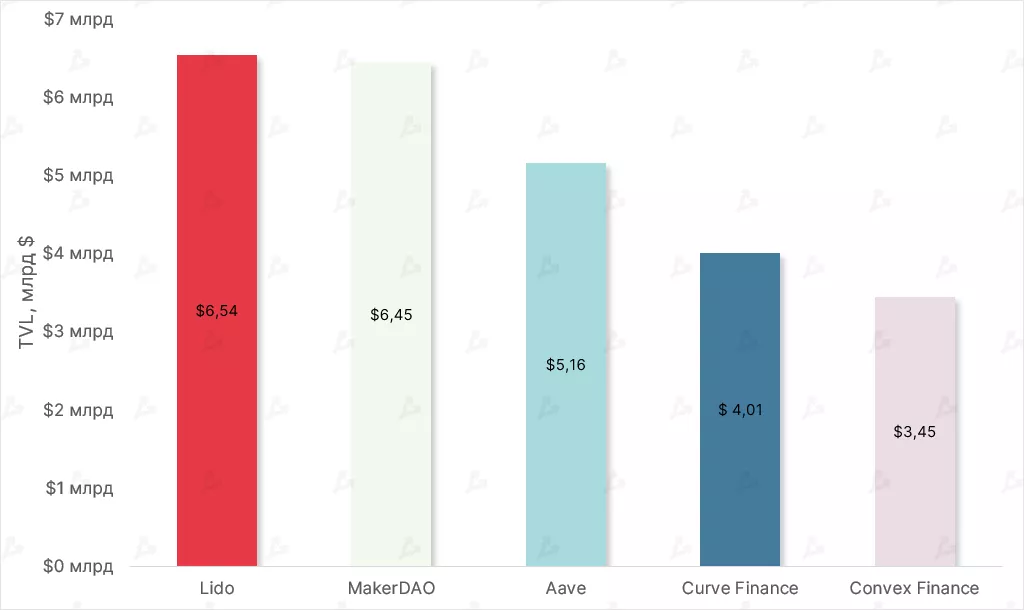
- In Ethereum, leadership by TVL shifted to the liquid staking service Lido. In the wake of the Shanghai hard fork announcement, the Lido lead surpassed MakerDAO.